Summary We monitored sap flow and estimated diurnal changes in transpiration rates of two trembling aspen (Populus tremuloides Michx.) stands, located in the southern boreal forest and aspen parkland of Saskatchewan, Canada. In both stands during the peak growing season (June and July), sap flow during the day (0700--1700 h local time) increased linearly with vapor pressure deficit (VPD) from 0 to about 1 kPa, but then remained remarkably constant at VPD > 1 kPa (up to 4.8 kPa in the aspen parkland stand). The results imply an inverse relationship between stomatal conductance and VPD under well mixed conditions, for VPD > 1 kPa. We postulate that the stomata are operating to maintain leaf water potentials above a critical minimum value, which in turn places a maximum value on the rate of sap flow that can be sustained.
Keywords: aspen parkland, boreal forest, poplar, Populus, transpiration.
Introduction
In the interior of western Canada, regional gradients in cli-matic moisture regimes and hydrological functioning of eco-systems appear to be closely linked to forest distribution (Hogg 1994, 1997). An understanding of the factors controlling forest transpiration is thus especially important in this region, and is critical to predicting how the productivity and hydrology of the boreal forest would respond to a warmer and drier climate. Water vapor flux from different vegetation types in the boreal forest and its control by environmental and ecophysiological factors is one of the major processes being studied in the Boreal Ecosystem--Atmosphere Study (BOREAS, see Sellers et al. 1995).
Trembling aspen (Populus tremuloides Michx.) is the most important deciduous tree species in the western Canadian boreal forest, commonly growing in pure stands, or in mixed stands with white spruce (Picea glauca (Moench) Voss) and other boreal conifers (Peterson and Peterson 1992). In a pre-vious study (Hogg et al. 1997), we collaborated with other BOREAS researchers to examine transpiration rates at the BOREAS Old Aspen site, located in the southern Canadian boreal forest in Prince Albert National Park, Saskatchewan. Transpiration of aspen was measured by two sap flow methods (heat pulse and constant power), alongside tower-based eddy
correlation measurements above and below the aspen canopy (Black et al. 1996). Scaling up the sap flow rates determined by the heat pulse method to the stand level yielded values that were similar to those obtained by the tower-based measure-ments. All three methods showed a linear increase in midday aspen transpiration with increasing vapor pressure deficit (VPD) up to about 1 kPa, beyond which transpiration was relatively constant (VPD 1--2.5 kPa). When taken together with the aerodynamic characteristics of the site, the observed responses indicated significant reductions in canopy conduc-tance when VPD was high (Blanken et al. 1997).
Trembling aspen is also the predominant tree species in the aspen parkland, a vegetation zone that represents a transition between the boreal forest and the prairies to the south (Bird 1961). Although little is known about the ecophysiological functioning of aspen in this climatically warmer and drier vegetation zone, it may provide an analog of the responses of the southern boreal forest to possible climate change (Hogg and Hurdle 1995).
In the present study, we monitored diurnal changes in sap flow and transpiration at a site in the aspen parkland (parkland site), located 100 km due south of the BOREAS Old Aspen site (boreal site). The first objective was to determine relative transpiration responses to VPD at the parkland site, and to make comparisons with similar measurements made at the boreal site. Specifically, we tested the hypothesis that aspen transpiration during the day is insensitive to VPD beyond a threshold value of 1 kPa, even at the high values of VPD that can occur at the parkland site (4.8 kPa in the present study). The second objective was to use the results to develop a simple relationship between VPD and stomatal conductance in aspen, as a contribution to understanding the causes of low forest productivity in the aspen parkland zone.
Materials and methods Description of study sites
The study was conducted in two trembling aspen stands lo-cated in central Saskatchewan, Canada. The boreal site is located in the southern boreal forest of Prince Albert National Park (53°38′ N, 106°12′ W, elevation 600 m). The parkland site is in Batoche National Historic Park (52°44′ N, 106°09′ W,
Sap flow in trembling aspen: implications for stomatal responses to
vapor pressure deficit
E. H. HOGG and P. A. HURDLE
Natural Resources Canada, Canadian Forest Service, Edmonton, Alberta T6H 3S5, Canada
Received July 29, 1996
elevation 500 m), located midway between Saskatoon and Prince Albert. The parkland site is a Canadian Forest Service research site that forms part of the Boreal Forest Transect Case Study (Price and Apps 1995).
The two sites differ in climate, vegetation, tree growth form and productivity (see Hogg and Hurdle 1995). Based on the 1951--1980 climate normals (Environment Canada 1982), the parkland site receives less precipitation (375 mm year−1 at Rosthern, 52°40′ N, 106°20′ W) than the boreal site (462 mm year−1 at Waskesui Lake, 53°55′ N, 106°05′ W). Mean growing season temperatures (May to September) are 14.5 °C at the parkland site and 12.5 °C at the boreal site.
The vegetation of the boreal site consists of an extensive, even-aged stand of trembling aspen, 70--80 years old and 18--22 m tall. The understory is dominated by beaked hazelnut (Corylus cornuta Marsh.) about 2 m tall. The stand is relatively homogeneous except for a few small openings and occasional patches of balsam poplar (Populus balsamifera L.). The site is gently rolling and generally well drained, with a predomi-nantly clay loam soil texture.
The parkland site is in one of the few remaining areas of native aspen parkland. The terrain is rolling and underlain by stabilized sand dunes. The vegetation is heterogeneous, rang-ing from open native grassland with small stunted clones of aspen to more sheltered lowland forests of aspen and balsam poplar with an understory of red osier dogwood (Cornus stolo-nifera Michx.). Trees are stunted in relation to diameter, and are often crooked, leaning, or forked, with heights ranging from < 5 to 15 m (see Hogg and Hurdle 1995). Within the aspen stands, trees from two or more age classes are usually found (maximum age about 85 years). Dense bands of beaked hazel-nut occur on north and east facing slopes, but in most upland areas, the forest understory consists of sparse grasses, herbs and low shrubs (e.g., saskatoon berry, Amelanchier alnifolia Nutt.; choke-cherry, Prunus virginiana L.; and prickly rose, Rosa acicularis Lindl.).
Sap flow by heat pulse method
Aspen clones (patches of genetically identical trees) were readily distinguishable because of differences in bark charac-teristics and phenology. At the boreal site, sap flow was moni-tored on six aspen trees in two adjacent clones from late May to October 1994. At the parkland site (Batoche), sap flow was monitored on twelve aspen trees in three clones from late May to October of both 1994 and 1995. Sap flow was determined every 3 h in 1994 (both sites) and hourly in 1995 (parkland site).
Stand characteristics of the clones monitored are shown in Table 1. At the boreal site, the aspen was relatively homogene-ous but the two clones differed in leaf phenology (Hogg et al. (1997), and were thus referred to as the early-leafing and late-leafing clones (EL and LL). At the parkland site, four stations were established along a 400-m transect extending from grassland to the forest interior, and three trees were monitored each year at each station. One station was located in a small clone of stunted aspen surrounded by grassland (GL clone), two stations were located at the edge and in the
center of a large (200 × 75 m) clone in upland forest next to the grassland (UF clone), and one station was located in the center of a more mesic, lowland forest (LF clone).
Sap (water) flow was measured by the heat pulse method (Marshall 1958, Swanson 1983, 1994), using two thermocou-ples spaced symmetrically 0.75 cm above and below a 5-cm-long heater with a power output of 2 W cm−1. All probe elements had a diameter of 1.6 mm and holes of the same diameter were drilled using a steel template. Thermocouple depth in the sapwood was 1.5 cm for large (> 15 cm diameter) trees and 1.0 cm for smaller trees. Probes were located at a height of about 1.3 m on the north side of the tree and were thermally insulated by wrapping with white polyethylene packing material. At each station, a data logger (Model 21X, Campbell Scientific Instruments, Logan, UT, powered by bat-teries and a solar panel) was used to record the temperature increase at the upper (Tu) and lower (Tl) thermocouples 60 s
after a 4-s heat pulse. On two dates of the year (DOY) in 1994 (boreal site, DOY 192 and 209; parkland site, DOY 190 and 205), one or two probes per station were removed and replaced with new probes at another location on the same tree (all probes were replaced once). In 1995, probes were replaced only as needed.
Uncorrected sap flux density (S, cm h−1) was calculated as (Marshall 1958, Hogg et al. 1997):
S= 4.36 ln(Tu/Tl). (1)
For aspen, we used a thermal conductivity of 0.38 J m−1 s−1°C−1, a bulk density of 0.37 g cm−3 and a gravimetric water content of 100% of actively conducting sapwood. Ideally, conditions of zero sap flow can be identified from Equation 1 when Tu = Tl, if probe spacing is exactly symmetrical and if
wood heat transfer characteristics are precisely homogeneous above and below the heater. In practice, it was necessary to assume that zero sap flow occurred when the minimum value of mean S in each clone was reached (i.e., nights when VPD was near zero, excluding frost events). Thus a zero offset (z) was applied to obtain the ‘‘zero’’ sap flux density (S′), where S′=z+S. The magnitude of z was constant, and normally within ± 0.5 cm h−1; however, it was recalculated when probes
were replaced.
Heat transfer theory indicates that interruption of the sap stream by probes and wounding of adjacent sapwood results in an underestimation of the true sap flux density. For our imple-mentation, wound width was estimated to be 2.0--2.2 mm. Simulations based on a two-dimensional numerical model similar to that described by Swanson and Whitfield (1981) indicated that a correction factor (a) of approximately 2.0 (± 15%) was warranted to obtain the actual sap flux density (S*), where S* = aS′. A similar underestimation of 45% (i.e., a = 1.8) was observed by Cohen et al. (1981).
At each station, measurements of the wound-corrected val-ues of sap flux density (S*) were multiplied by the stand
ratio of aspen stems (at a height of 1.3 m) in one 10 × 10 m plot centered on each station, and FSA is the fraction of BA occu-pied by sapwood. The FSA was calculated based on two radial increment cores from each of four trees per station. The zone of active sapwood within increment cores was identified by staining with a solution of methylene blue in methyl hydrate.
Environmental measurements
At the boreal aspen site (1994), we measured temperature and relative humidity (at a height of 3 m) in conjunction with sap flow measurements. However, in our analysis at this site, we relied primarily on environmental measurements made by other researchers in the BOREAS experiment and by the BOREAS Automatic Meteorological Station network. These measurements were made on or near the main flux tower, located about 1 km west of our sap flow monitoring site. Vapor pressure deficit (VPD) was calculated (Jones 1992) from half-hourly averages of air temperature and vapor pressure or rela-tive humidity at heights of 39 and 4 m. Vapor pressure deficit of the air within the aspen canopy was then estimated as the average VPD at the two heights. We also used the half-hourly measurements of above-canopy solar radiation (39 m), infra-red temperature of the aspen canopy, and measurements of soil water content (0--30 cm depth) made every 1--3 days by time-domain reflectometry (TDR). Details on these measurements are provided by Black et al. (1996) and Blanken et al. (1997). At the parkland site (Batoche), average hourly meteorologi-cal conditions were monitored from an 18-m tower (located along the 400-m transect) and at each of the four stations where sap flow was measured (growing season only). We calculated hourly VPD from in-canopy measurements of temperature and relative humidity made with a shielded Model HMP35C Vais-ala probe (VaisVais-ala Inc., Woburn, MA) at a height of 4 m in the UF (edge) clone. At this station, the aspen is relatively young and the canopy ranged in height from about 2 to 8 m. Volumet-ric water content of soil at 10- and 30-cm depths was moni-tored at each station with Colman fiberglass sensors (Soiltest,
Inc., Evanston, IL) that had been pre-calibrated in the labora-tory with soil samples collected from the site. Hourly measure-ments of global solar radiation (Model SKS1110 silicon pyranometer, Skye Instruments, Powys, U.K.) and wind (Model 05103, R.M. Young, Traverse City, MI; at a height of 15 m, 7 m above the canopy) from the main tower were also used in the analysis. All measurements were recorded by CSI model 21X dataloggers (Campbell Scientific Instruments, Inc.).
Compensation for time lag between sap flow and transpiration
At the boreal aspen site in 1994, sap flow measurements showed a diurnal lag of about 1 h relative to aspen canopy transpiration, as determined by eddy correlation (Hogg et al. 1997). This was a result of diurnal changes in water storage within the tree above the point of sap flow measurement. We compensated for the lag by comparing each sap flow measure-ment (1-min duration) against average VPD and solar radiation for the preceding 2-h period.
At the parkland site, the mean diurnal lag of sap flow was about 0.5 h, based on its relationship with above-canopy water vapor flux measured using a low-cost eddy correlation system mounted on the tower (Hogg and Hurdle, unpublished data). We compensated for this lag by comparing each sap flow reading against the average VPD and solar radiation over the previous 1-h period.
Results and discussion
Seasonal patterns of sap flow and transpiration
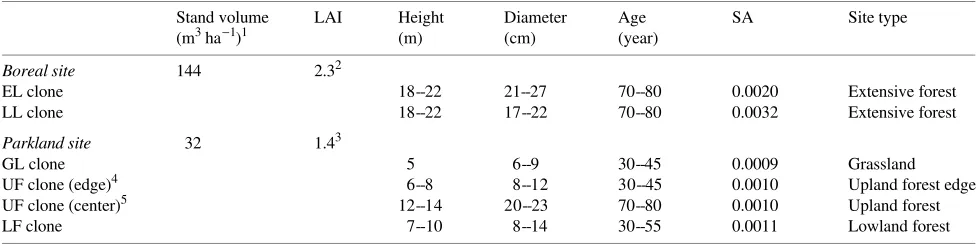
Changes in sap flux density (S′) of trembling aspen are shown for the boreal and parkland sites during the 1994 growing season (Figures 1a and 1b) and for the parkland site in 1995 (Figure 1c). In each case, the increase in S′ at the start of the growing season coincided with the period of rapid leaf expan-sion that was already occurring when probes were installed in Table 1. Stand characteristics of aspen clones. Abbreviations are as follows: LAI = leaf area index; SA = stand sapwood area to ground area ratio; EL = early-leafing; LL = late-leafing; GL = grassland; UF = upland forest; and LF = lowland forest.
Stand volume LAI Height Diameter Age SA Site type
(m3 ha−1)1 (m) (cm) (year)
Boreal site 144 2.32
EL clone 18--22 21--27 70--80 0.0020 Extensive forest
LL clone 18--22 17--22 70--80 0.0032 Extensive forest
Parkland site 32 1.43
GL clone 5 6--9 30--45 0.0009 Grassland
UF clone (edge)4 6--8 8--12 30--45 0.0010 Upland forest edge
UF clone (center)5 12--14 20--23 70--80 0.0010 Upland forest
LF clone 7--10 8--14 30--55 0.0011 Lowland forest
1 Biometry surveys by Halliwell and Apps (1996). 2 Blanken et al. (1997).
3 Estimate based on litter traps. 4
Excluded from 1994 analysis (problems with wounding responses).
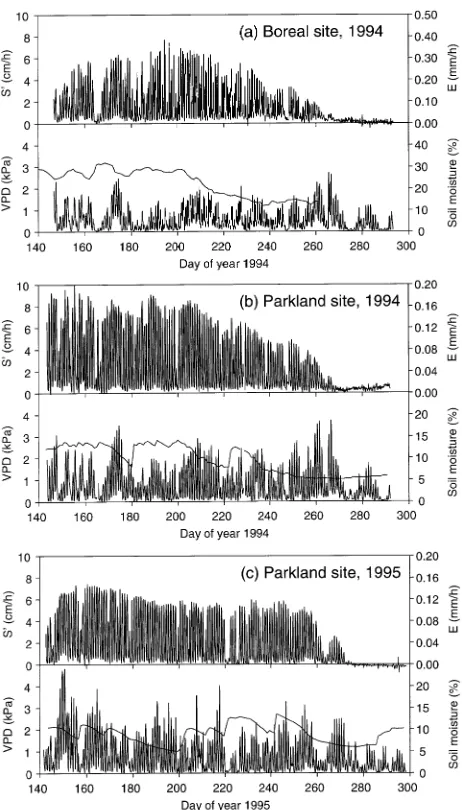
late May (DOY 142--146). The diurnal pattern of sap flow was evident throughout the summer, except on rainy, overcast days with low vapor pressure deficit (VPD) when S′ was near zero. Sap flow collapsed in late September, and diurnal changes were no longer evident after leaf fall was complete, even on days with VPD > 1 kPa, indicating that transpiration through the bark was negligible relative to foliar transpiration.
The maximum volumetric soil water content at the parkland site was considerably lower (about 15%) than at the boreal site (about 30%) (Figures 1a--c) because of differences in soil
texture and water holding capacity (sand versus sandy clay loam). Precipitation was greater than normal at both sites during the 1994 growing season, especially from May to July (Table 2). In August 1994, precipitation continued to be greater than normal at the parkland site, but was only 38% of normal at the boreal site, resulting in a strong decrease in soil water content during the month. This period of soil drying coincided with a decrease in S′ at the boreal site. In 1995, total precipita-tion during the growing season at the parkland site was near average, but May was dry and August had nearly three times the normal precipitation. In contrast to 1994, S′ remained near maximum summer values until mid-September in 1995 (about DOY 256).
Estimates of canopy transpiration rate (E) based on S′ are shown in Figures 1a--c). For ease of presentation, E values are plotted based on a lumped SA of 0.0025 at the boreal site, and 0.0010 at the parkland site (cf. Table 1). Although S′ was generally greater at the parkland site than at the boreal site, the much greater SA of aspen at the boreal site resulted in maxi-mum estimated transpiration rates that were about twice (about 0.4 mm h−1) those at the parkland site (about 0.2 mm h−1). Figure 1. Seasonal changes in mean sap flux density (S′) and estimated
stand transpiration rate (E) of trembling aspen, plotted every 3 h from late May to late October (scaling procedure between S′ and E is described in text). (a) Results from the boreal aspen site in Prince Albert National Park during the 1994 BOREAS field campaign (mean of early-leafing and late-leafing clones); and (b) and (c) results from the parkland aspen site at Batoche in 1994 and 1995, respectively (mean of grassland, upland forest and lowland forest clones). Also shown are changes in vapor pressure deficit (VPD) and volumetric soil water content (data for boreal site provided by BOREAS teams TF-1 and TF-2, Black et al. 1996).
Table 2. Monthly precipitation (mm) recorded at the boreal and parkland sites, and also expressed as a percentage of the long-term average for the closest permanent weather station (Waskesui and Rosthern, Saskatchewan).
Boreal site Parkland site
1994 1994 1995
May 107 (262%) 94 (256%) 4 (11%)
June 107 (151%) 82 (145%) 56 (99%) July 91 (112%) 115 (159%) 61 (84%) August 22 (38%) 61 (132%) 129 (279%) September 13 (25%) 6 (18%) 2 (6%)
May--September 340 (112%) 358 (146%) 252 (103%)
The magnitudes of S′ and E differed among clones, but relative diurnal changes and responses to VPD were similar both at the parkland site (e.g., Figure 2) and the boreal site (Hogg et al. 1997). In the following analyses, therefore, we used the average S′ and E for the clones measured at each site.
Responses to VPD and solar radiation
The period chosen for the analysis of responses to VPD was May 28 to July 31 (DOY 148--212) at the parkland site and June 2 to July 31 (DOY 153--212) at the boreal site. This interval corresponded to the peak growing season period that followed spring leafing of the aspen canopy (occurring about 5 days earlier at the parkland site than at the boreal site), but before the onset of soil drying and reduced sap flow in 1994 (Figures 1a and 1b).
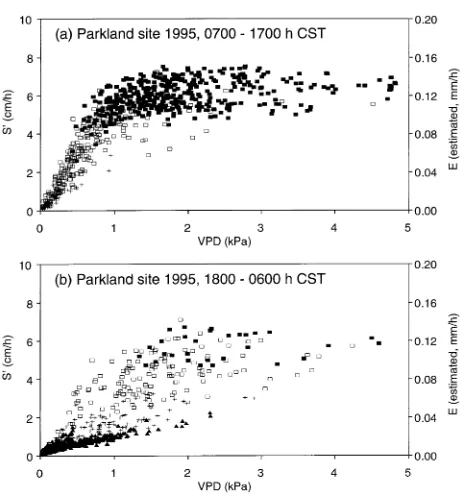
When estimates of daytime transpiration (E, based on S′) were plotted against VPD, the measurements tended to plateau when VPD exceeded about 1 kPa (Figures 3a, 4a and 5a). This pattern was observed at both the boreal (1994) and parkland (1994--95) sites, and was especially evident during a hot period at the parkland site in 1995 (Figure 2), when VPD reached 4.8 kPa on two successive days (May 29--30, DOY 149 and 150). Despite the extreme conditions, maximum E was similar
to that observed on other days with much lower VPD. Soil water content (15--30 cm depth) was near field capacity on the two days with highest VPD (Figure 1c).
When daytime VPD was greater than 1 kPa, solar radiation flux density (Rs) was usually > 400 W m−2 at both sites
(maximum 957 W m−2). Under these conditions, E was rela-tively insensitive to differences in either Rs or VPD
(Fig-ures 3a, 4a and 5a). However, when VPD was less than 1 kPa, there was an approximately linear relationship between E and VPD. Linear regressions between daytime E and VPD, for VPD < 1 kPa only, resulted in r2 values ranging from 0.80 to 0.85 (Table 3).
Evening and nighttime relationships between E (or S′) and VPD are shown in Figures 3b, 4b and 5b. All of the readings with Rs > 400 W m−2 occurred at 1800 h CST and most were
associated with VPD > 1 kPa. Under these conditions (as earlier in the day), E was similar across a wide range of VPDs. Later in the day, E decreased as solar radiation declined to < 400 W m−2, even when VPD remained at high values. This finding is consistent with measurements of reduced stomatal conductance in Populus species at low irradiances (e.g., Ceule-mans et al. 1988, McCaughey and Iacobelli 1994).
At night (with negligible Rs), there were significant positive
linear relationships between E (as estimated from S′) and VPD (Table 3). The strongest relationship (r2 = 0.80) was observed at the parkland site in 1995, where sap flow showed a linear Figure 3. Sap flux density (S′, mean of two clones) and estimated
transpiration rate (E) at the boreal site in relation to mean VPD over the previous 2-h period (based on average VPD above and below and the canopy, from BOREAS teams TF-1 and TF-2). Measurements made every 3 h from June 2 to July 31, 1994 (DOY 153--212) are shown separately for (a) morning to afternoon, 0900--1500 h CST, and (b) evening to dawn, 1800--0600 h CST. Symbols indicate differences in mean solar radiation (Rs) over the previous 2-h period: (j) Rs > 400
W m−2; (h) 100 < Rs < 400 W m−2; (+) 0 < Rs < 100 W m−2; (m)
negligible Rs (i.e., readings from −5 to 0 W m−2).
increase over the full range of nighttime VPDs observed (0--2.3 kPa, Figure 5b). Nighttime sap flow has previously been measured by the heat pulse technique, and its occurrence has been attributed to either nocturnal recharging of water in the xylem (Lopushinsky 1986, Caspari et al. 1993) or noctur-nal transpiration (Green et al. 1989). Presumably, both mecha-nisms were operating in the present study. The use of a 0. 5--1 h lag to describe the relationships between sap flow and VPD
should have removed at least some of the effect of hydraulic capacitance within the tree. However, if water recharge in the xylem is slower at night than during the day, then our estimates of E based on sap flow measurements would be greater than the actual transpiration rate (i.e., water vapor leaving the can-opy).
Inferred stomatal responses
The tendency for daytime transpiration rates to saturate at high VPD has been previously reported in tropical rain forest (Meinzer et al. 1993, Granier et al. 1996) and in temperate forests and woodlands (e.g., Lopushinsky 1986, Price and Black 1989, Goulden and Field 1994). In forests with a high aerodynamic conductance and a low decoupling coefficient (Ω, Jarvis and McNaughton 1986), this type of response is caused primarily by gradual stomatal closure as the VPD of ambient air (e.g., above or within canopy) increases. Under these circumstances, the vapor pressure gradient across the stomata approaches ambient VPD. Thus, canopy physiological conductance (gc) is similar to total conductance (gt), and gt can
be determined from E and ambient VPD (Köstner et al. 1992; see also Arneth et al. 1996, Granier et al. 1996):
gc≈gt=kE/VPD, (2)
where k = ρwGvTk; and ρw (density of water) = about 1000 kg
m−3, Gv (gas constant for water vapor) = 0.462 m3 kPa kg−1
K−1, and Tk is air temperature in K. The conversion factor, k,
takes a value of about 38 at 20 °C if gt or gc is expressed in units
of mm s−1. Estimates of stomatal conductance (gs) can then be
obtained from gc, where gs ≈ gc/LAI. Reasonable estimates can
be obtained from these simple relationships, but only for vege-tation types with low values of Ω. This primarily includes coniferous forests, but some deciduous forests also fall into this category; e.g., Ω = 0.2 in a European beech (Fagus sylva-tica L.) forest (Herbst 1995). The boreal aspen stand also had a low decoupling coefficient during the day (mean Ω = 0.31, Blanken et al. 1997), and leaf temperatures, measured by infrared thermometry, were similar to air temperature (mean Figure 5. Hourly sap flux density (S′, mean of three clones) and
estimated transpiration rate (E) of trembling aspen at the parkland site in 1995 (DOY 148--212), in relation to mean VPD (as described for Figure 4). Measurements are shown separately for (a) morning to afternoon, 0700--1700 h CST, and (b) evening to dawn, 1800--0600 h CST. Symbols are as described in Figure 3, based on mean Rs over the
previous 1-h period.
Table 3. Linear regressions of estimated transpiration rate (E, mm h−1) in relation to VPD (kPa), based on (a) daytime (0700--1700 h CST) sap flux measurements when VPD < 1 kPa, and (b) nighttime sap flux measurements with negligible solar radiation, for the peak growing season period (dates as in Figures 3--5). All regressions are statistically significant (P < 0.001). Also shown are preliminary estimates of gc and gs based on the
slope (b) of the relationship between E and VPD, where gc = 38b (Equation 2) and gs = gc/LAI.
Site Year Regression equation n1 r2 estimated gc estimated gs
Daytime
Boreal 1994 E = 0.301 VPD -- 0.004 134 0.838 11.4 5.0
Parkland 1994 E = 0.158 VPD -- 0.000 103 0.795 6.0 4.3
Parkland 1995 E = 0.118 VPD -- 0.001 310 0.847 4.5 3.2
Nighttime
Boreal 1994 E = 0.032 VPD + 0.018 121 0.567 1.2 0.54
Parkland 1994 E = 0.018 VPD + 0.008 132 0.531 0.7 0.49
Parkland 1995 E = 0.016 VPD + 0.006 498 0.798 0.6 0.43
1
absolute temperature difference of 0.7 °C during the day). This is presumably because of the small leaf size (3--4 cm in length and width) together with the flattened petioles, which promote fluttering of trembling aspen leaves, even in light breezes (see Roden and Pearcy 1993).
Based on the assumption that Ω is low in both aspen stands examined in this study, gc and gs can be crudely estimated from
our sap flow measurements using, for example, the slope b of regressions between E and VPD (Table 3). The small intercept values may be neglected in each of the regressions shown, because they fall within the range of error in defining zero sap flow (see Methods). Using this approach, estimated aspen gc
during the day for VPD < 1 kPa was greater (11.4 mm s−1) at the boreal site than at the parkland site (6.0 mm s−1) in 1994 (Table 3). However, the difference can be largely attributed to the greater LAI at the boreal site (2.3) compared to the parkland site (1.4); estimated gs at the two sites (i.e., gc/LAI)
was similar (5.0 and 4.3 mm s−1), given the potential sources of error. Estimated values of gc and gs were smaller at the
parkland site in 1995, presumably because of the drier soil conditions.
From Table 3, estimated nighttime gs was near 0.5 mm s−1,
or about 10--12% of the daytime gs, at each site. However, these
values may be overestimates if some of the observed sap flow was associated with nocturnal recharge of water within the stem.
Our quantitative estimates of gc and gs may also be affected
by several sources of error. First, we have assumed that aero-dynamic conductance is high relative to gc, which may not
always be the case (e.g., when wind speed is very low). Sec-ond, the most recent estimates of aspen transpiration from this site, based on eddy correlation measurements corrected for available energy (Blanken et al. 1997), are about 10--20% greater than our estimates based on sap flow. If these factors are considered, our estimates of gs for the boreal site are
comparable to the values of 4--10 mm s−1 obtained by McCaughey and Iacobelli (1994) and Dang et al. (1997) for leaf-level gs in aspen at low VPD.
Responses of gc or gs to environmental conditions can also
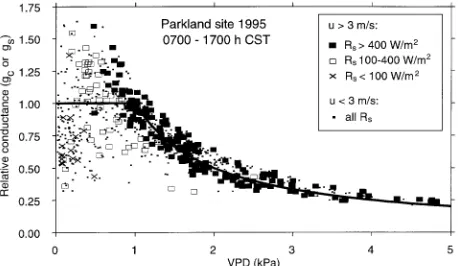
be inferred from our sap flow measurements using Equation 2. However, the reliability of this approach will tend to decrease when wind speed (µ) and aerodynamic conductance are low, resulting in higher values of Ω (Jarvis and McNaughton 1986). In the analysis shown for the parkland site in 1995 (Fig-ure 6), we separately plotted the estimated conductances for µ > 3 m s−1 from those obtained when µ < 3 m s−1 (height of measurement = 15 m). The larger symbols give the range of Rs
associated with each measurement, for µ > 3 m s−1 only. The
conductance estimates shown are values of gs or gc, expressed
as a proportion of their estimated value for VPD < 1 kPa (4.5 and 3.2 mm s−1, from Table 3).
For VPD > 1 kPa, there was an inverse relationship between estimated relative conductances and VPD for all daytime data (Figure 6), although for readings with µ > 3 m s−1, the relation-ship between conductance and 1/VPD was greater (r2 = 0.86; n = 170) than for readings with µ < 3 m s−1 (r2 = 0.77; n = 241). For VPD values between 0 and 1 kPa, estimates of
relative conductance appeared to be less tightly coupled to VPD. The approximately linear relationship between E and VPD (e.g., Table 3, Figure 5a) suggests that conductances are relatively constant over this range. However, the more detailed analysis (Figure 6) showed a more complex relationship, where low values of Rs were usually associated with low VPD,
but at a given Rs, conductance continued to increase as VPD
decreased below 1 kPa.
Our general conclusion that gradual stomatal closure occurs at high VPD is supported by other measurements on aspen at both the leaf level (e.g., McCaughey and Iacobelli 1994, Dang et al. 1997) and canopy level (Blanken et al. 1997). Compara-ble responses to VPD are also evident in other types of forest (e.g., Arneth et al. 1996, Granier et al. 1996). However, our observation of a constant transpiration rate above a certain VPD threshold, and the implication that gs varies with 1/VPD
under dry, well-mixed conditions, has not been reported else-where.
An intriguing aspect of the results is that stomata appear to maintain a relatively constant transpiration rate over a wide range of environmental conditions. This finding could be ex-plained by leaf-level models that link stomatal responses to photosynthesis rates and environmental conditions at the leaf surface (e.g., Collatz et al. 1991). An alternative interpretation is that when VPD is high, stomata need to close sufficiently to maintain the water potential above a critical minimum thresh-old, below which irreversible damage might occur, e.g., by cavitation of xylem (Tyree and Sperry 1988, Sperry and Pock-man 1993). Thus, the hydraulic resistance from soil to leaf may ultimately determine the maximum transpiration rate that can be sustained by the plant (Meinzer and Grantz 1990). Recent evidence suggests that this mechanism provides the best gen-eral explanation for age-related reductions in forest height growth and productivity (Gower et al. 1996, Ryan and Yoder 1997).
Figure 6. Responses of estimated aspen conductance (gc or gs) to VPD,
based on hourly daytime (0700--1700 h CST) sap flow measurements at the parkland site on 65 days in 1995 (DOY 148--212). Conductances are based on Equation 2 and are expressed as a proportion relative to the estimates in Table 3. Symbols denote average wind speeds (µ) and (for µ > 3 m s−1 only) solar radiation (Rs) during the hour before each
For this mechanism to operate in aspen, we postulate that stomatal closure occurs over a narrow range of leaf water potentials. This is true for some clones and hybrids of Populus, which show abrupt closure of stomata as leaf water potential is experimentally lowered below −2 MPa (Ceulemans et al. 1988), but it remains to be shown that the response is similar in trembling aspen.
Conclusions
Sap flow measurements made continuously over several weeks or more can be useful for exploring general relationships between forest canopies and changes in environmental condi-tions. Caution is needed in using this method for quantitative estimates of transpiration at the stand level, because of the potential for progressive wounding responses and errors asso-ciated with variation in sap flow rates within and among individual trees (see Cohen et al. 1985, Swanson 1994, Hatton et al. 1995). However, sap flow measurements have several advantages over other methods, because they provide a direct measurement of changes in transpiration at the scale of indi-vidual trees (Hogg et al. 1997).
We explored the potential of sap flow measurements as a means of inferring stomatal responses to changes in environ-mental conditions. Although the approach was relatively sim-plistic, the data provide strong evidence for an upper limit to the transpiration rate of aspen, which constrains stomatal con-ductance to an approximately inverse relationship with VPD. This conclusion applied equally well at both the parkland and boreal sites, despite the major differences in aspen growth form and site characteristics. However, because VPD is gener-ally higher in the parkland, it is likely to exert a greater inhibitory effect on stomatal conductance in this region. This may partially explain why aspen productivity is lower in the parkland region than in the boreal forest.
A more powerful approach for future investigation would be to conduct simultaneous measurements made at the scale of the individual leaf (e.g., porometry and leaf water potential), branch (branch bags, see Dufrêne et al. 1993), tree (sap flow), and stand (micrometeorological methods, including eddy cor-relation). A study of stomatal responses to experimental ma-nipulations such as partial removal of leaf area (Meinzer and Grantz 1990) or restriction of water flow in the xylem (Sperry and Pockman 1993) would also be useful in determining the influence of hydraulic resistance on transpiration rates in aspen and other species.
Acknowledgments
This work has greatly benefited from the collaboration with other BOREAS investigators, especially T.A. Black and M.G. Ryan. We gratefully acknowledge the half-hourly meteorological information and soil water data that were made available for our analysis of sap flow at the boreal (Old Aspen) site. Field operations were made possible by the support of personnel at Batoche National Historic Park (Y. Racine and R. Fidler) and Prince Albert National Park (M. Dalman, P. Pacholek and M. Heap), and we thank T. Sturko for field assistance at the Batoche site. This study was supported by Green Plan funding (NOR-1683) within the Department of Natural Resources Canada.
References
Arneth, A., F.M. Kelliher, G. Bauer, D.Y. Hollinger, J.N. Byers, J.E. Hunt, T.M. McSeveny, W. Ziegler, N.N. Vygodskaya, I. Milukova, A. Sogochov, A. Varlagin and E.-D. Schulze. 1996. Environmental regulation of xylem sap flow and total conductance of Larix gme-linii trees in eastern Siberia. Tree Physiol. 16:247--255.
Bird, R.D. 1961. Ecology of the aspen parkland of western Canada in relation to land use. Can. Dept. Agric., Research Branch, Publ. 1066, Ottawa, ON, Canada, 155 p.
Black, T.A., G. den Hartog, H.H. Neumann, P.D. Blanken, P.C. Yang, C. Russell, Z. Nesic, X. Lee, S.G. Chen, R. Staebler and M.D. Novak. 1996. Annual cycles of water vapor and carbon dioxide fluxes in and above a boreal aspen forest. Global Change Biol. 2:219--229.
Blanken, P.D., T.A. Black, G. den Hartog, H.H. Neumann, P.C. Yang, Z. Nesic, X. Lee, R. Staebler and M.D. Novak. 1997. Eddy correla-tion measurements of evapotranspiracorrela-tion within and above a boreal aspen forest. J. Geophys. Res. In press.
Caspari, H.W., S.R. Green and W.R.N. Edwards. 1993. Transpiration of well-watered and water-stressed Asian pear trees as determined by lysimetry, heat-pulse, and estimated by a Penman-Monteith model. Agric. For. Meteorol. 67:13--27.
Ceulemans, R., I. Impens and R. Imler. 1988. Stomatal conductance and stomatal behaviour in Populus clones and hybrids. Can. J. Bot. 66:1404--1414.
Cohen, Y., M. Fuchs and G.C. Green. 1981. Improvements of the heat pulse method for determining sap flow in trees. Plant Cell Environ. 4:391--397.
Cohen, Y., F.M. Kelliher and T.A. Black. 1985. Determination of sap flow in Douglas-fir trees using the heat pulse technique. Can. J. For. Res. 15:422--428.
Collatz, G.J., J.T. Ball, C. Grivet and J.A. Berry. 1991. Physiological and environmental regulation of stomatal conductance, photosyn-thesis and transpiration: a model that includes a laminar boundary layer. Agric. For. Meteorol. 54:107--136.
Dang, Q.-L., H. Margolis, M.R. Coyea, M. Sy and G.J. Collatz. 1997. Regulation of branch-level gas exchange of boreal trees: roles of shoot water potential and vapor pressure difference. Tree Physiol. 17:521--535.
Dufrêne, E., J.-Y. Pontailler and B. Saugier. 1993. A branch bag technique for simultaneous CO2 enrichment and assimilation
meas-urements on beech (Fagus sylvatica L.). Plant Cell Environ. 16:1131--1138.
Environment Canada. 1982. Canadian climatic normals 1951--1980. Temperature and precipitation. Prairie Provinces. Atmospheric En-vironment Service, Downsview, ON, Canada, 429 p.
Goulden, M.L. and C.B. Field. 1994. Three methods for monitoring the gas exchange of individual tree canopies: ventilated-chamber, sap-flow and Penman-Monteith measurements on evergreen oaks. Funct. Ecol. 8:125--135.
Gower, S.T., R.E. McMurtrie and D. Murty. 1996. Aboveground net primary production with stand age: potential causes. Trends Ecol. Evol. 11:378--382.
Granier, A., R. Huc and S.T. Barigah. 1996. Transpiration of natural rain forest and its dependence on climatic factors. Agric. For. Meteorol. 78:19--29.
Green, S.R., K.G. McNaughton and B.E. Clothier. 1989. Observations of night-time water use in kiwifruit vines and apple trees. Agric. For. Meteorol. 48:251--261.
Hatton, T.J, S.J. Moore and P.H. Reece. 1995. Estimating stand tran-spiration in a Eucalyptus populnea woodland with the heat pulse method: measurement errors and sampling strategies. Tree Physiol. 15:219--227.
Herbst, M. 1995. Stomatal behaviour in a beech canopy: an analysis of Bowen ratio measurements compared with porometer data. Plant Cell Environ. 18:1010--1018.
Hogg, E.H. 1994. Climate and the southern limit of the western Canadian boreal forest. Can. J. For. Res. 24:1835--1845.
Hogg, E.H. 1997. Temporal scaling of moisture and the forest--grass-land boundary in western Canada. Agric. For. Meteorol. In press. Hogg, E.H. and P.A. Hurdle. 1995. The aspen parkland in western
Canada: a dry-climate analogue for the future boreal forest? Water Air Soil Pollut. 82:391--400.
Hogg, E.H., T.A. Black, G. den Hartog, H.H. Neumann, R. Zimmer-mann, P.A. Hurdle, P.D. Blanken, Z. Nesic, P.C. Yang, R.M. Stae-bler, K.C. McDonald and R. Oren. 1997. A comparison of sap flow and eddy fluxes of water vapor from a boreal deciduous forest. J. Geophys. Res. In press.
Jarvis, P.G. and K.G. McNaughton. 1986. Stomatal control of transpi-ration: scaling up from leaf to region. Adv. Ecol. Res. 15:1--49. Jones, H.G. 1992. Plants and microclimate, a quantitative approach to
environmental plant physiology, 2nd Edn. Cambridge University Press, Cambridge, U.K., 428 p.
Köstner, B.M.M., E.-D. Schulze, F.M. Kelliher, D.Y. Hollinger, J.N. Byers, J.E. Hunt, T.M. McSeveny, R. Meserth and P.L. Weir. 1992. Transpiration and canopy conductance in a pristine broad-leaved forest of Nothofagus: an analysis of xylem sap flow and eddy correlation measurements. Oecologia 91:350--359.
Lopushinsky, W. 1986. Seasonal and diurnal trends of heat pulse velocity in Douglas-fir and ponderosa pine. Can. J. For. Res. 16:814--821.
Marshall, D.C. 1958. Measurement of sap flow in conifers by heat transport. Plant Physiol. 33:385--396.
McCaughey, J.H. and A. Iacobelli. 1994. Modelling stomatal conduc-tance in a northern deciduous forest, Chalk River, Ontario. Can. J. For. Res. 24:904--910.
Meinzer, F.C. and D.A. Grantz. 1990. Stomatal and hydraulic conduc-tance in growing sugarcane: stomatal adjustment to water transport capacity. Plant Cell Environ. 13:383--388.
Meinzer, F.C., G. Goldstein, N.M. Holbrook, P. Jackson and J. Cav-elier. 1993. Stomatal and environmental control of transpiration in a lowland tropical forest tree. Plant Cell Environ. 16:429--436. Peterson, E.B. and N.M. Peterson. 1992. Ecology, management, and
use of aspen and balsam poplar in the Prairie Provinces, Canada. Forestry Canada, Northern Forestry Center, Special Report 1, Ed-monton, AB, 252 p.
Price, D.T. and M.J. Apps. 1995. The boreal forest transect case study: global change effects on ecosystem processes and carbon dynamics in boreal Canada. Water Air Soil Pollut. 82:203--214.
Price, D.T. and T.A. Black. 1989. Estimation of forest transpiration and CO2 uptake using the Penman-Monteith equation and a
physi-ological photosynthesis model. Proc. Workshop Estimation of Areal Evapotranspiration. IAHS Press, Oxon, U.K., Publ. No. 177, pp 213--227.
Roden, J.S. and R.W. Pearcy. 1993. The effect of flutter on the temperature of poplar leaves and its implication for carbon gain. Plant Cell Environ. 16:571--577.
Ryan, M.G. and B.J. Yoder. 1997. Hydraulic limits to tree height and growth. Bioscience. In press.
Sellers, P.J., F. Hall, H. Margolis, B. Kelly, D. Baldocchi, G. den Hartog, J. Cihlar, M.G. Ryan, B. Goodison, P. Crill, K.J. Ranson, D. Lettenmaier and D.E. Wickland. 1995. The boreal ecosystem--atmosphere study (BOREAS): An overview and early results from the 1994 field year. Bull. Am. Meteorol. Soc. 76:1549--1577. Sperry, J.S. and W.T. Pockman. 1993. Limitation of transpiration by
hydraulic conductance and xylem cavitation in Betula occidentalis. Plant Cell Environ. 16:279--287.
Swanson, R.H. 1983. Numerical and experimental analyses of im-planted-probe heat pulse velocity theory. Ph.D. Thesis, Univ. Al-berta, Edmonton, AB, Canada, 298 p.
Swanson, R.H. 1994. Significant historical developments in thermal methods for measuring sap flow in trees. Agric. For. Meteorol. 72:113--132.
Swanson, R.H. and D.W.A. Whitfield. 1981. A numerical analysis of heat pulse velocity theory and practice. J. Exp. Bot. 32:221--239. Tyree, M.T. and J.S. Sperry. 1988. Do woody plants operate near the