Anthropometry of the Singaporean and Indonesian populations
Tan Kay Chuan
*
, Markus Hartono, Naresh Kumar
Department of Industrial and Systems Engineering, National University of Singapore, Singaporea r t i c l e
i n f o
Article history:
Received 16 December 2009 Received in revised form 10 March 2010 Accepted 3 May 2010 Available online 26 May 2010
Keywords: Anthropometry Body mass index (BMI) Singaporean Indonesian
a b s t r a c t
This research collected anthropometric data of the Singaporean and Indonesian populations. The data were mainly from university students. In total, 245 male and 132 female subjects from Indonesia and 206 male and 109 female subjects from Singapore were measured. The Singapore data were divided into three sub-groups, comprising Singapore overall, Singapore citizens, and the Chinese ethnic sub-group. The Indonesians data were divided into two sub-groups, comprising Indonesia citizens and Indonesia Chinese. This study used 36 measurement dimensions. The authors made a comparison with previous anthropometric data collected in 1990 of over a thousand Singaporeans.
The main contributions of this study are: i) an updated anthropometric database of Singaporeans and Indonesians, ii) a comparison of the two samples obtained, and iii) a projection of dimensional changes over time from comparing past to more recent anthropometric data. Statistical analyses show that Singaporeans (both male and female) tend to have larger dimensions than Indonesians in general. In addition, the data reveal the current sample to be significantly larger on more than 50 percent of the dimensions measured, for both males and females.
In providing instances of possible application, the Body Mass Index (BMI) of all sub-groups was calculated. The results show both samples to have normal indexes with BMIs in the range of 18.5e25.0.
This paper presents also an empirical estimation of unknown anthropometric characteristics using the Ratio Scaling Method. The purpose is to estimate uncollected anthropometric data based on a given scaling dimension. Overall, the reported anthropometric data and analyses can be used as relevant consideration in product and systems design.
Relevance to industry:Thefindings of this study indicate differences between Singaporean and Indone-sian anthropometry in the citizen and Chinese sub-groups. The utilization of an updated anthropometric database that incorporates geographical origin and ethnic group is useful. Product designers would be able to cater to a wider range of target users.
Ó2010 Elsevier B.V. All rights reserved.
1. Introduction
Products can be deemed successful only when people are able to
use them well. This is in accordance with the fundamental principle
of ergonomics which is to
fi
t the task to the human (
Kroemer and
Grandjean, 1997
). In doing so, a high level of safety and worker
ef
fi
ciency can be achieved. This means of user-centered design
involves the product, the user, and the task. However, variation in
body dimension among people, between the sexes, and among
different races, can make product design problematic. While it is
impossible to design systems to suit all body types and sizes, it is
prudent to deal at least with the important dimensions. Thus,
anthropometry should be taken into account. Anthropometric data
are useful in achieving effective design for high performance and
productivity (
Klamklay et al., 2008
). Nowadays, the collection of
anthropometric had been conducted through a sophisticated
technology (i.e. three-dimensional measurement) which even
proposing an error detection procedure (
Park et al., 2009
). A lack of
anthropometric consideration in equipment design may lead to
work-related injuries such as musculoskeletal disorder.
There exists anthropometry data of several Asia Paci
fi
c
pop-ulations. Examples include the hand anthropometry of Jordanian
(
Mandahawi et al., 2008
), static anthropometry of Tehran
University students (
Mououdi, 1997
), anthropometry of the
elderly in Australia (
Kothiyal and Tettey, 2000
), anthropometry
of Taiwanese women (
Huang and You, 1994
), anthropometry of
Portuguese workers (
Barroso et al., 2005
), anthropometry of
Turkish woman (
Gonen et al., 1991
), anthropometry of the
Turkish population (
_
Is¸eri and Arslan, 2009
), anthropometry of
the Thai population (
Klamklay et al., 2008
), anthropometry of
*Corresponding author. Tel.:þ65 6516 3128; fax:þ65 777 1434. E-mail address:[email protected](T.K. Chuan).
Contents lists available at
ScienceDirect
International Journal of Industrial Ergonomics
j o u r n a l h o m e p a g e : w w w . e l s e v i e r . c o m / l o c a t e / e r g o n
0169-8141/$esee front matterÓ2010 Elsevier B.V. All rights reserved. doi:10.1016/j.ergon.2010.05.001
Bahraini school children (
Al-Ansari and Mokdad, 2009
),
anthro-pometry of north eastern Indian female farm workers (
Dewangan
et al., 2008
), and anthropometry of Sri Lankan university students
(
Thariq et al., 2010
). Since 1990, however, there has been no
publi-cation of anthropometric data of the Singaporean population. This
research updates the anthropometric data of Singaporeans. We
analyze differences in data collected in 1990 and today. Inspired by
Lin et al. (2004)
, we compared the anthropometric characteristics of
two groups of people in South-east Asia. This study analyzed
signi
fi
cant differences in body dimensions found between the
Sin-gaporean and Indonesian samples. Several sub-groups were
covered, including population overall, citizens only, and an ethnic
sub-group.
This research had four objectives. The
fi
rst objective was to
examine and compare the physical measurements of the
Singa-porean and Indonesian samples for all three sub-groups. The
second objective was to analyze differences between the old and
the new anthropometric data of the Singaporean samples. The third
objective was to shed light on an important application of
anthropometric data. The Body Mass Index (BMI) is taken as an
illustrative application that can describe the health of Singaporeans
and Indonesians. The
fi
nal objective was to conduct an empirical
estimation of unknown anthropometric characteristics using the
Ratio Scaling Method as pioneered by
Pheasant (1982)
.
2. Method
This research is a combination of two anthropometric data
gathering exercises as mentioned earlier. The study and data
gathering were carried out over a period of 36 months.
2.1. Subjects
Male and female students from a university in Singapore and
a university in Indonesia voluntarily participated in this study. In
total, 245 male and 132 female subjects from Indonesia (total of 377
subjects) and 206 male and 109 female subjects from Singapore
(total of 315 subjects) with ages ranged from 18 to 45 years, were
measured (grand total is 692 subjects).
In Indonesia, there were 245 males and 132 females in citizen
sub-group and 88 males and 54 females in Chinese sub-group;
whereas in Singapore, there were 206 males and 109 females in
overall sub-group, 138 males and 57 females in citizen sub-group,
and 104 males and 47 females in Chinese sub-group. For Indonesian
population, the percentage of Chinese within the citizen sub-group
was 37.67%. This was also the same percentage of Chinese within
the whole group since there were only 2 sub-groups for Indonesian
subjects, i.e. citizen and Chinese. But for Singaporean population,
the percentages of Chinese within the citizen sub-group and the
whole group were 77.44% and 47.94% respectively. Most have taken
a course in ergonomics/human factors engineering. Each received
a token of appreciation for their time. It is assumed that university
students are representative of a population
’
s anthropometry.
The taking of anthropometric data is a sensitive issue to some
people who may refuse to be measured. Due to this, we used
convenience sampling as opposed to random sampling.
Conve-nience sampling selects subjects arbitrarily and in an unstructured
manner from the sample frame (
Lohr, 1999
).
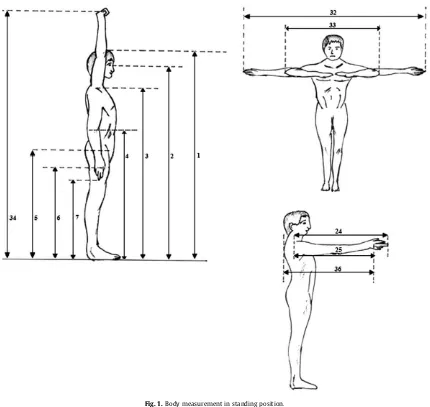
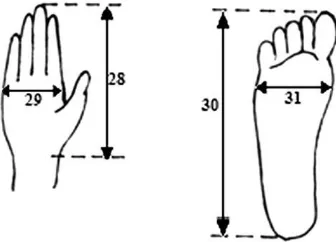
2.2. Body dimensions
All measurements were taken in the afternoon. Subjects were
barefooted, wearing t-shirts or shirts, and shorts or pants while the
measurements were taken. For the anthropometric data of
Indo-nesians, the body weight and 35 body dimensions were measured.
For the anthropometry of Singaporeans, the body weight and 36
body dimensions were taken. The landmarks of body dimensions
are shown in
Figs. 1
e
3
. The body dimensions and measurement as
speci
fi
ed by
Pheasant and Haslegrave (2006)
were used.
2.3. Equipment
Traditional anthropometric tools were used rather than a more
sophisticated and high-tech equipment such as a
three-dimen-sional scanner. They are simple, portable, inexpensive, and as
Fig. 2.Body measurement in sitting position.
Fig. 3.Body measurement in standing/sitting position.
reliable and accurate as those obtained by high-tech
anthropo-metric tools (
Al-Ansari and Mokdad, 2009
). For the data collection
in Singapore, three sets of the Rosscraft Anthropometer Centurion
Kit were used. Each set consists of 1 Campbell caliper 20, 1
Campbell caliper 10, 1 segmometer, 1 headboard, and 1
anthropo-metric measuring tape. A weighing scale, meter scales, and small
stools were used also. For the data collection in Indonesia, a similar
portable manual anthropometer, meter scales, a weighing scale,
and small tools were used. All the equipments used were calibrated
against standards/rules.
2.4. Procedure
In managing the data collection in Indonesia, four female and
four male experimenters received prior training to become familiar
with the equipment, body landmarks, and measurement
tech-niques. In addition, some pilot tests were conducted. Inherently, the
experimenters had an experience to be a subject of the same
measurement in the previous anthropometry experiment. At the
start of each data collection session, the subjects were informed of
the purpose of the study, equipment, measurement procedure, and
possible application of the data to be collected. The male
menters measured the male subjects; whereas the female
experi-menters measured the female subjects (see
Fig. 4
).
In Singapore, one female and three male experimenters
collected the data. The same procedure as used in Indonesia was
applied in Singapore. Accuracy and repeatability in taking the
Fig. 4.A female experimenter measures a female subject.
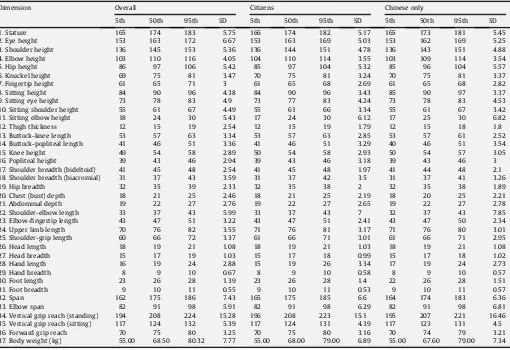
Table 1
Anthropometric data for Singaporean males (all dimensions in cm, body weight in kg).
Dimension Overall Citizens Chinese only
5th 50th 95th SD 5th 50th 95th SD 5th 50th 95th SD
1. Stature 165 174 183 5.75 166 174 182 5.17 165 173 181 5.45
2. Eye height 153 163 172 6.67 153 163 169 5.03 153 162 169 5.25
3. Shoulder height 136 145 153 5.36 136 144 151 4.78 136 143 151 4.88
4. Elbow height 103 110 116 4.05 104 110 114 3.55 103 109 114 3.54
5. Hip height 86 97 106 5.42 85 97 104 5.32 85 96 104 5.57
6. Knuckel height 69 75 81 3.47 70 75 81 3.24 70 75 81 3.37
7. Fingertip height 61 65 71 3 61 65 68 2.69 61 65 68 2.82
8. Sitting height 84 90 96 4.38 84 90 96 3.43 85 90 97 3.37
9. Sitting eye height 73 78 83 4.9 73 77 83 4.24 73 78 83 4.53
10. Sitting shoulder height 55 61 67 4.49 55 61 66 3.34 55 61 67 3.42
11. Sitting elbow height 18 24 30 5.43 17 24 30 6.12 17 25 30 6.82
12. Thigh thickness 12 15 19 2.54 12 15 19 1.79 12 15 18 1.8
13. Buttock-knee length 53 57 63 3.34 53 57 63 2.85 53 57 61 2.52
14. Buttock-popliteal length 41 46 51 3.36 41 46 51 3.29 40 46 51 3.54
15. Knee height 49 54 58 2.89 50 54 58 2.93 50 54 57 3.05
16. Popliteal height 39 43 46 2.94 39 43 46 3.18 39 43 46 3
17. Shoulder breadth (bideltoid) 41 45 48 2.54 41 45 48 1.97 41 44 48 2.1
18. Shoulder breadth (biacromial) 31 37 43 3.59 31 37 42 3.5 31 37 41 3.26
19. Hip breadth 32 35 39 2.33 32 35 38 2 32 35 38 1.89
20. Chest (bust) depth 18 21 25 2.46 18 21 25 2.19 18 20 25 2.21
21. Abdominal depth 19 22 27 2.76 19 22 27 2.65 19 22 27 2.78
22. Shoulder-elbow length 33 37 43 5.99 33 37 43 7 32 37 43 7.85
23. Elbow-fingertip length 43 47 51 3.22 43 47 51 2.41 43 47 50 2.34
24. Upper limb length 70 76 82 3.55 71 76 81 3.17 71 76 80 3.01
25. Shoulder-grip length 60 66 72 3.37 61 66 71 3.01 61 66 71 2.95
26. Head length 18 19 21 1.08 18 19 21 1.03 18 19 21 1.08
27. Head breadth 15 17 19 1.03 15 17 18 0.99 15 17 18 1.02
28. Hand length 16 19 24 2.88 15 19 26 3.34 17 19 24 2.73
29. Hand breadth 8 9 10 0.67 8 9 10 0.58 8 9 10 0.57
30. Foot length 23 26 28 1.39 23 26 28 1.4 22 26 28 1.51
31. Foot breadth 9 10 11 0.55 9 10 11 0.53 9 10 11 0.57
32. Span 162 175 186 7.43 165 175 185 6.6 164 174 183 6.36
33. Elbow span 82 91 98 5.91 82 91 98 6.29 82 91 98 6.81
34. Vertical grip reach (standing) 194 208 224 15.28 196 208 223 15.1 195 207 221 16.46
35. Vertical grip reach (sitting) 117 124 132 5.39 117 124 131 4.39 117 123 131 4.5
36. Forward grip reach 70 75 80 3.25 70 75 80 3.16 70 74 79 3.21
measurements were achieved somewhat with practice prior to
data collection. Initially, it took about 30 min to completely
measure each subject. Very quickly, this plateaued to about
15
e
20 min.
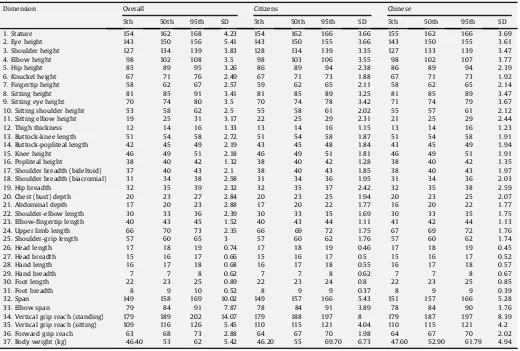
3. Results
3.1. Anthropometric data of the Singaporean and Indonesian
samples
A summary of the anthropometry data collected in Singapore is
shown in
Table 1
(for male) and
Table 2
(for female).
Table 3
presents the same for the Indonesia data. Information on the
sub-groups and average weight are shown.
3.2. Comparison of selected median values for the Singaporean and
Indonesian samples
The Mann
e
Whitney
U
test is used to assess whether the two
independent samples (i.e., anthropometric data of Singaporean and
Indonesian samples) are different. It assumes distribution-free data
which is a reasonable assumption to be made of the anthropometry
data collected in this study.
Table 4
presents a comparison of the 36 dimensions measured,
including weight. In general, both male and female Singaporeans
tend to have larger dimensions than their Indonesians
counter-parts. Statistical analysis shows that up to 50 percent of the
dimensions have signi
fi
cant differences in median values. For the
sub-group of citizens, 23 out of 36 for male and 21 out of 36 for
female, were signi
fi
cantly different. For the sub-group of Chinese,
10 out of 36 for male and 15 out of 36 for female, were signi
fi
cantly
different.
Comparing Singaporean to Indonesian male and female in the
citizen sub-group and ethnic Chinese sub-group, there were
signi
fi
cant differences in the dimensions of, stature, eye height,
elbow height,
fi
ngertip height, head length, and elbow span.
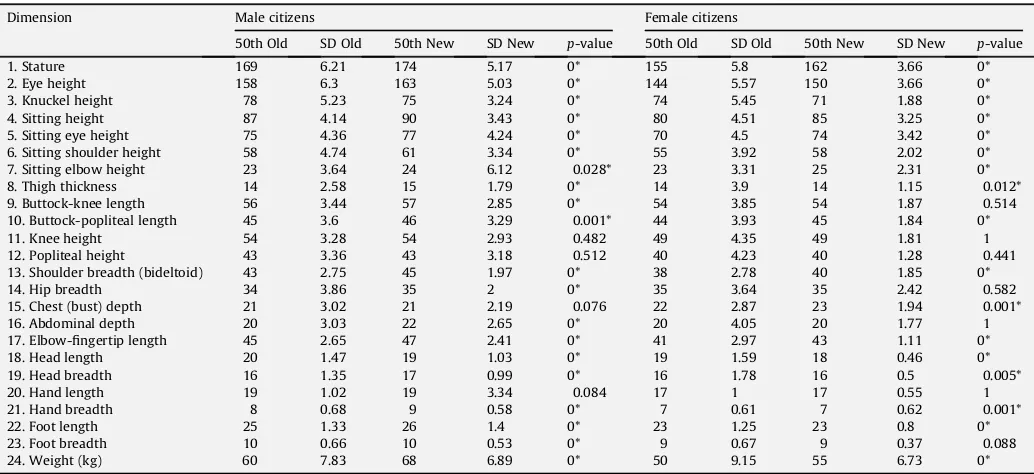
3.3. Comparison of current and past anthropometric data of
Singaporeans
The current Singaporean anthropometric data were compared
with older similar data obtained in 1990. From the current data,
only information from the citizen sub-group was used. The past
data are from
Lim et al. (1990)
. The sample size included in the
study by
Lim et al. (1990)
was 587 male and 464 female
Singa-porean workers. The ages of the samples ranged from 18 to 45
years. The two data sets do not correspond completely.
Twenty-four body dimensions were selected for comparison. Using the
Student
’
s
t
-test for independent mean difference, the result
showed that more than 50 percent of the dimensions were
signi
fi
cantly different, including weight, stature, eye height,
knuckle height, sitting height, sitting eye height, sitting shoulder
height, and others (see
Table 5
).
Table 2
Anthropometric data for Singaporean females (all dimensions in cm, body weight in kg).
Dimension Overall Citizens Chinese
5th 50th 95th SD 5th 50th 95th SD 5th 50th 95th SD
1. Stature 154 162 168 4.23 154 162 166 3.66 155 162 166 3.69
2. Eye height 143 150 156 5.41 143 150 155 3.66 143 150 155 3.61
3. Shoulder height 127 134 139 3.83 128 134 139 3.35 127 133 139 3.47
4. Elbow height 98 102 108 3.5 98 103 106 3.55 98 102 107 3.77
5. Hip height 85 89 95 3.26 86 89 94 2.38 86 89 94 2.39
6. Knuckel height 67 71 76 2.49 67 71 73 1.88 67 71 73 1.92
7. Fingertip height 58 62 67 2.57 59 62 65 2.11 58 62 65 2.14
8. Sitting height 81 85 91 3.41 81 85 89 3.25 81 85 89 3.47
9. Sitting eye height 70 74 80 3.5 70 74 78 3.42 71 74 79 3.67
10. Sitting shoulder height 53 58 62 2.5 55 58 61 2.02 55 57 61 2.12
11. Sitting elbow height 19 25 31 3.17 22 25 29 2.31 21 25 29 2.44
12. Thigh thickness 12 14 16 1.33 13 14 16 1.15 13 14 16 1.23
13. Buttock-knee length 51 54 58 2.72 51 54 58 1.87 51 54 58 1.91
14. Buttock-popliteal length 42 45 49 2.19 43 45 48 1.84 43 45 49 1.94
15. Knee height 46 49 51 2.18 46 49 51 1.81 46 49 51 1.91
16. Popliteal height 38 40 42 1.32 38 40 42 1.28 38 40 42 1.35
17. Shoulder breadth (bideltoid) 37 40 43 2.1 38 40 43 1.85 38 40 43 1.97
18. Shoulder breadth (biacromial) 31 34 38 2.58 31 34 36 1.95 31 34 36 2.03
19. Hip breadth 32 35 39 2.32 32 35 37 2.42 32 35 38 2.59
20. Chest (bust) depth 20 23 27 2.84 20 23 25 1.94 20 23 25 2.07
21. Abdominal depth 17 20 23 2.88 17 20 22 1.77 16 20 22 1.77
22. Shoulder-elbow length 30 33 36 2.39 30 33 35 1.69 30 33 35 1.75
23. Elbow-fingertip length 40 43 45 1.52 40 43 44 1.11 41 42 44 1.13
24. Upper limb length 66 70 73 2.35 66 69 72 1.75 67 69 72 1.76
25. Shoulder-grip length 57 60 65 3 57 60 62 1.76 57 60 62 1.74
26. Head length 17 18 19 0.74 17 18 19 0.46 17 18 19 0.45
27. Head breadth 15 16 17 0.66 15 16 17 0.5 15 16 17 0.52
28. Hand length 16 17 18 0.68 16 17 18 0.55 16 17 18 0.57
29. Hand breadth 7 7 8 0.62 7 7 8 0.62 7 7 8 0.67
30. Foot length 22 23 25 0.89 22 23 24 0.8 22 23 25 0.85
31. Foot breadth 8 9 10 0.52 8 9 9 0.37 8 9 9 0.39
32. Span 149 158 169 10.02 149 157 166 5.43 151 157 166 5.28
33. Elbow span 79 84 91 7.87 78 84 91 3.89 78 84 90 3.76
34. Vertical grip reach (standing) 179 189 202 14.07 179 188 197 8 179 187 197 8.39
35. Vertical grip reach (sitting) 109 116 126 5.45 110 115 121 4.04 110 115 121 4.2
36. Forward grip reach 63 68 73 2.88 64 67 70 1.98 64 67 70 2.02
37. Body weight (kg) 46.40 53 62 5.42 46.20 55 69.70 6.73 47.60 52.90 61.79 4.94
3.4. Body Mass Index (BMI) as a utilization of anthropometric data
BMI is a comparison of a person
’
s weight against stature. It is
de
fi
ned as weight in kg divided by the square of stature in m (kg/
m
2). Essentially, BMI can be a health indicator. The BMI values for all
sub-groups in this research are shown in
Table 6
. All values are
within the normal range of 18.5
e
25.0, as speci
fi
ed by
WHO (2008)
.
The presented BMI in this study is only valid to explain the health
condition of the Singaporean and Indonesian populations in their
productive age since the samples were taken from people in the age
range of 18
e
45 years.
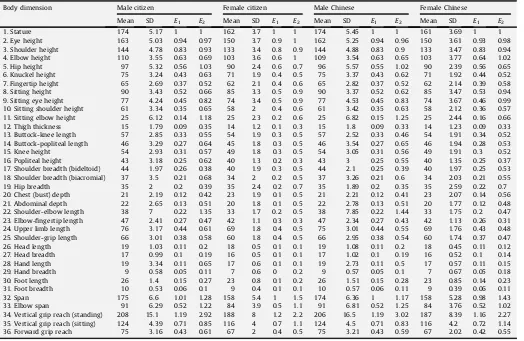
3.5. Empirical estimation of unknown anthropometric
characteristics using the Ratio Scaling Method
Pheasant and Haslegrave (2006)
proposed that if given that two
populations A and B which are similar in terms of age range, gender,
and ethnicity, and if the parameters of variables
x
and
y
are known
in population A (i.e., the reference population), but only the
parameters of
x
are known in population B (i.e., the target
pop-ulation), then:
m
y=
m
xðinreferencepopulationA
Þ
z
m
y=
m
xðintargetpopulationB
Þ
(1)
s
y=
s
xð
in reference population A
Þ
z
s
y=
s
xð
in target population B
Þ
(2)
The variable
x
, which is known in both populations, is called as the
“
scaling dimension.
”
Stature or body height is commonly chosen as
the scaling dimension and will be used here. Pheasant and
Hasle-grave proposed the simplest technique of coef
fi
cients calculation as
follows:
E
1¼ ð
mean of required dimension
Þ
=
ð
mean stature
Þ
(3)
E
2¼ ð
standard deviation of required dimension
Þ
=
ð
standard deviation of stature
Þ
(4)
The
E
1and
E
2coef
fi
cients calculated from the Singaporean and
Indonesian anthropometric data for two groups (i.e., citizen
sub-group, ethnic Chinese sub-group) are presented in
Tables 7 and 8
.
The objective of this exercise is to show that it is possible to
estimate various anthropometric dimensions of a sample (e.g.,
mean, SD, percentiles) based only on the dimension of stature.
However as mentioned, one requirement is that the ethnicity, age,
and gender group must be the same. In further method
develop-ment,
Wang and Chao (2010)
have developed an improvement of
this Ratio Scaling Method. They called it the Constant Body Ratio
benchmarks (CBR benchmarks) which is least affected by age and
gender factors.
Pheasant (1982)
argued that when properly
quali-fi
ed in use, the error estimate of this technique can be considered
acceptable.
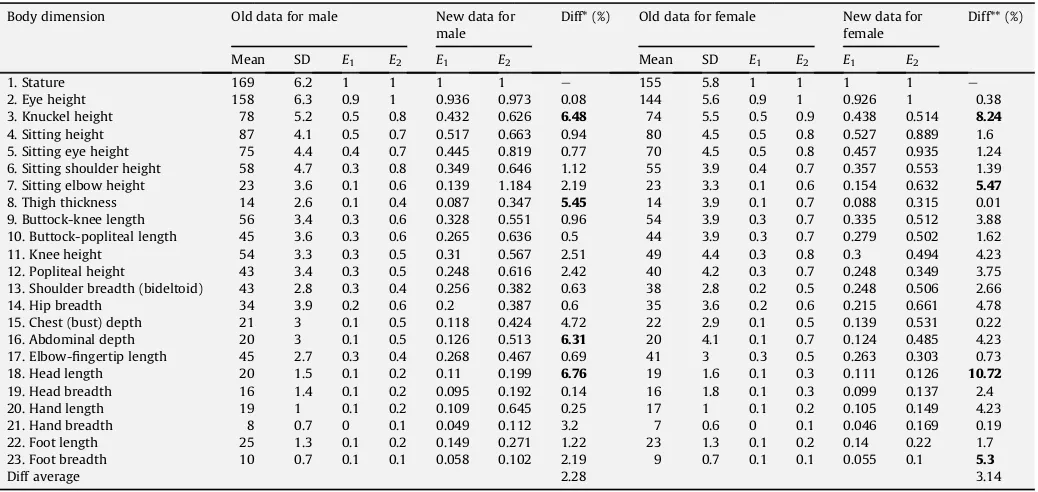
A comparison of the
E
1coef
fi
cient between the current and
previous studies of Singaporean citizen anthropometry is
pre-sented (see
Table 9
). The ratio
E
1difference (shown in
“
%diff
”
)
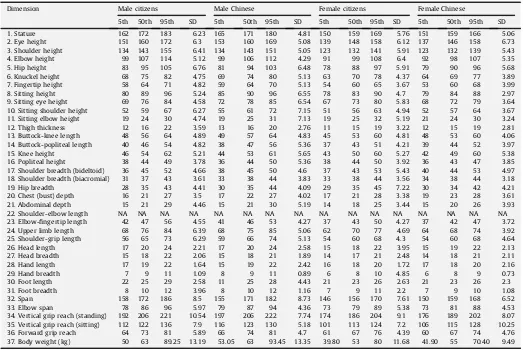
Table 3Anthropometric data for Indonesian males and females (all dimensions in cm, body weight in kg).
Dimension Male citizens Male Chinese Female citizens Female Chinese
5th 50th 95th SD 5th 50th 95th SD 5th 50th 95th SD 5th 50th 95th SD
1. Stature 162 172 183 6.23 165 171 180 4.81 150 159 169 5.76 151 159 166 5.06
2. Eye height 151 160 172 6.3 153 160 169 5.08 139 148 158 6.12 137 146 158 6.73
3. Shoulder height 134 143 155 6.41 134 143 151 5.05 123 132 141 5.91 123 132 139 5.43
4. Elbow height 99 107 114 5.12 99 106 112 4.29 91 99 108 6.4 92 98 107 5.35
5. Hip height 83 95 105 6.76 81 94 103 6.48 78 88 97 5.91 79 90 96 5.68
6. Knuckel height 68 75 82 4.75 69 74 80 5.13 63 70 78 4.37 64 69 77 3.89
7. Fingertip height 58 64 71 4.82 59 64 70 5.13 54 60 65 3.67 53 60 68 3.99
8. Sitting height 80 89 96 5.24 85 90 96 6.55 78 83 90 4.7 79 84 88 2.97
9. Sitting eye height 69 76 84 4.58 72 78 85 6.54 67 73 80 5.83 68 72 79 3.64
10. Sitting shoulder height 52 59 67 6.27 55 61 72 7.15 51 56 63 4.94 52 57 64 3.67
11. Sitting elbow height 19 24 30 4.74 19 25 31 7.13 19 25 32 5.19 21 24 30 3.24
12. Thigh thickness 12 16 22 3.59 13 16 20 2.76 11 15 19 3.22 12 15 19 2.81
13. Buttock-knee length 48 56 64 4.89 49 57 64 4.83 45 53 60 4.81 48 53 60 4.06
14. Buttock-popliteal length 40 46 54 4.82 38 47 56 5.36 37 43 51 4.21 39 44 52 3.97
15. Knee height 46 54 62 5.21 44 53 61 5.65 43 50 60 5.27 42 49 60 5.38
16. Popliteal height 38 44 49 3.78 36 44 50 5.36 38 44 50 3.92 36 43 47 3.85
17. Shoulder breadth (bideltoid) 36 45 52 4.66 38 45 50 4.6 37 43 53 5.43 40 44 53 4.97 18. Shoulder breadth (biacromial) 31 37 43 3.61 33 38 44 3.83 33 38 44 3.56 34 38 44 3.18
19. Hip breadth 28 35 43 4.41 30 35 44 4.09 29 35 45 7.22 30 34 42 4.21
20. Chest (bust) depth 16 21 27 3.5 17 22 27 4.02 17 21 28 3.38 19 23 28 3.61
21. Abdominal depth 15 21 29 4.46 15 21 30 5.19 14 18 25 3.44 15 20 26 3.93
22. Shoulder-elbow length NA NA NA NA NA NA NA NA NA NA NA NA NA NA NA NA
23. Elbow-fingertip length 42 47 56 4.55 41 46 53 4.27 37 43 50 4.27 37 42 47 3.72
24. Upper limb length 68 76 84 6.39 68 75 85 5.06 62 70 77 4.69 64 68 74 3.92
25. Shoulder-grip length 56 65 73 6.29 59 66 74 5.13 54 60 68 4.3 54 60 68 4.64
26. Head length 17 20 24 2.21 17 20 24 2.58 15 18 22 3.95 15 19 22 2.13
27. Head breadth 15 18 22 2.06 15 18 21 1.89 14 17 21 2.48 14 18 21 2.11
28. Hand length 17 19 22 1.64 15 19 22 2.42 16 18 20 1.72 17 18 20 2.16
29. Hand breadth 7 9 11 1.09 8 9 11 0.89 6 8 10 4.85 6 8 9 0.73
30. Foot length 22 25 29 2.58 11 25 28 4.43 21 23 26 2.63 21 23 26 2.3
31. Foot breadth 8 10 12 3.96 8 10 12 1.16 7 9 11 2.2 7 9 10 1.08
32. Span 158 172 186 8.5 155 171 182 8.73 146 156 170 7.61 150 159 168 6.52
33. Elbow span 78 86 96 5.97 79 87 94 4.36 73 79 89 5.38 73 81 88 4.53
34. Vertical grip reach (standing) 192 206 221 10.54 197 206 222 7.74 174 186 204 9.1 176 189 202 8.07 35. Vertical grip reach (sitting) 112 122 136 7.9 116 123 130 5.18 101 113 124 7.2 106 115 128 10.25
36. Forward grip reach 64 73 81 5.89 66 74 81 4.7 61 67 76 4.39 60 67 74 4.76
Table 4
Comparison of median values for Singaporean and Indonesian samples (all dimensions in cm, body weight in kg).
Dimension Male citizens Male Chinese Female citizens Female Chinese
A B p-value A B p-value A B p-value A B p-value
1. Stature 172 174 0.0005* 171 173 0.0089* 159 162 0.0026* 159 162 0.0051*
2. Eye height 160 163 0* 160 162 0.0013* 148 150 0.0082* 146 150 0.0056*
3. Shoulder height 143 144 0.0371* 143 143 0.2343 132 134 0.0156* 132 133 0.0481*
4. Elbow height 107 110 0* 106 109 0* 99 103 0* 98 102 0.0005*
5. Hip height 95 97 0.0015* 94 96 0.0571 88 89 0.0016* 90 89 0.3176
6. Knuckel height 75 75 0.5019 74 75 0.1891 70 71 0.1613 69 71 0.0879
7. Fingertip height 64 65 0.0243* 64 65 0.019* 60 62 0* 60 62 0.0005*
8. Sitting height 89 90 0.0002* 90 90 0.3991 83 85 0.0003* 84 85 0.0198*
9. Sitting eye height 76 77 0* 78 78 0.3829 73 74 0.0017* 72 74 0.0125*
10. Sitting shoulder height 59 61 0* 62 61 0.6355 56 58 0.0052* 57 57 0.3485
11. Sitting elbow height 24 24 0.9111 25 25 0.7932 25 25 0.2003 24 25 0.0868
12. Thigh thickness 16 15 0.0007* 16 15 0.0075* 15 14 0.2182 15 14 0.6055
13. Buttock-knee length 56 57 0.0272* 57 57 0.87 53 54 0.001* 53 54 0.1889
14. Buttock-popliteal length 46 46 0.4569 47 46 0.1332 43 45 0* 44 45 0.0404*
15. Knee height 54 54 0.2232 53 54 0.1741 50 49 0.002* 49 49 0.1475
16. Popliteal height 44 43 0.0127* 44 43 0.0296* 44 40 0* 43 40 0.0002*
17. Shoulder breadth (bideltoid) 45 45 0.933 45 44 0.9665 43 40 0* 44 40 0*
18. Shoulder breadth (biacromial) 37 37 0.7922 38 37 0.0496* 38 34 0* 38 34 0*
19. Hip breadth 35 35 0.1687 35 35 0.1774 35 35 0.3078 34 35 0.9284
20. Chest (bust) depth 21 21 0.254 22 21 0.1353 21 23 0.0019* 23 23 0.9687
21. Abdominal depth 21 22 0* 21 22 0.4464 18 20 0.0005* 20 20 0.9821
22. Shoulder-elbow length NA NA NA NA NA NA NA NA NA NA NA NA
23. Elbow-fingertip length 47 47 0.6452 46 47 0.6657 43 43 0.7043 42 42 0.6493
24. Upper limb length 76 76 0.7576 75 76 0.9131 70 69 0.476 68 69 0.6902
25. Shoulder-grip length 65 66 0.08 66 66 0.5971 60 60 0.8928 60 60 0.9731
26. Head length 20 19 0.0221* 20 19 0.2596 18 18 0.1938 19 18 0.5251
27. Head breadth 18 17 0* 18 17 0* 17 16 0.0003* 18 16 0.0004*
28. Hand length 19 19 0.9333 19 19 0.4641 18 17 0.0014* 18 17 0*
29. Hand breadth 9 9 0.1064 9 9 0.2885 8 7 0.0522 8 7 0.462
30. Foot length 25 26 0.0013* 25 26 0.0023* 23 23 0.0842 23 23 0.0588
31. Foot breadth 10 10 0.0097* 10 10 0.1544 9 9 0.1574 9 9 0.0234*
32. Span 172 175 0.0009* 171 174 0.0726 156 157 0.4114 159 157 0.5898
33. Elbow span 86 91 0* 87 91 0.0002* 79 84 0* 81 84 0.0079*
34. Vertical grip reach (standing) 206 208 0.0058* 205 207 0.2913 186 188 0.3456 189 187 0.9373 35. Vertical grip reach (sitting) 122 124 0.0042* 122 123 0.2159 113 115 0.0024* 115 115 0.4967
36. Forward grip reach 73 75 0.0001* 74 75 0.312 67 67 0.44 67 67 0.6778
37. Body weight (kg) 63 68 0.0001* 63 67.6 0.0618 53 55 0.2398 55 52.9 0.7873
*Significant atp<0.05; A¼Indonesian; B¼Singaporean.
Table 5
Comparison of 50th percentile values for previous (old) and current studies (new) of Singaporeans (all dimensions in cm, body weight in kg).
Dimension Male citizens Female citizens
50th Old SD Old 50th New SD New p-value 50th Old SD Old 50th New SD New p-value
1. Stature 169 6.21 174 5.17 0* 155 5.8 162 3.66 0*
2. Eye height 158 6.3 163 5.03 0* 144 5.57 150 3.66 0*
3. Knuckel height 78 5.23 75 3.24 0* 74 5.45 71 1.88 0*
4. Sitting height 87 4.14 90 3.43 0* 80 4.51 85 3.25 0*
5. Sitting eye height 75 4.36 77 4.24 0* 70 4.5 74 3.42 0*
6. Sitting shoulder height 58 4.74 61 3.34 0* 55 3.92 58 2.02 0*
7. Sitting elbow height 23 3.64 24 6.12 0.028* 23 3.31 25 2.31 0*
8. Thigh thickness 14 2.58 15 1.79 0* 14 3.9 14 1.15 0.012*
9. Buttock-knee length 56 3.44 57 2.85 0* 54 3.85 54 1.87 0.514
10. Buttock-popliteal length 45 3.6 46 3.29 0.001* 44 3.93 45 1.84 0*
11. Knee height 54 3.28 54 2.93 0.482 49 4.35 49 1.81 1
12. Popliteal height 43 3.36 43 3.18 0.512 40 4.23 40 1.28 0.441
13. Shoulder breadth (bideltoid) 43 2.75 45 1.97 0* 38 2.78 40 1.85 0*
14. Hip breadth 34 3.86 35 2 0* 35 3.64 35 2.42 0.582
15. Chest (bust) depth 21 3.02 21 2.19 0.076 22 2.87 23 1.94 0.001*
16. Abdominal depth 20 3.03 22 2.65 0* 20 4.05 20 1.77 1
17. Elbow-fingertip length 45 2.65 47 2.41 0* 41 2.97 43 1.11 0*
18. Head length 20 1.47 19 1.03 0* 19 1.59 18 0.46 0*
19. Head breadth 16 1.35 17 0.99 0* 16 1.78 16 0.5 0.005*
20. Hand length 19 1.02 19 3.34 0.084 17 1 17 0.55 1
21. Hand breadth 8 0.68 9 0.58 0* 7 0.61 7 0.62 0.001*
22. Foot length 25 1.33 26 1.4 0* 23 1.25 23 0.8 0*
23. Foot breadth 10 0.66 10 0.53 0* 9 0.67 9 0.37 0.088
24. Weight (kg) 60 7.83 68 6.89 0* 50 9.15 55 6.73 0*
*Significant atp<0.05.
indicates that the errors are relatively small in all body dimensions
except for knuckle height and head length. The average difference is
2.28 percent for males and 3.14 percent for females.
4. Discussion and conclusion
Anthropometric data from Singaporean and Indonesian adults
were collected and summarized. Based on statistical analysis and
depending on the sub-group sample, up to half of the dimensions
were signi
fi
cantly different. The Singaporean sample was relatively
taller than the Indonesian sample for both male and female.
Sin-gaporeans were also signi
fi
cantly larger than Indonesians in several
body dimensions including eye height, elbow height,
fi
ngertip
height, and elbow span. However, Singaporean adults appear to
have a relatively smaller head length than Indonesian adults.
The above indicates that geographical origin does have an effect
on variation of anthropometry. This con
fi
rms with reports by other
researchers. For example,
Sirajuddin et al. (1994)
found that
geographic factors have an overwhelming effect on the genetic
differentiation of ethnic groups in the southern part of Indian.
_
Is¸eri
and Arslan (2009)
found geographical region to have a signi
fi
cant
effect on stature and weight of the Turkish population. Another
variable is the various ethnic sub-groups.
Singapore is a highly diverse and cosmopolitan country with the
Chinese people forming the largest ethnic majority. Other
sub-groups include Malays, Indians, Eurasians, and Arabs. It is
inter-esting to note that in Indonesia alone, there are over 300 distinct
native ethnicities. On the issue of ethnicity affecting
anthropom-etry, it is not a question of whether it does, but how much it does.
Better nutrition and higher social status may be an explanation
for differences found between the two samples. Compared to
Indonesia, Singapore has a higher status since its GDP (nominal)
per capita (i.e., USD38,972) was ranked 22nd, whereas Indonesia
(i.e., USD2239) was ranked 116th in year 2008 (
International
Monetary Fund, 2008
). Higher socioeconomic status implies
higher income and is associated with better education, resulting in
better nutrition, better child care, and better medical and social
services.
_
Is¸eri and Arslan (2009)
argue that over time, this leads to
an increase in overall stature. Malnutrition which is prevalent in
underdeveloped countries plays a major role in inhibiting the
human growth process including height and weight (
Wall, 1993
).
As empirical proof, in Europe during the last 100 years, people have
become taller, the onset of puberty has commenced at a younger
Table 6
Body Mass Index of Singaporean and Indonesian samples.
Subject Body Mass Index (BMI)
in kg/m2
Male Female
Singaporean Overall 22.58 20.65
Citizens 22.62 21.43
Chinese 22.5 20.71
Citizen (for old data) 21.01 20.81
Indonesian Citizens 22.21 21.76
Chinese 22.7 21.89
Table 7
E1andE2coefficients calculated from Singaporean anthropometric data as reference populations.
Body dimension Male citizen Female citizen Male Chinese Female Chinese
Mean SD E1 E2 Mean SD E1 E2 Mean SD E1 E2 Mean SD E1 E2
1. Stature 174 5.17 1 1 162 3.7 1 1 174 5.45 1 1 161 3.69 1 1
2. Eye height 163 5.03 0.94 0.97 150 3.7 0.9 1 162 5.25 0.94 0.96 150 3.61 0.93 0.98
3. Shoulder height 144 4.78 0.83 0.93 133 3.4 0.8 0.9 144 4.88 0.83 0.9 133 3.47 0.83 0.94 4. Elbow height 110 3.55 0.63 0.69 103 3.6 0.6 1 109 3.54 0.63 0.65 103 3.77 0.64 1.02
5. Hip height 97 5.32 0.56 1.03 90 2.4 0.6 0.7 96 5.57 0.55 1.02 90 2.39 0.56 0.65
6. Knuckel height 75 3.24 0.43 0.63 71 1.9 0.4 0.5 75 3.37 0.43 0.62 71 1.92 0.44 0.52 7. Fingertip height 65 2.69 0.37 0.52 62 2.1 0.4 0.6 65 2.82 0.37 0.52 62 2.14 0.39 0.58 8. Sitting height 90 3.43 0.52 0.66 85 3.3 0.5 0.9 90 3.37 0.52 0.62 85 3.47 0.53 0.94 9. Sitting eye height 77 4.24 0.45 0.82 74 3.4 0.5 0.9 77 4.53 0.45 0.83 74 3.67 0.46 0.99 10. Sitting shoulder height 61 3.34 0.35 0.65 58 2 0.4 0.6 61 3.42 0.35 0.63 58 2.12 0.36 0.57 11. Sitting elbow height 25 6.12 0.14 1.18 25 2.3 0.2 0.6 25 6.82 0.15 1.25 25 2.44 0.16 0.66 12. Thigh thickness 15 1.79 0.09 0.35 14 1.2 0.1 0.3 15 1.8 0.09 0.33 14 1.23 0.09 0.33 13. Buttock-knee length 57 2.85 0.33 0.55 54 1.9 0.3 0.5 57 2.52 0.33 0.46 54 1.91 0.34 0.52 14. Buttock-popliteal length 46 3.29 0.27 0.64 45 1.8 0.3 0.5 46 3.54 0.27 0.65 46 1.94 0.28 0.53
15. Knee height 54 2.93 0.31 0.57 49 1.8 0.3 0.5 54 3.05 0.31 0.56 49 1.91 0.3 0.52
16. Popliteal height 43 3.18 0.25 0.62 40 1.3 0.2 0.3 43 3 0.25 0.55 40 1.35 0.25 0.37 17. Shoulder breadth (bideltoid) 44 1.97 0.26 0.38 40 1.9 0.3 0.5 44 2.1 0.25 0.39 40 1.97 0.25 0.53 18. Shoulder breadth (biacromial) 37 3.5 0.21 0.68 34 2 0.2 0.5 37 3.26 0.21 0.6 34 2.03 0.21 0.55
19. Hip breadth 35 2 0.2 0.39 35 2.4 0.2 0.7 35 1.89 0.2 0.35 35 2.59 0.22 0.7
20. Chest (bust) depth 21 2.19 0.12 0.42 23 1.9 0.1 0.5 21 2.21 0.12 0.41 23 2.07 0.14 0.56 21. Abdominal depth 22 2.65 0.13 0.51 20 1.8 0.1 0.5 22 2.78 0.13 0.51 20 1.77 0.12 0.48 22. Shoulder-elbow length 38 7 0.22 1.35 33 1.7 0.2 0.5 38 7.85 0.22 1.44 33 1.75 0.2 0.47 23. Elbow-fingertip length 47 2.41 0.27 0.47 42 1.1 0.3 0.3 47 2.34 0.27 0.43 42 1.13 0.26 0.31 24. Upper limb length 76 3.17 0.44 0.61 69 1.8 0.4 0.5 75 3.01 0.44 0.55 69 1.76 0.43 0.48 25. Shoulder-grip length 66 3.01 0.38 0.58 60 1.8 0.4 0.5 66 2.95 0.38 0.54 60 1.74 0.37 0.47
26. Head length 19 1.03 0.11 0.2 18 0.5 0.1 0.1 19 1.08 0.11 0.2 18 0.45 0.11 0.12
27. Head breadth 17 0.99 0.1 0.19 16 0.5 0.1 0.1 17 1.02 0.1 0.19 16 0.52 0.1 0.14
28. Hand length 19 3.34 0.11 0.65 17 0.6 0.1 0.1 19 2.73 0.11 0.5 17 0.57 0.11 0.15
29. Hand breadth 9 0.58 0.05 0.11 7 0.6 0 0.2 9 0.57 0.05 0.1 7 0.67 0.05 0.18
30. Foot length 26 1.4 0.15 0.27 23 0.8 0.1 0.2 26 1.51 0.15 0.28 23 0.85 0.14 0.23
31. Foot breadth 10 0.53 0.06 0.1 9 0.4 0.1 0.1 10 0.57 0.06 0.11 9 0.39 0.06 0.11
32. Span 175 6.6 1.01 1.28 158 5.4 1 1.5 174 6.36 1 1.17 158 5.28 0.98 1.43
33. Elbow span 91 6.29 0.52 1.22 84 3.9 0.5 1.1 91 6.81 0.52 1.25 84 3.76 0.52 1.02
Table 8
E1andE2coefficients calculated from Indonesian anthropometric data as reference populations.
Body dimension Male citizen Female citizen Male Chinese Female Chinese
Mean SD E1 E2 Mean SD E1 E2 Mean SD E1 E2 Mean SD E1 E2
1. Stature 172 6.23 1 1 159 5.8 1 1 171 4.81 1 1 159 5.06 1 1
2. Eye height 160 6.3 0.93 1.01 148 6.1 0.9 1.1 160 5.08 0.93 1.06 147 6.73 0.93 1.33
3. Shoulder height 143 6.41 0.83 1.03 132 5.9 0.8 1 143 5.05 0.83 1.05 132 5.43 0.83 1.08 4. Elbow height 107 5.12 0.62 0.82 100 6.4 0.6 1.1 106 4.29 0.62 0.89 99 5.35 0.62 1.06
5. Hip height 95 6.76 0.55 1.08 87 5.9 0.5 1 94 6.48 0.55 1.35 88 5.68 0.56 1.12
6. Knuckel height 75 4.75 0.44 0.76 70 4.4 0.4 0.8 74 5.13 0.43 1.07 70 3.89 0.44 0.77 7. Fingertip height 64 4.82 0.37 0.77 60 3.7 0.4 0.6 64 5.13 0.37 1.07 60 3.99 0.38 0.79 8. Sitting height 88 5.24 0.51 0.84 83 4.7 0.5 0.8 91 6.55 0.53 1.36 84 2.97 0.53 0.59 9. Sitting eye height 76 4.58 0.44 0.74 73 5.8 0.5 1 79 6.54 0.46 1.36 73 3.64 0.46 0.72 10. Sitting shoulder height 59 6.27 0.35 1.01 57 4.9 0.4 0.9 62 7.15 0.37 1.49 57 3.67 0.36 0.73 11. Sitting elbow height 25 4.74 0.14 0.76 25 5.2 0.2 0.9 26 7.13 0.15 1.48 24 3.24 0.15 0.64
12. Thigh thickness 16 3.59 0.1 0.58 15 3.2 0.1 0.6 17 2.76 0.1 0.57 15 2.81 0.1 0.56
13. Buttock-knee length 56 4.89 0.33 0.78 53 4.8 0.3 0.8 57 4.83 0.33 1 54 4.06 0.34 0.8 14. Buttock-popliteal length 46 4.82 0.27 0.77 43 4.2 0.3 0.7 47 5.36 0.28 1.11 45 3.97 0.28 0.79
15. Knee height 54 5.21 0.31 0.84 51 5.3 0.3 0.9 53 5.65 0.31 1.17 50 5.38 0.32 1.06
16. Popliteal height 44 3.78 0.26 0.61 44 3.9 0.3 0.7 44 5.36 0.26 1.11 43 3.85 0.27 0.76 17. Shoulder breadth (bideltoid) 45 4.66 0.26 0.75 45 5.4 0.3 0.9 44 4.6 0.26 0.96 45 4.97 0.28 0.98 18. Shoulder breadth (biacromial) 37 3.61 0.21 0.58 38 3.6 0.2 0.6 38 3.83 0.22 0.8 39 3.18 0.24 0.63
19. Hip breadth 36 4.41 0.21 0.71 36 7.2 0.2 1.3 36 4.09 0.21 0.85 36 4.21 0.22 0.83
20. Chest (bust) depth 21 3.5 0.12 0.56 21 3.4 0.1 0.6 22 4.02 0.13 0.84 23 3.61 0.14 0.71 21. Abdominal depth 21 4.46 0.12 0.72 19 3.4 0.1 0.6 22 5.19 0.13 1.08 20 3.93 0.13 0.78
22. Shoulder-elbow length NA NA NA NA NA NA NA NA NA NA NA NA NA NA NA NA
23. Elbow-fingertip length 48 4.55 0.28 0.73 43 4.3 0.3 0.7 47 4.27 0.27 0.89 42 3.72 0.26 0.74 24. Upper limb length 75 6.39 0.44 1.03 70 4.7 0.4 0.8 76 5.06 0.44 1.05 69 3.92 0.44 0.77 25. Shoulder-grip length 65 6.29 0.38 1.01 60 4.3 0.4 0.7 66 5.13 0.38 1.07 60 4.64 0.38 0.92
26. Head length 20 2.21 0.12 0.35 19 4 0.1 0.7 20 2.58 0.12 0.54 18 2.13 0.11 0.42
27. Head breadth 19 2.06 0.11 0.33 17 2.5 0.1 0.4 18 1.89 0.11 0.39 17 2.11 0.11 0.42
28. Hand length 19 1.64 0.11 0.26 18 1.7 0.1 0.3 19 2.42 0.11 0.5 18 2.16 0.11 0.43
29. Hand breadth 9 1.09 0.05 0.18 8 4.9 0.1 0.8 9 0.89 0.05 0.19 7 0.73 0.05 0.15
30. Foot length 25 2.58 0.15 0.41 23 2.6 0.1 0.5 24 4.43 0.14 0.92 23 2.3 0.15 0.46
31. Foot breadth 10 3.96 0.06 0.64 9 2.2 0.1 0.4 10 1.16 0.06 0.24 8 1.08 0.05 0.21
32. Span 172 8.5 1 1.36 157 7.6 1 1.3 172 8.73 1 1.81 158 6.52 1 1.29
33. Elbow span 87 5.97 0.5 0.96 79 5.4 0.5 0.9 87 4.36 0.51 0.91 81 4.53 0.51 0.9
34. Vertical grip reach (standing) 206 10.5 1.2 1.69 187 9.1 1.2 1.6 207 7.74 1.21 1.61 188 8.07 1.19 1.6 35. Vertical grip reach (sitting) 123 7.9 0.71 1.27 113 7.2 0.7 1.3 123 5.18 0.72 1.08 116 10.3 0.73 2.03 36. Forward grip reach 73 5.89 0.42 0.94 67 4.4 0.4 0.8 74 4.7 0.43 0.98 67 4.76 0.43 0.94
Table 9
Comparison ofE1andE2coefficients between previous (old) and current (new) studies of Singapore citizen anthropometry.
Body dimension Old data for male New data for male
Diff* (%) Old data for female New data for female
Diff** (%)
Mean SD E1 E2 E1 E2 Mean SD E1 E2 E1 E2
1. Stature 169 6.2 1 1 1 1 e 155 5.8 1 1 1 1 e
2. Eye height 158 6.3 0.9 1 0.936 0.973 0.08 144 5.6 0.9 1 0.926 1 0.38
3. Knuckel height 78 5.2 0.5 0.8 0.432 0.626 6.48 74 5.5 0.5 0.9 0.438 0.514 8.24
4. Sitting height 87 4.1 0.5 0.7 0.517 0.663 0.94 80 4.5 0.5 0.8 0.527 0.889 1.6
5. Sitting eye height 75 4.4 0.4 0.7 0.445 0.819 0.77 70 4.5 0.5 0.8 0.457 0.935 1.24 6. Sitting shoulder height 58 4.7 0.3 0.8 0.349 0.646 1.12 55 3.9 0.4 0.7 0.357 0.553 1.39 7. Sitting elbow height 23 3.6 0.1 0.6 0.139 1.184 2.19 23 3.3 0.1 0.6 0.154 0.632 5.47
8. Thigh thickness 14 2.6 0.1 0.4 0.087 0.347 5.45 14 3.9 0.1 0.7 0.088 0.315 0.01
9. Buttock-knee length 56 3.4 0.3 0.6 0.328 0.551 0.96 54 3.9 0.3 0.7 0.335 0.512 3.88 10. Buttock-popliteal length 45 3.6 0.3 0.6 0.265 0.636 0.5 44 3.9 0.3 0.7 0.279 0.502 1.62
11. Knee height 54 3.3 0.3 0.5 0.31 0.567 2.51 49 4.4 0.3 0.8 0.3 0.494 4.23
12. Popliteal height 43 3.4 0.3 0.5 0.248 0.616 2.42 40 4.2 0.3 0.7 0.248 0.349 3.75 13. Shoulder breadth (bideltoid) 43 2.8 0.3 0.4 0.256 0.382 0.63 38 2.8 0.2 0.5 0.248 0.506 2.66
14. Hip breadth 34 3.9 0.2 0.6 0.2 0.387 0.6 35 3.6 0.2 0.6 0.215 0.661 4.78
15. Chest (bust) depth 21 3 0.1 0.5 0.118 0.424 4.72 22 2.9 0.1 0.5 0.139 0.531 0.22
16. Abdominal depth 20 3 0.1 0.5 0.126 0.513 6.31 20 4.1 0.1 0.7 0.124 0.485 4.23
17. Elbow-fingertip length 45 2.7 0.3 0.4 0.268 0.467 0.69 41 3 0.3 0.5 0.263 0.303 0.73
18. Head length 20 1.5 0.1 0.2 0.11 0.199 6.76 19 1.6 0.1 0.3 0.111 0.126 10.72
19. Head breadth 16 1.4 0.1 0.2 0.095 0.192 0.14 16 1.8 0.1 0.3 0.099 0.137 2.4
20. Hand length 19 1 0.1 0.2 0.109 0.645 0.25 17 1 0.1 0.2 0.105 0.149 4.23
21. Hand breadth 8 0.7 0 0.1 0.049 0.112 3.2 7 0.6 0 0.1 0.046 0.169 0.19
22. Foot length 25 1.3 0.1 0.2 0.149 0.271 1.22 23 1.3 0.1 0.2 0.14 0.22 1.7
23. Foot breadth 10 0.7 0.1 0.1 0.058 0.102 2.19 9 0.7 0.1 0.1 0.055 0.1 5.3
Diff average 2.28 3.14
*E1difference¼{j(E1old E1new)/E1oldj}100% for male; **E1difference¼{j(E1old E1new)/E1oldj}100% for female.
age, and the full-grown state has been reached at an earlier age
(
Wall, 1993
).
In comparing the past and current anthropometric data of
Sin-gaporean adults, it is not surprising to
fi
nd many dimensions
signi
fi
cantly different (refer to
Table 5
). The results indicate that
current Singapore citizens (both male and female) are larger than
those in the 1990s. Some signi
fi
cant dimensions include stature,
eye height, knuckle height, sitting height, and weight. The average
stature has increased by 50 mm for male and 68.5 mm for female in
Singapore over the last 19 years. More than 50 percent of the
dimensions are signi
fi
cantly different (20 out of 24 for male; 17 out
of 24 for female). Again, the factors of nutrition, disease,
socio-economic status, urbanization, physical activity, climate, and
psychosocial deprivation, all contribute to the growth of body
dimensions (
Wall, 1993
).
Based on the results of the BMI calculation, both Singaporeans
and Indonesians for all sub-groups, have healthy body weights.
Compared to the previous study of Singaporean anthropometric
data, the current study indicate that the Singaporean sample (both
male and female) has gained more weight, as evidenced by their
higher BMI and stature.
The comparison of ratio
E
1between the existing and current
Singapore citizen anthropometric data (both male and female)
showed that there is relatively no difference. It is indicated by the
small difference in the averages (i.e., 2.28 percent for males, 3.14
percent for females). Essentially, this
fi
nding may be utilized as
a reference population to compare against another population (e.g.,
compare Singapore Chinese to Malays, Indians, etc). The utilization
of this method was shown by
Is¸eri and Arslan (2009)
_
who
esti-mated Turkish adult anthropometric data. They had to assume that
the body ratios of the Turkish people have not changed for the past
45 years.
In conclusion, the Singaporean sample is signi
fi
cantly different
from the Indonesian sample in various body dimensions. In general,
Singaporeans have larger dimensions than Indonesians. The
current Singaporean sample is also signi
fi
cantly larger than past
Singaporeans. Geographical origin, nutrition, social status, and
ethnic composition of populations are some general factors in
fl
u-encing the distribution of anthropometric characteristics. Hence,
a regular updating of anthropometric data is required. These could
be used as relevant consideration in system design when there is
a need to deal with human anthropometric variability.
Since there are signi
fi
cant increases in certain body dimensions
with time due to changes in dietary habits, nutrition, and
socio-economic status etc as mentioned by
Wall (1993)
, it implies that the
human body dimensions (e.g. stature and body weight) can be
predicted in the near future by proposing a mathematical modeling
(e.g. a linear regression model of certain human body dimension
which taking
‘
time
’
as an independent variable). In addition to that,
it is essential to provide adjustable equipment/facilities in order to
achieve comfort and proper posture. Some examples concerned
with adjustability are: (i) Building a prototype of an adjustable table
and chair for schools (
Jung, 2005
), (ii) An adjustable vice mount
(
Boussena and Davies, 1989
), (iii) Redesigning a hospital meal cart
by incorporating ergonomic principles and data (
Das et al., 2002
).
Besides, in the future, the apparel industry can be considered as
a very dramatic phenomenon due to changes in the size of the
human body dimensions. For example, the current small (S),
medium (M), and large (L) sizes could not be applied as a
bench-mark for mass production in the future; these will certainly evolve.
However, this study is far from complete. The time and resource
constraints were limiting factors. Further research and the
collec-tion of more data are necessary.
References
Al-Ansari, M., Mokdad, M., 2009. Anthropometrics for the design of Bahraini school furniture. International Journal of Industrial Ergonomics 39, 728e735. Barroso, M.P., Arezes, P.M., da Costa, L.G., Miguel, A.S., 2005. Anthropometric study
of Portuguese workers. International Journal of Industrial Ergonomics 35, 401e410.
Boussena, M., Davies, B.T., 1989. An adjustable vice mount. Applied Ergonomics 20 (2), 141e142.
Das, B., Wimpee, J., Das, B., 2002. Ergonomics evaluation and redesign of a hospital meal cart. Applied Ergonomics 33, 309e318.
Dewangan, K.N., Owary, C., Datta, R.K., 2008. Anthropometric data of female farm workers from north eastern India and design of hand tools of the hilly region. Industrial Journal of Industrial Ergonomics 38, 90e100.
Gonen, E., Kalinkara, V., Ozgen, O., 1991. Anthropometry of Turkish women. Tech-nical Note. Applied Ergonomics 6, 409e411.
Huang, C., You, M., 1994. Anthropometry of Taiwanese women. Technical Note. Applied Ergonomics 25, 186e187.
International Monetary Fund, 2008. World Economic Outlook Database [online] Available from: http://imf.org/external/pubs/ft/weo/2009/02/weodata/index. aspx(accessed 19.10.09).
_
Is¸eri, A., Arslan, N., 2009. Estimated anthropometric measurements of Turkish adults and effects of age and geographical regions. International Journal of Industrial Ergonomics 39, 860e865.
Jung, H.S., 2005. A prototype of an adjustable table and an adjustable chair for schools. International Journal of Industrial Ergonomics 35, 955e969. Klamklay, J., Sungkhapong, A., Yodpijit, N., Patterson, P.E., 2008. Anthropometry of
the southern Thai population. International Journal of Industrial Ergonomics 38, 111e118.
Kroemer, K.H.E., Grandjean, E., 1997. Fitting the Task to the Human: A Textbook of Occupational Ergonomics,fifth ed. CRC Press.
Kothiyal, K., Tettey, S., 2000. Anthropometry data of elderly people in Australia. Applied Ergonomics 20, 329e332.
Lim, L.E.N., Ngan, L.M.T., Lam, C.Y., 1990. Anthropometry research at NTI. HFE Seminar, Improving Human Performance and Well-Being.
Lin, Y.C., Wang, M.J.J., Wang, E.M., 2004. The comparisons of anthropometric characteristics among four peoples in East Asia. Applied Ergonomics 35, 173e178.
Lohr, S.L., 1999. Sampling: Design and Analysis. Duxbury.
Mandahawi, N., Imrhan, S., Al-Shobaki, S., Sarder, B., 2008. Hand anthropometry survey for the Jordanian population. International Journal of Industrial Ergo-nomics 38 (11e12), 966e976.
Mououdi, M.A., 1997. Static anthropometric characteristics of Tehran University student 20-30. Technical Note. Applied Ergonomics 28 (2), 149e150. Park, J., Nam, Y., Lee, E., Park, S., 2009. Error detection in three-dimensional surface
anthropometric data. International Journal of Industrial Ergonomics 39 (1), 277e282.
Pheasant, S.T., 1982. A technique for estimating anthropometric data from the parameters of the distribution of stature. Ergonomics 25, 981e992.
Pheasant, S., Haslegrave, C.M., 2006. Body Space: Anthropometry, Ergonomics, and the Design of Work, third ed. Taylor & Francis.
Sirajuddin, S.M., Duggirala, R., Crawford, M.H., 1994. Population structure of the Chenchu and other south Indian tribal groups: relationships between genetic, anthropometric, dermatoglyphic, geographic, and linguistic distances. Human Biology: An International Record of Research 66 (5), 865e884.
Thariq, M.G.M., Munasinghe, H.P., Abeysekara, J.D., 2010. Designing chairs with mounted desktop for university students: ergonomics and comfort. Interna-tional Journal of Industrial Ergonomics 40, 8e18.
Wall, H.A.D., 1993. Environmental factors influencing growth and pubertal devel-opment. Environmental Health Perspectives Supplements 101 (2), 39e44. Wang, E.M., Chao, W.C., 2010. In searching for constant body ratio benchmarks.
International Journal of Industrial Ergonomics 40 (1), 59e67.