Oracle® Fusion Middleware
Performance and Tuning for Oracle WebLogic Server
11
g
Release 1 (10.3.5)
E13814-05
April 2011
Oracle Fusion Middleware Performance and Tuning for Oracle WebLogic Server, 11g Release 1 (10.3.5) E13814-05
Copyright © 2007, 2011, Oracle and/or its affiliates. All rights reserved.
This software and related documentation are provided under a license agreement containing restrictions on use and disclosure and are protected by intellectual property laws. Except as expressly permitted in your license agreement or allowed by law, you may not use, copy, reproduce, translate, broadcast, modify, license, transmit, distribute, exhibit, perform, publish, or display any part, in any form, or by any means. Reverse engineering, disassembly, or decompilation of this software, unless required by law for interoperability, is prohibited.
The information contained herein is subject to change without notice and is not warranted to be error-free. If you find any errors, please report them to us in writing.
If this software or related documentation is delivered to the U.S. Government or anyone licensing it on behalf of the U.S. Government, the following notice is applicable:
U.S. GOVERNMENT RIGHTS Programs, software, databases, and related documentation and technical data delivered to U.S. Government customers are "commercial computer software" or "commercial technical data" pursuant to the applicable Federal Acquisition Regulation and agency-specific supplemental regulations. As such, the use, duplication, disclosure, modification, and adaptation shall be subject to the restrictions and license terms set forth in the applicable Government contract, and, to the extent applicable by the terms of the Government contract, the additional rights set forth in FAR 52.227-19, Commercial Computer Software License (December 2007). Oracle USA, Inc., 500 Oracle Parkway, Redwood City, CA 94065.
This software is developed for general use in a variety of information management applications. It is not developed or intended for use in any inherently dangerous applications, including applications which may create a risk of personal injury. If you use this software in dangerous applications, then you shall be responsible to take all appropriate fail-safe, backup, redundancy, and other measures to ensure the safe use of this software. Oracle Corporation and its affiliates disclaim any liability for any damages caused by use of this software in dangerous applications.
Oracle is a registered trademark of Oracle Corporation and/or its affiliates. Other names may be trademarks of their respective owners.
Contents
Preface
... xiiiDocumentation Accessibility ... xiii Conventions ... xiii
1
Introduction and Roadmap
1.1 Document Scope and Audience... 1-1 1.2 Guide to this Document ... 1-1 1.3 Performance Features of this Release... 1-2
2
Top Tuning Recommendations for WebLogic Server
2.1 Tune Pool Sizes... 2-1 2.2 Use the Prepared Statement Cache ... 2-2 2.3 Use Logging Last Resource Optimization... 2-2 2.4 Tune Connection Backlog Buffering ... 2-2 2.5 Tune the Chunk Size ... 2-2 2.6 Use Optimistic or Read-only Concurrency ... 2-2 2.7 Use Local Interfaces ... 2-2 2.8 Use eager-relationship-caching ... 2-3 2.9 Tune HTTP Sessions ... 2-3 2.10 Tune Messaging Applications... 2-3
3
Performance Tuning Roadmap
3.2 Tuning Tips... 3-4
4
Operating System Tuning
5
Tuning Java Virtual Machines (JVMs)
5.1 JVM Tuning Considerations... 5-1 5.2 Which JVM for Your System? ... 5-2 5.2.1 Changing To a Different JVM ... 5-2 5.3 Garbage Collection ... 5-2 5.3.1 VM Heap Size and Garbage Collection ... 5-2 5.3.2 Choosing a Garbage Collection Scheme... 5-3 5.3.3 Using Verbose Garbage Collection to Determine Heap Size ... 5-4 5.3.4 Specifying Heap Size Values... 5-5 5.3.5 Tuning Tips for Heap Sizes ... 5-5 5.3.6 JRockit JVM Heap Size Options... 5-6 5.3.6.1 Other JRockit VM Options ... 5-6 5.3.7 Java HotSpot VM Heap Size Options ... 5-7 5.3.7.1 Other Java HotSpot VM Options ... 5-7 5.3.8 Automatically Logging Low Memory Conditions ... 5-8 5.3.9 Manually Requesting Garbage Collection ... 5-8 5.3.10 Requesting Thread Stacks... 5-8 5.4 Enable Spinning for IA32 Platforms ... 5-8 5.4.1 Sun JDK ... 5-8 5.4.2 JRockit... 5-9
6
Tuning WebLogic Diagnostic Framework and JRockit Flight Recorder
Integration
6.1 Using JRockit Flight Recorder... 6-1 6.2 Using WLDF ... 6-1 6.2.1 Using JRockit controls outside of WLDF to control the default JVM recording ... 6-2 6.3 Tuning Considerations... 6-2
7
Tuning WebLogic Server
7.4.7 Tuning the Stuck Thread Detection Behavior ... 7-5 7.5 Tuning Network I/O... 7-6 7.5.1 Tuning Muxers... 7-6 7.5.2 Which Platforms Have Performance Packs?... 7-7 7.5.3 Enabling Performance Packs... 7-7 7.5.4 Changing the Number of Available Socket Readers ... 7-7 7.5.5 Network Channels... 7-7 7.5.6 Reducing the Potential for Denial of Service Attacks... 7-8 7.5.6.1 Tuning Message Size... 7-8 7.5.6.2 Tuning Complete Message Timeout... 7-8 7.5.6.3 Tuning Number of File Descriptors... 7-8 7.5.7 Tune the Chunk Parameters ... 7-9 7.5.8 Tuning Connection Backlog Buffering ... 7-9 7.5.9 Tuning Cached Connections ... 7-9 7.6 Setting Your Compiler Options ... 7-10 7.6.1 Compiling EJB Classes ... 7-10 7.6.2 Setting JSP Compiler Options ... 7-10 7.6.2.1 Precompile JSPs ... 7-10 7.6.2.2 Optimize Java Expressions... 7-10 7.7 Using WebLogic Server Clusters to Improve Performance... 7-11 7.7.1 Scalability and High Availability ... 7-11 7.7.2 How to Ensure Scalability for WebLogic Clusters... 7-12 7.7.3 Database Bottlenecks... 7-12 7.7.4 Session Replication ... 7-12 7.7.5 Asynchronous HTTP Session Replication... 7-12 7.7.5.1 Asynchronous HTTP Session Replication using a Secondary Server... 7-13 7.7.5.2 Asynchronous HTTP Session Replication using a Database ... 7-13 7.7.6 Invalidation of Entity EJBs ... 7-14 7.7.7 Invalidation of HTTP sessions ... 7-14 7.7.8 JNDI Binding, Unbinding and Rebinding... 7-14 7.7.9 Running Multiple Server Instances on Multi-Core Machines... 7-14 7.8 Monitoring a WebLogic Server Domain... 7-15 7.8.1 Using the Administration Console to Monitor WebLogic Server ... 7-15 7.8.2 Using the WebLogic Diagnostic Framework... 7-15 7.8.3 Using JMX to Monitor WebLogic Server... 7-15 7.8.4 Using WLST to Monitor WebLogic Server ... 7-15 7.8.5 Resources to Monitor WebLogic Server ... 7-15 7.8.6 Third-Party Tools to Monitor WebLogic Server ... 7-15 7.9 Tuning Class and Resource Loading ... 7-16 7.9.1 Filtering Loader Mechanism ... 7-16 7.9.2 Class Caching ... 7-16
8
Tuning the WebLogic Persistent Store
8.1.4 Using Diagnostic Stores ... 8-2 8.2 Best Practices When Using Persistent Stores ... 8-2 8.3 Tuning JDBC Stores ... 8-3 8.4 Tuning File Stores ... 8-3 8.4.1 Basic Tuning Information ... 8-3 8.4.2 Tuning a File Store Direct-Write-With-Cache Policy ... 8-4 8.4.2.1 Additional Considerations ... 8-5 8.4.3 Tuning the File Store Direct-Write Policy ... 8-6 8.4.4 Tuning the File Store Block Size ... 8-6 8.4.4.1 Setting the Block Size for a File Store... 8-7 8.4.4.2 Determining the File Store Block Size ... 8-8 8.4.4.3 Determining the File System Block Size... 8-8 8.4.4.4 Converting a Store with Pre-existing Files ... 8-8 8.5 File Locking and NFS ... 8-9 8.5.1 Solution 1 - Copying Data Files to Remove NFS Locks ... 8-10 8.5.2 Solution 2 - Disabling File Locks in WebLogic Server File Stores ... 8-10 8.5.2.1 Disabling File Locking for the Default File Store... 8-11 8.5.2.2 Disabling File Locking for a Custom File Store... 8-11 8.5.2.3 Disabling File Locking for a JMS Paging File Store ... 8-12 8.5.2.4 Disabling File Locking for a Diagnostics File Store ... 8-12
9
DataBase Tuning
10.4.5 include-updates... 10-6 10.4.6 call-by-reference... 10-6 10.4.7 Bean-level Pessimistic Locking ... 10-6 10.4.8 Concurrency Strategy... 10-7 10.5 Tuning In Response to Monitoring Statistics... 10-8 10.5.1 Cache Miss Ratio... 10-8 10.5.2 Lock Waiter Ratio ... 10-8 10.5.3 Lock Timeout Ratio ... 10-9 10.5.4 Pool Miss Ratio... 10-9 10.5.5 Destroyed Bean Ratio... 10-10 10.5.6 Pool Timeout Ratio ... 10-10 10.5.7 Transaction Rollback Ratio... 10-10 10.5.8 Transaction Timeout Ratio ... 10-11 10.6 Using the JDT Compiler... 10-11
11
Tuning Message-Driven Beans
11.1 Use Transaction Batching ... 11-1 11.2 MDB Thread Management ... 11-1 11.2.1 Determining the Number of Concurrent MDBs ... 11-2 11.2.2 Selecting a Concurrency Strategy... 11-2 11.2.3 Thread Utilization When Using WebLogic Destinations ... 11-3 11.2.4 Limitations for Multi-threaded Topic MDBs... 11-3 11.3 Best Practices for Configuring and Deploying MDBs Using Distributed Topics ... 11-4 11.4 Using MDBs with Foreign Destinations ... 11-4 11.4.1 Concurrency for MDBs that Process Messages from Foreign Destinations... 11-4 11.4.2 Thread Utilization for MDBs that Process Messages from Foreign Destinations ... 11-4 11.5 Token-based Message Polling for Transactional MDBs Listening on Queues/Topics . 11-5 11.6 Compatibility for WLS 10.0 and Earlier-style Polling ... 11-6
12
Tuning Data Sources
12.1 Tune the Number of Database Connections ... 12-1 12.2 Waste Not... 12-1 12.3 Use Test Connections on Reserve with Care ... 12-2 12.4 Cache Prepared and Callable Statements... 12-2 12.5 Using Pinned-To-Thread Property to Increase Performance ... 12-2 12.6 Database Listener Timeout under Heavy Server Loads ... 12-3 12.7 Disable Wrapping of Data Type Objects ... 12-3 12.8 Use Best Design Practices ... 12-3
13
Tuning Transactions
14
Tuning WebLogic JMS
14.16.6 XA Enabled On Client's Host Connection Factory ... 14-22 14.16.7 Higher QOS Detected... 14-22 14.16.8 Destination Quota Exceeded... 14-23 14.16.9 Change In Server Security Policy ... 14-23 14.16.10 Change In JMS Server or Destination Status ... 14-23 14.16.11 Looking Up Logical Distributed Destination Name ... 14-23 14.16.12 Hardware Failure... 14-23 14.16.13 One-Way Send QOS Guidelines... 14-23 14.17 Tuning the Messaging Performance Preference Option ... 14-24 14.17.1 Messaging Performance Configuration Parameters... 14-25 14.17.2 Compatibility With the Asynchronous Message Pipeline... 14-26 14.18 Client-side Thread Pools... 14-26 14.19 Best Practices for JMS .NET Client Applications... 14-26
15
Tuning WebLogic JMS Store-and-Forward
15.1 Best Practices ... 15-1 15.2 Tuning Tips... 15-1
16
Tuning WebLogic Message Bridge
16.1 Best Practices ... 16-1 16.2 Changing the Batch Size ... 16-1 16.3 Changing the Batch Interval... 16-2 16.4 Changing the Quality of Service... 16-2 16.5 Using Multiple Bridge Instances ... 16-2 16.6 Changing the Thread Pool Size... 16-2 16.7 Avoiding Durable Subscriptions ... 16-3 16.8 Co-locating Bridges with Their Source or Target Destination ... 16-3 16.9 Changing the Asynchronous Mode Enabled Attribute ... 16-3
17
Tuning Resource Adapters
17.1 Classloading Optimizations for Resource Adapters ... 17-1 17.2 Connection Optimizations... 17-1 17.3 Thread Management ... 17-2 17.4 InteractionSpec Interface... 17-2
18
Tuning Web Applications
18.2.1 Managing Session Persistence ... 18-3 18.2.2 Minimizing Sessions... 18-3 18.2.3 Aggregating Session Data ... 18-3 18.3 Pub-Sub Tuning Guidelines ... 18-4
19
Tuning Web Services
19.1 Web Services Best Practices ... 19-1 19.2 Tuning Web Service Reliable Messaging Agents ... 19-2 19.3 Tuning Heavily Loaded Systems to Improve Web Service Performance ... 19-2 19.3.1 Setting the Buffering Sessions... 19-2 19.3.2 Releasing Asynchronous Resources ... 19-3
20
Tuning WebLogic Tuxedo Connector
20.1 Configuration Guidelines ... 20-1 20.2 Best Practices ... 20-2
A
Using the WebLogic 8.1 Thread Pool Model
A.1 How to Enable the WebLogic 8.1 Thread Pool Model ... A-1 A.2 Tuning the Default Execute Queue ... A-2 A.2.1 Should You Modify the Default Thread Count? ... A-2 A.3 Using Execute Queues to Control Thread Usage... A-3 A.3.1 Creating Execute Queues... A-4 A.3.2 Modifying the Thread Count ... A-6 A.3.3 Tuning Execute Queues for Overflow Conditions ... A-6 A.3.4 Assigning Servlets and JSPs to Execute Queues ... A-7 A.3.5 Assigning EJBs and RMI Objects to Execute Queues ... A-8 A.4 Monitoring Execute Threads ... A-8 A.5 Allocating Execute Threads to Act as Socket Readers ... A-8 A.5.1 Setting the Number of Socket Reader Threads For a Server Instance ... A-9 A.5.2 Setting the Number of Socket Reader Threads on Client Machines ... A-9 A.6 Tuning the Stuck Thread Detection Behavior... A-9
B
Capacity Planning
Preface
This preface describes the document accessibility features and conventions used in this guide—Performance and Tuning for Oracle WebLogic Server.
Documentation Accessibility
Our goal is to make Oracle products, services, and supporting documentation accessible to all users, including users that are disabled. To that end, our
documentation includes features that make information available to users of assistive technology. This documentation is available in HTML format, and contains markup to facilitate access by the disabled community. Accessibility standards will continue to evolve over time, and Oracle is actively engaged with other market-leading
technology vendors to address technical obstacles so that our documentation can be accessible to all of our customers. For more information, visit the Oracle Accessibility Program Web site at http://www.oracle.com/accessibility/.
Accessibility of Code Examples in Documentation
Screen readers may not always correctly read the code examples in this document. The conventions for writing code require that closing braces should appear on an
otherwise empty line; however, some screen readers may not always read a line of text that consists solely of a bracket or brace.
Accessibility of Links to External Web Sites in Documentation
This documentation may contain links to Web sites of other companies or
organizations that Oracle does not own or control. Oracle neither evaluates nor makes any representations regarding the accessibility of these Web sites.
Access to Oracle Support
Oracle customers have access to electronic support through My Oracle Support. For information, visit http://www.oracle.com/support/contact.html or visit http://www.oracle.com/accessibility/support.html if you are hearing impaired.
Conventions
The following text conventions are used in this document:
Convention Meaning
italic Italic type indicates book titles, emphasis, or placeholder variables for which you supply particular values.
monospace Monospace type indicates commands within a paragraph, URLs, code in examples, text that appears on the screen, or text that you enter.
1
1
Introduction and Roadmap
This section describes the contents and organization of this guide—Performance and Tuning for Oracle WebLogic Server.
■ Section 1.1, "Document Scope and Audience"
■ Section 1.2, "Guide to this Document"
■ Section 1.3, "Performance Features of this Release"
1.1 Document Scope and Audience
This document is written for people who monitor performance and tune the components in a WebLogic Server environment. It is assumed that readers know server administration and hardware performance tuning fundamentals, WebLogic Server, XML, and the Java programming language.
1.2 Guide to this Document
■ This chapter, Chapter 1, "Introduction and Roadmap," introduces the organization of this guide.
■ Chapter 2, "Top Tuning Recommendations for WebLogic Server," discusses the most frequently recommended steps for achieving optimal performance tuning for applications running on WebLogic Server.
■ Chapter 3, "Performance Tuning Roadmap," provides a roadmap to help tune your application environment to optimize performance.
■ Chapter 4, "Operating System Tuning," discusses operating system issues. ■ Chapter 5, "Tuning Java Virtual Machines (JVMs)," discusses JVM tuning
considerations.
■ Chapter 6, "Tuning WebLogic Diagnostic Framework and JRockit Flight Recorder Integration," provides information on how WebLogic Diagnostic Framework (WLDF) works with JRockit Mission Control Flight Recorder.
■ Chapter 7, "Tuning WebLogic Server," contains information on how to tune WebLogic Server to match your application needs.
■ Chapter 8, "Tuning the WebLogic Persistent Store," provides information on how to tune a persistent store.
Performance Features of this Release
■ Chapter 10, "Tuning WebLogic Server EJBs," provides information on how to tune applications that use EJBs.
■ Chapter 11, "Tuning Message-Driven Beans," provides information on how to tune Message-Driven beans.
■ Chapter 12, "Tuning Data Sources," provides information on how to tune JDBC applications.
■ Chapter 13, "Tuning Transactions," provides information on how to tune Logging Last Resource transaction optimization.
■ Chapter 14, "Tuning WebLogic JMS," provides information on how to tune applications that use WebLogic JMS.
■ Chapter 15, "Tuning WebLogic JMS Store-and-Forward," provides information on how to tune applications that use JMS Store-and-Forward.
■ Chapter 16, "Tuning WebLogic Message Bridge," provides information on how to tune applications that use the Weblogic Message Bridge.
■ Chapter 17, "Tuning Resource Adapters," provides information on how to tune applications that use resource adaptors.
■ Chapter 18, "Tuning Web Applications," provides best practices for tuning WebLogic Web applications and application resources:
■ Chapter 19, "Tuning Web Services," provides information on how to tune applications that use Web services.
■ Chapter 20, "Tuning WebLogic Tuxedo Connector," provides information on how to tune applications that use WebLogic Tuxedo Connector.
■ Appendix A, "Using the WebLogic 8.1 Thread Pool Model," provides information on using execute queues.
■ Appendix B, "Capacity Planning," provides an introduction to capacity planning.
1.3 Performance Features of this Release
WebLogic Server introduces the following performance enhancements:
■ Section 8.4.2, "Tuning a File Store Direct-Write-With-Cache Policy"
■ Section 8.5, "File Locking and NFS"
2
2
Top Tuning Recommendations for WebLogic
Server
Performance tuning WebLogic Server and your WebLogic Server application is a complex and iterative process. To get you started, we have created a short list of recommendations to help you optimize your application's performance. These tuning techniques are applicable to nearly all WebLogic applications.
■ Section 2.1, "Tune Pool Sizes"
■ Section 2.2, "Use the Prepared Statement Cache"
■ Section 2.3, "Use Logging Last Resource Optimization"
■ Section 2.4, "Tune Connection Backlog Buffering"
■ Section 2.5, "Tune the Chunk Size"
■ Section 2.6, "Use Optimistic or Read-only Concurrency"
■ Section 2.7, "Use Local Interfaces"
■ Section 2.8, "Use eager-relationship-caching"
■ Section 2.9, "Tune HTTP Sessions"
■ Section 2.10, "Tune Messaging Applications"
2.1 Tune Pool Sizes
Provide pool sizes (such as pools for JDBC connections, Stateless Session EJBs, and MDBs) that maximize concurrency for the expected thread utilization.
■ For WebLogic Server releases 9.0 and higher—A server instance uses a self-tuned thread-pool. The best way to determine the appropriate pool size is to monitor the pool's current size, shrink counts, grow counts, and wait counts. See Section 7.4, "Thread Management". Tuning MDBs are a special case, please see Chapter 11, "Tuning Message-Driven Beans".
Use the Prepared Statement Cache
2.2 Use the Prepared Statement Cache
The prepared statement cache keeps compiled SQL statements in memory, thus avoiding a round-trip to the database when the same statement is used later. See Chapter 12, "Tuning Data Sources".
2.3 Use Logging Last Resource Optimization
When using transactional database applications, consider using the JDBC data source Logging Last Resource (LLR) transaction policy instead of XA. The LLR optimization can significantly improve transaction performance by safely eliminating some of the 2PC XA overhead for database processing, especially for two-phase commit database insert, update, and delete operations. For more information, see Chapter 12, "Tuning Data Sources".
2.4 Tune Connection Backlog Buffering
You can tune the number of connection requests that a WebLogic Server instance accepts before refusing additional requests. This tunable applies primarily for Web applications. See Section 7.5.8, "Tuning Connection Backlog Buffering".
2.5 Tune the Chunk Size
A chunk is a unit of memory that the WebLogic Server network layer, both on the client and server side, uses to read data from and write data to sockets. A server instance maintains a pool of these chunks. For applications that handle large amounts of data per request, increasing the value on both the client and server sides can boost performance. See Section 7.5.7, "Tune the Chunk Parameters".
2.6 Use Optimistic or Read-only Concurrency
Use optimistic concurrency with cache-between-transactions or read-only concurrency with query-caching for CMP EJBs wherever possible. Both of these two options leverage the Entity Bean cache provided by the EJB container.
■ Optimistic-concurrency with cache-between-transactions work best with read-mostly beans. Using verify-reads in combination with these provides high data consistency guarantees with the performance gain of caching. See Chapter 10, "Tuning WebLogic Server EJBs".
■ Query-caching is a WebLogic Server 9.0 feature that allows the EJB container to cache results for arbitrary non-primary-key finders defined on read-only EJBs. All of these parameters can be set in the application/module deployment descriptors. See Section 10.4.8, "Concurrency Strategy".
2.7 Use Local Interfaces
Use local-interfaces or use call-by-reference semantics to avoid the overhead of serialization when one EJB calls another or an EJB is called by a servlet/JSP in the same application. Note the following:
Tune Messaging Applications
■ This optimization does not apply to calls across different applications.
2.8 Use eager-relationship-caching
Use eager-relationship-caching wherever possible. This feature allows the EJB
container to load related beans using a single SQL statement. It improves performance by reducing the number of database calls to load related beans in transactions when a bean and it's related beans are expected to be used in that transaction. See Chapter 10, "Tuning WebLogic Server EJBs".
2.9 Tune HTTP Sessions
Optimize your application so that it does as little work as possible when handling session persistence and sessions. You should also design a session management strategy that suits your environment and application. See Section 18.2, "Session Management".
2.10 Tune Messaging Applications
Oracle provides messaging users a rich set of performance tunables. In general, you should always configure quotas and paging. See:
■ Chapter 8, "Tuning the WebLogic Persistent Store"
■ Chapter 14, "Tuning WebLogic JMS"
■ Chapter 15, "Tuning WebLogic JMS Store-and-Forward"
3
3
Performance Tuning Roadmap
Performance tuning WebLogic Server and your WebLogic Server application is a complex and iterative process. The following sections provide a tuning roadmap and tuning tips for you can use to improve system performance:
■ Section 3.1, "Performance Tuning Roadmap"
■ Section 3.2, "Tuning Tips"
3.1 Performance Tuning Roadmap
The following steps provide a roadmap to help tune your application environment to optimize performance:
1. Section 3.1.1, "Understand Your Performance Objectives"
2. Section 3.1.2, "Measure Your Performance Metrics"
3. Section 3.1.5, "Locate Bottlenecks in Your System"
4. Section 3.1.6, "Minimize Impact of Bottlenecks"
5. Section 3.1.12, "Achieve Performance Objectives"
3.1.1 Understand Your Performance Objectives
To determine your performance objectives, you need to understand the application deployed and the environmental constraints placed on the system. Gather information about the levels of activity that components of the application are expected to meet, such as:
■ The anticipated number of users. ■ The number and size of requests. ■ The amount of data and its consistency. ■ Determining your target CPU utilization.
Performance Tuning Roadmap
Performance objectives are limited by constraints, such as
■ The configuration of hardware and software such as CPU type, disk size vs. disk speed, sufficient memory.
There is no single formula for determining your hardware requirements. The process of determining what type of hardware and software configuration is required to meet application needs adequately is called capacity planning. Capacity planning requires assessment of your system performance goals and an understanding of your application. Capacity planning for server hardware should focus on maximum performance requirements. See Appendix B, "Capacity Planning."
■ The ability to interoperate between domains, use legacy systems, support legacy data.
■ Development, implementation, and maintenance costs.
You will use this information to set realistic performance objectives for your application environment, such as response times, throughput, and load on specific hardware.
3.1.2 Measure Your Performance Metrics
After you have determined your performance criteria in Section 3.1.1, "Understand Your Performance Objectives", take measurements of the metrics you will use to quantify your performance objectives. The following sections provide information on measuring basic performance metrics:
■ Section 3.1.3, "Monitor Disk and CPU Utilization"
■ Section 3.1.4, "Monitor Data Transfers Across the Network"
3.1.3 Monitor Disk and CPU Utilization
Run your application under a high load while monitoring the:
■ Application server (disk and CPU utilization) ■ Database server (disk and CPU utilization)
The goal is to get to a point where the application server achieves your target CPU utilization. If you find that the application server CPU is under utilized, confirm whether the database is bottle necked. If the database CPU is 100 percent utilized, then check your application SQL calls query plans. For example, are your SQL calls using indexes or doing linear searches? Also, confirm whether there are too many ORDER BY clauses used in your application that are affecting the database CPU. See Chapter 4, "Operating System Tuning".
If you discover that the database disk is the bottleneck (for example, if the disk is 100 percent utilized), try moving to faster disks or to a RAID (redundant array of
independent disks) configuration, assuming the application is not doing more writes then required.
Once you know the database server is not the bottleneck, determine whether the application server disk is the bottleneck. Some of the disk bottlenecks for application server disks are:
Performance Tuning Roadmap
■ Server logging
The disk I/O on an application server can be optimized using faster disks or RAID, disabling synchronous JMS writes, using JTA direct writes for tlogs, or increasing the HTTP log buffer.
3.1.4 Monitor Data Transfers Across the Network
Check the amount of data transferred between the application and the application server, and between the application server and the database server. This amount should not exceed your network bandwidth; otherwise, your network becomes the bottleneck. See Section 4, "Operating System Tuning."
3.1.5 Locate Bottlenecks in Your System
If you determine that neither the network nor the database server is the bottleneck, start looking at your operating system, JVM, and WebLogic Server configurations. Most importantly, is the machine running WebLogic Server able to get your target CPU utilization with a high client load? If the answer is no, then check if there is any locking taking place in the application. You should profile your application using a commercially available tool (for example, JProbe or OptimizeIt) to pinpoint
bottlenecks and improve application performance.
3.1.6 Minimize Impact of Bottlenecks
In this step, you tune your environment to minimize the impact of bottlenecks on your performance objectives. It is important to realize that in this step you are minimizing the impact of bottlenecks, not eliminating them. Tuning allows you to adjust resources to achieve your performance objectives. For the scope of this document, this includes (from most important to least important):
■ Section 3.1.7, "Tune Your Application"
■ Section 3.1.8, "Tune your DB"
■ Section 3.1.9, "Tune WebLogic Server Performance Parameters"
■ Section 3.1.10, "Tune Your JVM"
■ Section 3.1.11, "Tune the Operating System"
■ Section 8, "Tuning the WebLogic Persistent Store"
3.1.7 Tune Your Application
To quote the authors of Oracle WebLogic Server: Optimizing WebLogic Server Performance: "Good application performance starts with good application design. Overly-complex or poorly-designed applications will perform poorly regardless of the system-level tuning and best practices employed to improve performance." In other words, a poorly designed application can create unnecessary bottlenecks. For example, resource contention could be a case of poor design, rather than inherent to the application domain.
For more information, see:
Tuning Tips
■ Chapter 10, "Tuning WebLogic Server EJBs"
■ Chapter 11, "Tuning Message-Driven Beans"
■ Chapter 12, "Tuning Data Sources"
■ Chapter 13, "Tuning Transactions"
■ Chapter 14, "Tuning WebLogic JMS"
■ Chapter 15, "Tuning WebLogic JMS Store-and-Forward"
■ Chapter 16, "Tuning WebLogic Message Bridge"
■ Chapter 17, "Tuning Resource Adapters"
■ Chapter 18, "Tuning Web Applications"
■ Chapter 19, "Tuning Web Services"
■ Chapter 20, "Tuning WebLogic Tuxedo Connector"
3.1.8 Tune your DB
Your database can be a major enterprise-level bottleneck. Database optimization can be complex and vender dependent. See Section 9, "DataBase Tuning".
3.1.9 Tune WebLogic Server Performance Parameters
The WebLogic Server uses a number of OOTB (out-of-the-box) performance-related parameters that can be fine-tuned depending on your environment and applications. Tuning these parameters based on your system requirements (rather than running with default settings) can greatly improve both single-node performance and the scalability characteristics of an application. See Chapter 7, "Tuning WebLogic Server".
3.1.10 Tune Your JVM
The Java virtual machine (JVM) is a virtual "execution engine" instance that executes the bytecodes in Java class files on a microprocessor. See Chapter 5, "Tuning Java Virtual Machines (JVMs)".
3.1.11 Tune the Operating System
Each operating system sets default tuning parameters differently. For Windows platforms, the default settings are usually sufficient. However, the UNIX and Linux operating systems usually need to be tuned appropriately. See Chapter 4, "Operating System Tuning".
3.1.12 Achieve Performance Objectives
Performance tuning is an iterative process. After you have minimized the impact of bottlenecks on your system, go to Step 2, Section 3.1.2, "Measure Your Performance Metrics" and determine if you have met your performance objectives.
3.2 Tuning Tips
This section provides tips and guidelines when tuning overall system performance:
Tuning Tips
■ Performance tuning is ongoing process. Implement mechanisms that provide performance metrics which you can compare against your performance objectives, allowing you to schedule a tuning phase before your system fails.
■ The object is to meet your performance objectives, not eliminate all bottlenecks. Resources within a system are finite. By definition, at least one resource (CPU, memory, or I/O) will be a bottleneck in the system. Tuning allows you minimize the impact of bottlenecks on your performance objectives.
■ Design your applications with performance in mind:
– Keep things simple - avoid inappropriate use of published patterns. – Apply Java EE performance patterns.
4
4
Operating System Tuning
Proper OS tuning improves system performance by preventing the occurrence of error conditions. Operating system error conditions always degrade performance. Typically most error conditions are TCP tuning parameter related and are caused by the
operating system's failure to release old sockets from a close_wait call. Common errors are "connection refused", "too many open files" on the server-side, and "address in use: connect" on the client-side.
In most cases, these errors can be prevented by adjusting the TCP wait_time value and the TCP queue size. Although users often find the need to make adjustments when using tunnelling, OS tuning may be necessary for any protocol under sufficiently heavy loads.
5
5
Tuning Java Virtual Machines (JVMs)
The Java virtual machine (JVM) is a virtual "execution engine" instance that executes the bytecodes in Java class files on a microprocessor. How you tune your JVM affects the performance of WebLogic Server and your applications. envelope
The following sections discuss JVM tuning options for WebLogic Server:
■ Section 5.1, "JVM Tuning Considerations"
■ Section 5.2, "Which JVM for Your System?"
■ Section 5.3, "Garbage Collection"
■ Section 5.4, "Enable Spinning for IA32 Platforms"
5.1 JVM Tuning Considerations
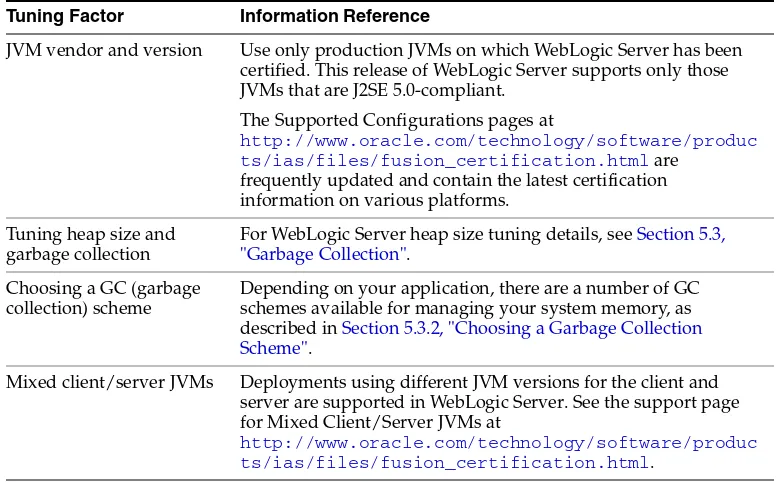
The following table presents general JVM tuning considerations for WebLogic Server.
Table 5–1 General JVM Tuning Considerations
Tuning Factor Information Reference
JVM vendor and version Use only production JVMs on which WebLogic Server has been certified. This release of WebLogic Server supports only those JVMs that are J2SE 5.0-compliant.
The Supported Configurations pages at
http://www.oracle.com/technology/software/produc
ts/ias/files/fusion_certification.html are
frequently updated and contain the latest certification information on various platforms.
Tuning heap size and garbage collection
For WebLogic Server heap size tuning details, see Section 5.3, "Garbage Collection".
Choosing a GC (garbage collection) scheme
Depending on your application, there are a number of GC schemes available for managing your system memory, as described in Section 5.3.2, "Choosing a Garbage Collection Scheme".
Mixed client/server JVMs Deployments using different JVM versions for the client and server are supported in WebLogic Server. See the support page for Mixed Client/Server JVMs at
http://www.oracle.com/technology/software/produc
Which JVM for Your System?
5.2 Which JVM for Your System?
Although this section focuses on Sun Microsystems' J2SE 5.0 JVM for the Windows, UNIX, and Linux platforms, the JRockit JVM was developed expressly for server-side applications and optimized for Intel architectures to ensure reliability, scalability, manageability, and flexibility for Java applications. For more information about the benefits of using JRockit on Windows and Linux platforms, see "Introduction to JRockit JDK" at http://download.oracle.com/docs/cd/E13150_01/jrockit_ jvm/jrockit/webdocs/index.html.
For more information on JVMs in general, see "Introduction to the JVM specification" at http://java.sun.com/docs/books/vmspec/2nd-edition/html/Introduct ion.doc.html#3057.
5.2.1 Changing To a Different JVM
When you create a domain, if you choose to customize the configuration, the
Configuration Wizard presents a list of JDKs that WebLogic Server installed. From this list, you choose the JVM that you want to run your domain and the wizard configures the Oracle start scripts based on your choice. After you create a domain, if you want to use a different JVM, see "Changing the JVM That Runs Servers" in Managing Server Startup and Shutdown for Oracle WebLogic Server.
5.3 Garbage Collection
Garbage collection is the VM's process of freeing up unused Java objects in the Java heap. The following sections provide information on tuning your VM's garbage collection:
■ Section 5.3.1, "VM Heap Size and Garbage Collection"
■ Section 5.3.2, "Choosing a Garbage Collection Scheme"
■ Section 5.3.3, "Using Verbose Garbage Collection to Determine Heap Size"
■ Section 5.3.4, "Specifying Heap Size Values"
■ Section 5.3.8, "Automatically Logging Low Memory Conditions"
■ Section 5.3.9, "Manually Requesting Garbage Collection"
■ Section 5.3.10, "Requesting Thread Stacks"
5.3.1 VM Heap Size and Garbage Collection
The Java heap is where the objects of a Java program live. It is a repository for live objects, dead objects, and free memory. When an object can no longer be reached from
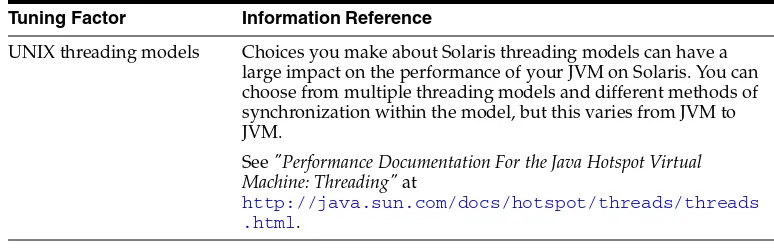
UNIX threading models Choices you make about Solaris threading models can have a large impact on the performance of your JVM on Solaris. You can choose from multiple threading models and different methods of synchronization within the model, but this varies from JVM to JVM.
See "Performance Documentation For the Java Hotspot Virtual Machine: Threading" at
http://java.sun.com/docs/hotspot/threads/threads .html.
Table 5–1 (Cont.) General JVM Tuning Considerations
Garbage Collection
any pointer in the running program, it is considered "garbage" and ready for
collection. A best practice is to tune the time spent doing garbage collection to within 5% of execution time.
The JVM heap size determines how often and how long the VM spends collecting garbage. An acceptable rate for garbage collection is application-specific and should be adjusted after analyzing the actual time and frequency of garbage collections. If you set a large heap size, full garbage collection is slower, but it occurs less frequently. If you set your heap size in accordance with your memory needs, full garbage collection is faster, but occurs more frequently.
The goal of tuning your heap size is to minimize the time that your JVM spends doing garbage collection while maximizing the number of clients that WebLogic Server can handle at a given time. To ensure maximum performance during benchmarking, you might set high heap size values to ensure that garbage collection does not occur during the entire run of the benchmark.
You might see the following Java error if you are running out of heap space:
java.lang.OutOfMemoryError <<no stack trace available>> java.lang.OutOfMemoryError <<no stack trace available>> Exception in thread "main"
To modify heap space values, see Section 5.3.4, "Specifying Heap Size Values". To configure WebLogic Server to detect automatically when you are running out of heap space and to address low memory conditions in the server, see Section 5.3.8, "Automatically Logging Low Memory Conditions" and Section 5.3.4, "Specifying Heap Size Values".
5.3.2 Choosing a Garbage Collection Scheme
Depending on which JVM you are using, you can choose from several garbage collection schemes to manage your system memory. For example, some garbage collection schemes are more appropriate for a given type of application. Once you have an understanding of the workload of the application and the different garbage collection algorithms utilized by the JVM, you can optimize the configuration of the garbage collection.
Refer to the following links for in-depth discussions of garbage collection options for your JVM:
■ For an overview of the garbage collection schemes available with Sun's HotSpot VM, see "Tuning Garbage Collection with the 5.0 Java Virtual Machine" at
http://java.sun.com/docs/hotspot/gc5.0/gc_tuning_5.html.
■ For a comprehensive explanation of the collection schemes available, see
"Improving Java Application Performance and Scalability by Reducing Garbage Collection Times and Sizing Memory Using JDK 1.4.1" at
http://wireless.java.sun.com/midp/articles/garbagecolletion2/ .
■ For a discussion of the garbage collection schemes available with the JRockit JDK, see "Using the JRockt Memory Management System" at
http://download.oracle.com/docs/cd/E13150_01/jrockit_ jvm/jrockit/webdocs/index.html.
■ For some pointers about garbage collection from an HP perspective, see "Performance tuning Java: Tuning steps" at
Garbage Collection
5.3.3 Using Verbose Garbage Collection to Determine Heap Size
The verbose garbage collection option (verbosegc) enables you to measure exactly how much time and resources are put into garbage collection. To determine the most effective heap size, turn on verbose garbage collection and redirect the output to a log file for diagnostic purposes.
The following steps outline this procedure:
1. Monitor the performance of WebLogic Server under maximum load while running your application.
2. Use the -verbosegc option to turn on verbose garbage collection output for your JVM and redirect both the standard error and standard output to a log file.
This places thread dump information in the proper context with WebLogic Server informational and error messages, and provides a more useful log for diagnostic purposes.
For example, on Windows and Solaris, enter the following:
% java -ms32m -mx200m -verbosegc -classpath $CLASSPATH
-Dweblogic.Name=%SERVER_NAME% -Dbea.home="C:\Oracle\Middleware"
where the logfile.txt 2>&1 command redirects both the standard error and standard output to a log file.
On HPUX, use the following option to redirect stderrstdout to a single file:
-Xverbosegc:file=/tmp/gc$$.out
where $$ maps to the process ID (PID) of the Java process. Because the output includes timestamps for when garbage collection ran, you can infer how often garbage collection occurs.
3. Analyze the following data points:
a. How often is garbage collection taking place? In the weblogic.log file, compare the time stamps around the garbage collection.
b. How long is garbage collection taking? Full garbage collection should not take longer than 3 to 5 seconds.
c. What is your average memory footprint? In other words, what does the heap settle back down to after each full garbage collection? If the heap always settles to 85 percent free, you might set the heap size smaller.
4. Review the New generation heap sizes (Sun) or Nursery size (Jrockit).
■ For Jrockit: see Section 5.3.6, "JRockit JVM Heap Size Options". ■ For Sun: see Section 5.3.7, "Java HotSpot VM Heap Size Options".
5. Make sure that the heap size is not larger than the available free RAM on your system.
Garbage Collection
machine. See your system administrator for help in determining the amount of free RAM on your system.
6. If you find that your system is spending too much time collecting garbage (your allocated virtual memory is more than your RAM can handle), lower your heap size.
Typically, you should use 80 percent of the available RAM (not taken by the operating system or other processes) for your JVM.
7. If you find that you have a large amount of available free RAM remaining, run more instances of WebLogic Server on your machine.
Remember, the goal of tuning your heap size is to minimize the time that your JVM spends doing garbage collection while maximizing the number of clients that WebLogic Server can handle at a given time.
JVM vendors may provide other options to print comprehensive garbage
collection reports. For example, you can use the JRockit JVM -Xgcreport option to print a comprehensive garbage collection report at program completion, see "Viewing Garbage Collection Behavior", at
http://download.oracle.com/docs/cd/E13150_01/jrockit_ jvm/jrockit/webdocs/index.html.
5.3.4 Specifying Heap Size Values
System performance is greatly influenced by the size of the Java heap available to the JVM. This section describes the command line options you use to define the heap sizes values.You must specify Java heap size values each time you start an instance of WebLogic Server. This can be done either from the java command line or by
modifying the default values in the sample startup scripts that are provided with the WebLogic distribution for starting WebLogic Server.
■ Section 5.3.5, "Tuning Tips for Heap Sizes"
■ Section 5.3.6, "JRockit JVM Heap Size Options"
■ Section 5.3.7, "Java HotSpot VM Heap Size Options"
5.3.5 Tuning Tips for Heap Sizes
The following section provides general guidelines for tuning VM heap sizes:
■ The heap sizes should be set to values such that the maximum amount of memory used by the VM does not exceed the amount of available physical RAM. If this value is exceeded, the OS starts paging and performance degrades significantly. The VM always uses more memory than the heap size. The memory required for internal VM functionality, native libraries outside of the VM, and permanent generation memory (for the Sun VM only: memory required to store classes and methods) is allocated in addition to the heap size settings.
■ When using a generational garbage collection scheme, the nursery size should not exceed more than half the total Java heap size. Typically, 25% to 40% of the heap size is adequate.
Garbage Collection
5.3.6 JRockit JVM Heap Size Options
Although JRockit provides automatic heap resizing heuristics, they are not optimal for all applications. In most situations, best performance is achieved by tuning the VM for each application by adjusting the heaps size options shown in the following table.
For example, when you start a WebLogic Server instance from a java command line, you could specify the JRockit VM heap size values as follows:
$ java -Xns10m -Xms512m -Xmx512m
The default size for these values is measured in bytes. Append the letter 'k' or 'K' to the value to indicate kilobytes, 'm' or 'M' to indicate megabytes, and 'g' or 'G' to indicate gigabytes. The example above allocates 10 megabytes of memory to the Nursery heap sizes and 512 megabytes of memory to the minimum and maximum heap sizes for the WebLogic Server instance running in the JVM.
For detailed information about setting the appropriate heap sizes for WebLogic's JRockit JVM, see "Tuning the JRockit JVM" at
http://download.oracle.com/docs/cd/E13150_01/jrockit_ jvm/jrockit/webdocs/index.html.
5.3.6.1 Other JRockit VM Options
Oracle provides other command-line options to improve the performance of your JRockit VM. For detailed information, see "Command Line Reference " at
http://download.oracle.com/docs/cd/E13150_01/jrockit_ jvm/jrockit/jrdocs/refman/index.html.
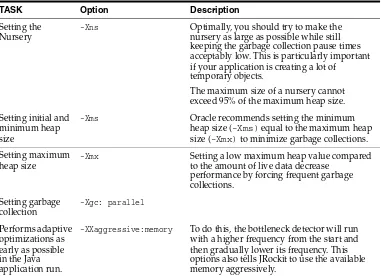
Table 5–2 JRockit JVM Heap Size Options
TASK Option Description
Setting the Nursery
-Xns Optimally, you should try to make the nursery as large as possible while still keeping the garbage collection pause times acceptably low. This is particularly important if your application is creating a lot of
temporary objects.
The maximum size of a nursery cannot exceed 95% of the maximum heap size.
Setting initial and minimum heap size
-Xms Oracle recommends setting the minimum heap size (-Xms) equal to the maximum heap size (-Xmx) to minimize garbage collections. Setting maximum
heap size
-Xmx Setting a low maximum heap value compared to the amount of live data decrease
performance by forcing frequent garbage collections.
Garbage Collection
5.3.7 Java HotSpot VM Heap Size Options
You achieve best performance by individually tuning each application. However, configuring the Java HotSpot VM heap size options listed in the following table when starting WebLogic Server increases performance for most applications.
These options may differ depending on your architecture and operating system. See your vendor's documentation for platform-specific JVM tuning options.
For example, when you start a WebLogic Server instance from a java command line, you could specify the HotSpot VM heap size values as follows:
$ java -XX:NewSize=128m -XX:MaxNewSize=128m -XX:SurvivorRatio=8 -Xms512m -Xmx512m
The default size for these values is measured in bytes. Append the letter 'k' or 'K' to the value to indicate kilobytes, 'm' or 'M' to indicate megabytes, and 'g' or 'G' to indicate gigabytes. The example above allocates 128 megabytes of memory to the New generation and maximum New generation heap sizes, and 512 megabytes of memory to the minimum and maximum heap sizes for the WebLogic Server instance running in the JVM.
5.3.7.1 Other Java HotSpot VM Options
Sun provides other standard and non-standard command-line options to improve the performance of your VM. How you use these options depends on how your
application is coded.
Test both your client and server JVMs to see which options perform better for your particular application. The Sun Microsystems document provides information on the
Table 5–3 Java Heap Size Options
Task Option Comments
Setting the New generation heap size
-XX:NewSize As a general rule, set -XX:NewSize to be one-fourth the size of the heap size. Increase the value of this option for larger numbers of short-lived objects.
Be sure to increase the New generation as you increase the number of processors. Memory allocation can be parallel, but garbage collection is not parallel.
Setting the maximum New generation heap size
-XX:MaxNewSize Set the maximum size of the New Generation heap size.
Setting New heap size ratios
-XX:SurvivorRatio The New generation area is divided into three sub-areas: Eden, and two survivor spaces that are equal in size.
Configure the ratio of the Eden/survivor space size. Try setting this value to 8, and then monitor your garbage collection.
Setting initial heap size -Xms As a general rule, set intial heap size (-Xms) equal to the maximum heap size (-Xmx) to minimize garbage collections. Setting maximum heap
size
Enable Spinning for IA32 Platforms
command-line options and environment variables that can affect the performance characteristics of the Java HotSpot Virtual Machine. See
http://java.sun.com/docs/hotspot/VMOptions.html. For additional examples of the HotSpot VM options, see:
■ "Standard Options for Windows (Win32) VMs" at
http://java.sun.com/javase/6/docs/tooldocs/windows/java.html.
■ "Standard Options for Solaris VMs" at
http://java.sun.com/javase/6/docs/tooldocs/solaris/java.html.
■ "Standard Options for Linux VMs" at
http://java.sun.com/j2se/1.5.0/docs/tooldocs/linux/java.html. Sun Microsystems Java Virtual Machine document provides a detailed discussion of the Client and Server implementations of the Java virtual machine for J2SE 5.0 at
http://java.sun.com/j2se/1.5.0/docs/guide/vm/index.html.
5.3.8 Automatically Logging Low Memory Conditions
WebLogic Server enables you to automatically log low memory conditions observed by the server. WebLogic Server detects low memory by sampling the available free memory a set number of times during a time interval. At the end of each interval, an average of the free memory is recorded and compared to the average obtained at the next interval. If the average drops by a user-configured amount after any sample interval, the server logs a low memory warning message in the log file and sets the server health state to "warning." See "Log low memory conditions" in Oracle WebLogic Server Administration Console Help.
5.3.9 Manually Requesting Garbage Collection
You may find it necessary to manually request full garbage collection from the Administration Console. When you do, remember that garbage collection is costly as the JVM often examines every living object in the heap. See "Manually request garbage collection" in Oracle WebLogic Server Administration Console Help.
5.3.10 Requesting Thread Stacks
You may find it necessary to display thread stacks while tuning your applications. See "Display thread stacks" in Oracle WebLogic Server Administration Console Help.
5.4 Enable Spinning for IA32 Platforms
If you are running a high-stress application with heavily contended locks on a multiprocessor system, you can attempt to improve performance by using spinning. This option enables the ability to spin the lock for a short time before going to sleep.
5.4.1 Sun JDK
Sun has changed the default lock spinning behavior in JDK 5.0 on the Windows IA32 platform. For the JDK 5.0 release, lock spinning is disabled by default. For this release, Oracle has explicitly enabled spinning in the environment scripts used to start
WebLogic Server. To enable spinning, use the following VM option:
Enable Spinning for IA32 Platforms
5.4.2 JRockit
6
6
Tuning WebLogic Diagnostic Framework
and JRockit Flight Recorder Integration
WebLogic Diagnostic Framework (WLDF) provides specific integration points with JRockit Mission Control Flight Recorder. WebLogic Server events are propagated to the Flight Recorder for inclusion in a common data set for runtime or post-incident analysis. See "Using WLDF with Oracle JRockit Flight Recorder" in Configuring and Using the Diagnostics Framework for Oracle WebLogic Server.
The following sections provide information on how to tune WLDF integration with JRockit Mission Control Flight Recorder:
■ Section 6.1, "Using JRockit Flight Recorder"
■ Section 6.2, "Using WLDF"
■ Chapter 6.3, "Tuning Considerations"
6.1 Using JRockit Flight Recorder
The version of Oracle JRockit that is provided with WebLogic Server includes a component called JRockit Flight Recorder (JFR), a performance monitoring and profiling tool that provides configuration options for controlling the events generated by the JVM. For more information about JFR, see "Introduction to the Flight Recorder" in Oracle JRockit JRockit Flight Recorder Run Time Guide.
You can enable JFR at runtime to take JRA recordings from the JRockit Management Console. You also have the option of turning off the JFR and recordings at the JRockit JVM level from the java command line using:
$ java -XX:-FlightRecorder
6.2 Using WLDF
WLDF provides the Diagnostic Volume attribute to set the amount of code coverage that is enabled and the amount of data provided in the events that are generated for the covered code. The volume can be adjusted using the WebLogic Console, see "Configure WLDF diagnostic volume" in Oracle WebLogic Server Administration Console Help. You can also set the volume using WLST. The following code example sets the volume to Medium:
Tuning Considerations
. . . connect() edit() startEdit()
cd("Servers/myserver") cd("ServerDiagnosticConfig") cd("myserver")
cmo.setWLDFDiagnosticVolume("Medium") save()
activate() . . .
JRockit and WLDF generate global events that contain information about the
recording settings even when disabled. For example, JVM Metadata events list active recordings and WLDF GlobalInformationEvents list the domain, server, machine, and volume level. You can use WLDF Image capture to capture JFR recordings along with other component information from WebLogic Server, such as configuration.
The Diagnostic Volume setting does not affect explicitly configured diagnostic modules. By default, the Diagnostic Volume is set to Low. By default the JRockit default recording is also Off. Setting the WLDF volume to Low or higher enables WLDF event generation and the JVM events which would have been included by default if the JRockit default recording were enabled separately. So if you turn the WLDF volume to Low, Medium, or High , you get WLDF events and JVM events recorded in the JFR , there is no need to separately enable the JRockit default recording.
6.2.1 Using JRockit controls outside of WLDF to control the default JVM recording
You can enable the JVM default recording (or another recording) and continue to generate JVM events regardless of the WLDF volume setting. This allows you to continue to generate JVM events when WLDF events are off.6.3 Tuning Considerations
In most environments, there is little performance impact when the Diagnostic Volume is set to Low and the most performance impact if Diagnostic Volume is set to High. The volume of diagnostic data produced by WebLogic Server needs to be weighed against potential performance loss.
7
7
Tuning WebLogic Server
The following sections describe how to tune WebLogic Server to match your application needs.
■ Section 7.1, "Setting Java Parameters for Starting WebLogic Server"
■ Section 7.2, "Development vs. Production Mode Default Tuning Values"
■ Section 7.4, "Thread Management"
■ Section 7.5, "Tuning Network I/O"
■ Section 7.6, "Setting Your Compiler Options"
■ Section 7.7, "Using WebLogic Server Clusters to Improve Performance"
■ Section 7.8, "Monitoring a WebLogic Server Domain"
■ Section 7.9, "Tuning Class and Resource Loading"
7.1 Setting Java Parameters for Starting WebLogic Server
Java parameters must be specified whenever you start WebLogic Server. For simple invocations, this can be done from the command line with the weblogic.Server command. However, because the arguments needed to start WebLogic Server from the command line can be lengthy and prone to error, Oracle recommends that you
incorporate the command into a script. To simply this process, you can modify the default values in the sample scripts that are provided with the WebLogic distribution to start WebLogic Server, as described in "Specifying Java Options for a WebLogic Server Instance" in Managing Server Startup and Shutdown for Oracle WebLogic Server. If you used the Configuration Wizard to create your domain, the WebLogic startup scripts are located in the domain-name directory where you specified your domain. By default, this directory is MW_HOME\user_projects\domain\domain-name, where MW_HOME is the Middleware Home directory containing the Oracle product
installation, and domain-name is the name of the domain directory defined by the selected configuration template.
You need to modify some default Java values in these scripts to fit your environment and applications. The important performance tuning parameters in these files are the JAVA_HOME parameter and the Java heap size parameters:
■ Change the value of the variable JAVA_HOME to the location of your JDK. For example:
Development vs. Production Mode Default Tuning Values
■ For higher performance throughput, set the minimum java heap size equal to the maximum heap size. For example:
"%JAVA_HOME%\bin\java" server –Xms512m –Xmx512m classpath %CLASSPATH%
-See Section 5.3.4, "Specifying Heap Size Values" for details about setting heap size options.
7.2 Development vs. Production Mode Default Tuning Values
You can indicate whether a domain is to be used in a development environment or a production environment. WebLogic Server uses different default values for various services depending on the type of environment you specify. Specify the startup mode for your domain as shown in the following table.
The following table lists the performance-related configuration parameters that differ when switching from development to production startup mode.
Table 7–1 Startup Modes
Choose this mode when . . .
Development You are creating your applications. In this mode, the
configuration of security is relatively relaxed, allowing you to auto-deploy applications.
Production Your application is running in its final form. In this mode, security is fully configured.
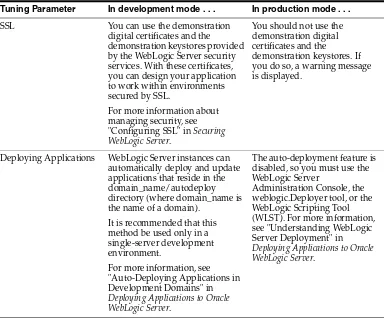
Table 7–2 Differences Between Development and Production Modes
Tuning Parameter In development mode . . . In production mode . . .
SSL You can use the demonstration digital certificates and the demonstration keystores provided by the WebLogic Server security services. With these certificates, you can design your application to work within environments secured by SSL.
For more information about managing security, see "Configuring SSL" in Securing WebLogic Server.
You should not use the demonstration digital certificates and the
demonstration keystores. If you do so, a warning message is displayed.
Deploying Applications WebLogic Server instances can automatically deploy and update applications that reside in the domain_name/autodeploy directory (where domain_name is the name of a domain).
Thread Management
For information on switching the startup mode from development to production, see "Change to Production Mode" in the Oracle WebLogic Server Administration Console Help.
7.3 Deployment
The following sections provide information on how to improve deployment performance:
■ Section 7.3.1, "On-demand Deployment of Internal Applications"
■ Section 7.3.2, "Use FastSwap Deployment to Minimize Redeployment Time"
■ Section 7.3.3, "Generic Overrides"
7.3.1 On-demand Deployment of Internal Applications
WebLogic Server deploys many internal applications during startup. Many of these internal applications are not needed by every user. You can configure WebLogic Server to wait and deploy these applications on the first access (on-demand) instead of always deploying them during server startup. This can conserve memory and CPU time during deployment as well as improving startup time and decreasing the base memory footprint for the server.
WebLogic Server deploys many internal applications during startup. Many of these internal applications are not needed by every user. You can configure WebLogic Server to wait and deploy these applications on the first access (on-demand) instead of always deploying them during server startup. This can conserve memory and CPU time during deployment as well as improving startup time and decreasing the base memory footprint for the server.For a development domain, the default is for WLS to deploy internal applications on-demand. For a production-mode domain, the default is for WLS to deploy internal applications as part of server startup. For more
information on how to use and configure this feature, see On-demand Deployment of Internal Applications in Deploying Applications to WebLogic Server.
7.3.2 Use FastSwap Deployment to Minimize Redeployment Time
In deployment mode, you can set WebLogic Server to redefine Java classes in-place without reloading the ClassLoader. This means that you do not have to wait for an application to redeploy and then navigate back to wherever you were in the Web page flow. Instead, you can make your changes, auto compile, and then see the effects immediately. For more information on how to use and configure this feature, see Using FastSwap Deployment to Minimize Redeployment in Deploying Applications to WebLogic Server.
7.3.3 Generic Overrides
Generic overrides allow you to override application specific property files without having to crack a jar file by placing application specific files to be overridden into the AppFileOverrides optional subdirectory. For more information on how to use and configure this feature, see Generic File Loading Overrides in Deploying Applications to WebLogic Server.
7.4 Thread Management
Thread Management
■ Section 7.4.1, "Tuning a Work Manager"
■ Section 7.4.4, "Tuning Execute Queues"
■ Section 7.4.5, "Understanding the Differences Between Work Managers and Execute Queues"
■ Section 7.4.7, "Tuning the Stuck Thread Detection Behavior"
7.4.1 Tuning a Work Manager
In this release, WebLogic Server allows you to configure how your application prioritizes the execution of its work. Based on rules you define and by monitoring actual runtime performance, WebLogic Server can optimize the performance of your application and maintain service level agreements (SLA).
You tune the thread utilization of a server instance by defining rules and constraints for your application by defining a Work Manger and applying it either globally to WebLogic Server domain or to a specific application component. The primary tuning considerations are:
■ Section 7.4.2, "How Many Work Managers are Needed?"
■ Section 7.4.3, "What are the SLA Requirements for Each Work Manager?"
See "Using Work Managers to Optimize Scheduled Work" in Configuring Server Environments for Oracle WebLogic Server.
7.4.2 How Many Work Managers are Needed?
Each distinct SLA requirement needs a unique work manager.
7.4.3 What are the SLA Requirements for Each Work Manager?
Service level agreement (SLA) requirements are defined by instances of request classes. A request class expresses a scheduling guideline that a server instance uses to allocate threads. See "Understanding Work Managers" in Configuring Server
Environments for Oracle WebLogic Server.
7.4.4 Tuning Execute Queues
In previous versions of WebLogic Server, processing was performed in multiple execute queues. Different classes of work were executed in different queues, based on priority and ordering requirements, and to avoid deadlocks. See Appendix A, "Using the WebLogic 8.1 Thread Pool Model.".
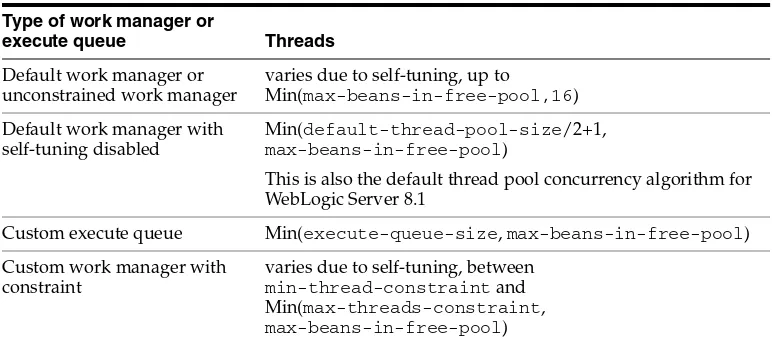
7.4.5 Understanding the Differences Between Work Managers and Execute Queues
The easiest way to conceptually visualize the difference between the execute queues of previous releases with work managers is to correlate execute queues (or rather,execute-queue managers) with work managers and decouple the one-to-one relationship between execute queues and thread-pools.
For releases prior to WebLogic Server 9.0, incoming requests are put into a default execute queue or a user-defined execute queue. Each execute queue has an associated execute queue manager that controls an exclusive, dedicated thread-pool with a fixed