Democratic Republic of Timor-Leste
Ministry of Finance
Executive Summary
The General Government of Timor-Leste (GGoTL) including the Petroleum Fund
(PF) is running a surplus of $554.4 million in the first quarter of 2014. However,
excluding the Petroleum Fund, the GGoTL is running a non-oil deficit of $71.7
million. Therefore although the GGoTL can sustain its current level of
operations, it is strongly reliant on oil revenues to achieve this.
Ministry of Finance Economic Policy Directorate
Quarterly Fiscal Bulletin
January
–
M arch 2014
Chart of Accounts (COA)
–
Fiscal Bulletin Q1 Page 2
1.
Overall Fiscal Position (Oil and Non-oil)
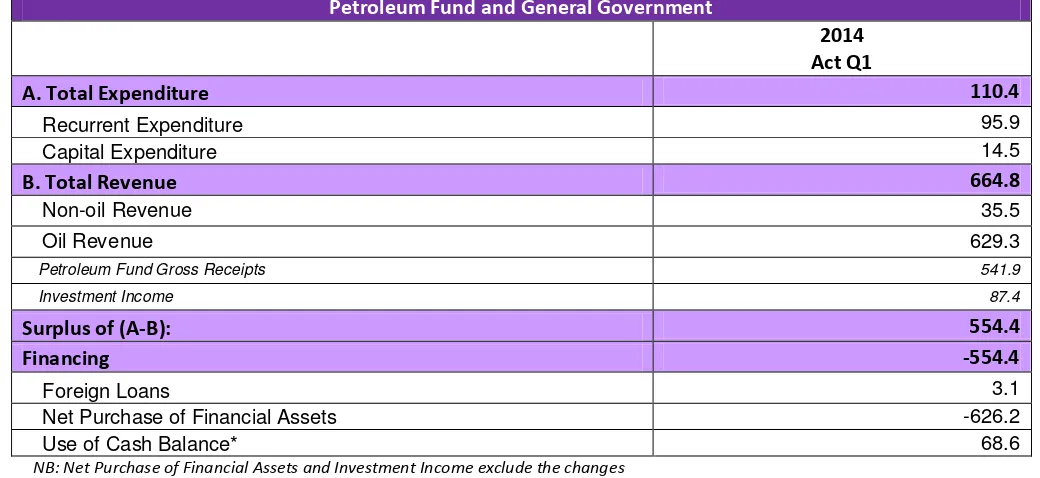
Table 1. Overall Fiscal Position
1By the 31st March 2014 total expenditures for GGoTL including the PF reached $110.4 million. This was divided into $95.9 million spent on recurrent expenditures and $14.5 million spent on capital expenditures2.
Total revenue was $664.8 million: $629.3 million of which were PF revenues and $35.5 million were non-oil revenues. PF revenues include PF gross receipts (taxes, royalties and first tranche petroleum) and investment income (dividends, interests and trust income, but exclude fair value gains and losses on profit/loss).3
Consequently the overall surplus was $554.4 million. This is calculated as total revenue minus total expenditure. A surplus means the GGoTL including the PF is in a strong fiscal position to make investments in financial assets.
The total purchase of financial assets in 2014 amounted to $626.2 million. $68.6 million was used from the
Gover e t’s ash ala e to fi a e the GGoTL non-oil deficit. This non-oil deficit is the result of non-oil revenues being higher than expenditures (which is normally financed through the use of the cash balance, withdrawals from the petroleum fund and loans). Furthermore it should be noted that this reduction in cash does not represent a deterioration in the overall financial position of the GGoTL, as it is outweighed by the increase in the purchase of financial assets in the PF.
1
All data in this document refers to unaudited accounts and is thus subject to change.
2
This includes expenditure from loans under capital and development.
3
The reason for excluding gains and losses on profit/loss and on exchange rates is due to these items being accrued but not cashed.
Net Purchase of Financial Assets -626.2
Use of Cash Balance* 68.6
NB: Net Purchase of Financial Assets and Investment Income exclude the changes in market value of financial assets in the Petroleum Fund.
*Use of Cash Balance refers to the Government Accounts only.
Fiscal Bulletin Q1 Page 3
2.
Ge eral Gover
e t’s
Fiscal Position
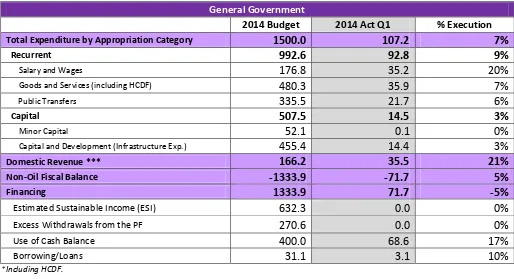
Table 2. Non-Oil Fiscal Position
General Government
2014 Budget 2014 Act Q1 % Execution
Total Expenditure by Appropriation Category
1500.0
107.2
7%
Recurrent
992.6
92.8
9%
As seen in Table 2, the GGoTL excluding the PF had a non-oil deficit of $71.7 million at the closing of the first quarter of 2014. This was financed through a combination of the use of the cash balance (totalling $68.6 million) and loans (totalling $3.1million), as no withdrawals from the PF were made during this quarter.
2.1 General Government Expenditures
Expenditures in the GGoTL reached $107.2 million at the end of the first quarter of 2014. This represented 7% of total budgeted expenditures for the year and was higher than the $84.8 million spent by the end of the first quarter of 2013.
2.1.2 Expenditure by Appropriation Category
Fiscal Bulletin Q1 Page 4
Recurrent expenditures are divided into:
Salary and Wages amounted to $35.2 million at the closing of the first quarter of 2014, which
represents 20% of the total budget for salary and wages. This is 15% higher than the $30.4 million incurred in the same period of 2013.
Fiscal Bulletin Q1 Page 5
By the end of the first quarter of 2014, total domestic non-oil revenues were $166.2 million. 21% of the total budgeted for 2014. This was divided into:
Tax Revenue, represented 72% of total non-oil revenue and is divided into:
Taxes on commodities reached $14.6 million at the closing of the first quarter of 2014. This was thus the
largest category of taxes and was 13% higher than the $12.9 million collected in 2013. This increase stems from an increase in excise tax and import duties collection.
Taxes on income were 49% higher than the $6.7 million collected in the first quarter 2013, totalling
$10.0 million at the end of 2014. Moreover by the 31st March 2014 taxes on income were 21% of the total annual budgeted.
Service tax totalled $0.9 million by the 31st March 2014. This was 34% higher than the $0.7 million
collected in the first quarter 2013. Moreover this category represented the highest execution rates, amounting to 23% of annual budgeted taxation rates.
At the closing of 2014, other non-tax revenue totalled $4.5 million. This was 20% of the total forecasted for the year and represented the smallest non-oil revenues category.
Revenue Retention Agencies recorded $5.5 million at end of the first quarter of 2014; 20% higher than was collected during the same period of 2013.