nutrition list:
Texture in semi-solid foods(ISBN 1 85573 673 X)
Understanding and controlling the texture of semi-solid foods such as yoghurt and ice cream is a complex process. With a distinguished international team of contributors, this important collection summarises some of the most important research in this area. The first part of the book looks at the behaviour of gels and emulsions, how they can be measured and their textural properties improved. The second part of the collection discusses the control of texture in particular foods such as yoghurt, ice cream, spreads and sauces.
Colour in food(ISBN 1 85573 590 3)
The colour of a food is central to consumer perceptions of quality. This important new collection reviews key issues in controlling colour quality in food, from the chemistry of colour in food to measurement issues, improving natural colour and the use of colourings to improve colour quality.
The nutrition handbook for food processors(ISBN 1 85573 464 8)
Over the past decade there has been an explosion of research on the relationship between nutrition and health. Given the current interest of consumers in more nutritious food, food processors are increasingly concerned with understanding the nature of nutrient loss during food processing. This new book brings together an international team of experts to summarise key findings on diet and nutrient intake, the impact of nutrients on health, and how food processing operations affect the nutritional quality of foods.
Details of these books and a complete list of Woodhead’s food science, technology and nutrition titles can be obtained by:
• visiting our web site at www.woodhead-publishing.com • contacting Customer Services (e-mail:
[email protected]; fax:+44 (0) 1223 893694; tel.:+44 (0) 1223 891358 ext. 30; address: Woodhead Publishing Ltd, Abington Hall, Abington, Cambridge CB1 6AH, England)
Selected food science and technology titles are also available in electronic form. Visit our web site (www.woodhead-publishing.com) to find out more.
Taints and off-flavours
in food
Edited by
Brian Baigrie
www.woodhead-publishing.com
Published in North America by CRC Press LLC, 2000 Corporate Blvd, NW Boca Raton FL 33431, USA
First published 2003, Woodhead Publishing Ltd and CRC Press LLC © 2003, Woodhead Published Ltd
The authors have asserted their moral rights.
This book contains information obtained from authentic and highly regarded sources. Reprinted material is quoted with permission, and sources are indicated. Reasonable efforts have been made to publish reliable data and information, but the authors and the publishers cannot assume responsibility for the validity of all materials. Neither the authors nor the publishers, nor anyone else associated with this publication, shall be liable for any loss, damage or liability directly or indirectly caused or alleged to be caused by this book. Neither this book nor any part may be reproduced or transmitted in any form or by any means, electronic or mechanical, including photocopying, microfilming and recording, or by any information storage or retrieval system, without permission in writing from the publishers.
The consent of Woodhead Publishing and CRC Press does not extend to copying for general distribution, for promotion, for creating new works, or for resale. Specific permission must be obtained in writing from Woodhead Publishing or CRC Press for such copying. Trademark notice: Product or corporate names may be trademarks or registered
trademarks, and are used only for identification and explanation, without intent to infringe. British Library Cataloguing in Publication Data
A catalogue record for this book is available from the British Library. Library of Congress Cataloging in Publication Data
A catalog record for this book is available from the Library of Congress. Woodhead Publishing ISBN 1 85573 449 4 (book) 1 85573 697 7 (e-book) CRC Press ISBN 0-8493-1744-4
CRC Press order number: WP1744
List of contributors. . . viii
1 Introduction. . . 1
B. Baigrie, Reading Scientific Services Ltd, UK 1.1 Defining off-flavours and taints . . . 1
1.2 The structure of this book . . . 3
1.3 References . . . 4
2 Sensory analytical methods in detecting taints and off-flavours in food. . . 5
D. Kilcast, Leatherhead Food International, UK 2.1 Introduction . . . 5
2.2 Sensory test procedures . . . 10
2.3 Types of test: difference/discrimination tests . . . 14
2.4 Types of test: quantitative and hedonic tests . . . 16
2.5 Data handling, analysis and presentation. . . 20
2.6 Choosing and interpreting sensory tests . . . 20
2.7 Applications of sensory testing . . . 23
2.8 Standardisation of test methods and instrumental methods . . 26
2.9 Ethical aspects . . . 28
2.10 Future trends . . . 28
2.11 References . . . 29
3 Instrumental methods in detecting taints and off-flavours. . . 31
3.2 Liquid-based extraction techniques . . . 32
3.3 Headspace extraction. . . 37
3.4 Solid phase microextraction (SPME). . . 40
3.5 Gas chromatography and other methods. . . 42
3.6 Stir-bar sorptive extraction . . . 47
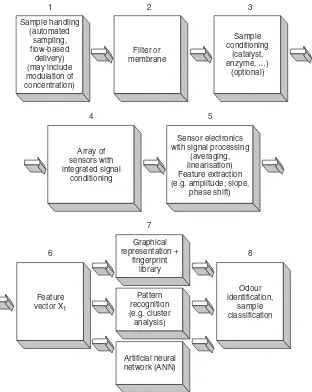
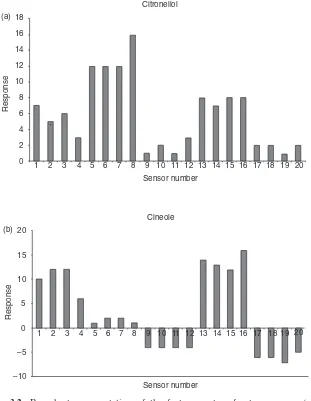
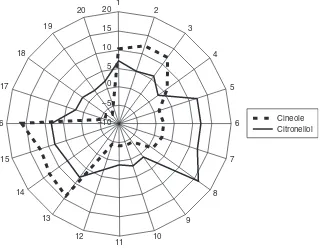
3.7 Electronic noses . . . 48
3.8 References . . . 54
4 Packaging materials as a source of taints. . . 64
T. Lord, Pira International, UK 4.1 Introduction . . . 64
4.2 Main types of food packaging . . . 66
4.3 Sources of taints. . . 70
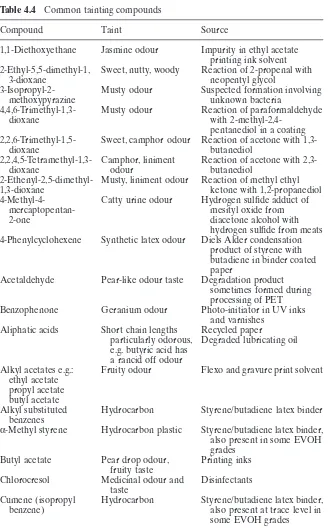
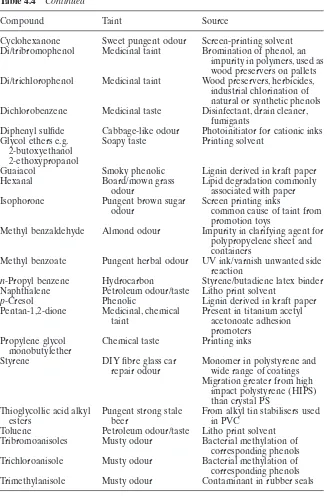
4.4 Chemicals responsible for taints . . . 75
4.5 Main foodstuffs affected . . . 78
4.6 Instrumental analysis of taints . . . 80
4.7 Sample preparation techniques . . . 81
4.8 Sampling strategy . . . 88
4.9 Examples of taint investigations . . . 88
4.10 Preventing taints . . . 101
4.11 Developments in taint monitoring: electronic noses . . . 104
4.12 Tracing the cause of a packaging taint . . . 106
4.13 Future packaging trends affecting taints . . . 107
4.14 Sources of further information and advice. . . 108
4.15 References . . . 109
5 Microbiologically derived off-flavours. . . 112
F. B. Whitfield, Food Science Australia, Australia 5.1 Introduction . . . 112
5.2 Bacteria . . . 113
5.3 Aerobic bacteria. . . 117
5.4 Facultative anaerobic bacteria . . . 125
5.5 Anaerobic bacteria. . . 128
5.6 Actinomycetes . . . 129
5.7 Fungi . . . 130
5.8 Future trends . . . 135
5.9 References . . . 136
6 Oxidative rancidity as a source of off-flavours. . . 140
R. J. Hamilton, formerly of Liverpool John Moores University, UK 6.1 Introduction . . . 140
6.2 Oxidation . . . 142
6.3 Autoxidation . . . 143
6.4 Photo-oxidation . . . 146
6.6 Ketonic rancidity and metal-catalysed lipid oxidation . . . 151
6.7 Off-flavours from volatile lipid molecules . . . 152
6.8 Case study: lipid autoxidation and meat flavour deterioration. . . 153
6.9 Case study: lipid oxidation in fish. . . 156
6.10 Conclusions: preventing off-flavours . . . 157
6.11 Sources of further information and advice. . . 158
6.12 References . . . 158
7 The Maillard reaction as a source of off-flavours . . . 162
A. Arnoldi, University of Milan, Italy 7.1 Introduction . . . 162
7.2 Mechanism of the Maillard reaction . . . 163
7.3 Relevant Maillard reaction products (MRPs) in food flavour . . . 166
7.4 Food staling and off-flavours in particular foods . . . 170
7.5 References . . . 173
8 Off-flavours due to interactions between food components . . . 176
E. Spinnler, INRA, France 8.1 Introduction . . . 176
8.2 Flavour compound volatility in different food matrices . . . . 176
8.3 Flavour retention in different food matrices . . . 180
8.4 Off-flavours caused by reactions between components in the food matrix . . . 181
8.5 Bacterial interactions with the food matrix causing off-flavours . . . 182
8.6 Bacterial interactions with additives causing off-flavours . . . 183
8.7 Conclusion: identifying and preventing off-flavours. . . 184
8.8 References . . . 186
9 Taints from cleaning and disinfecting agents. . . 189
C. Olieman, NIZO food research, The Netherlands 9.1 Introduction . . . 189
9.2 Cleaning and disinfecting agents . . . 190
9.3 Testing the safety of cleaning and disinfecting agents . . . 192
9.4 Testing cleaning and disinfecting agents for their capacity to cause taints. . . 193
9.5 Detecting cleaning and disinfecting agents in rinse water . . . 193
9.6 Detecting cleaning and disinfecting agents in food . . . 194
9.7 Measurement of active chlorine residues via chloroform . . . 195
9.8 Future trends . . . 197
9.9 References . . . 197
Chapter 1
B. Baigrie
Reading Scientific Services Limited Lord Zuckerman Research Centre Whiteknights
PO Box 234 Reading RG6 6LA UK
Tel:+44 (0) 118 9868541
Fax:+44 (0) 118 9868932
E-mail: [email protected]
Chapter 2
D. Kilcast
Leatherhead Food International Randalls Road
Leatherhead Surrey KT22 7RY UK
Tel:+44 (0) 1372 822321
Fax:+44 (0) 1372 836228
E-mail: [email protected]
Chapter 3
W. J. Reid
Leatherhead Food International Randalls Road
Leatherhead Surrey KT22 7RY UK
Tel:+44 (0) 1372 822213
Fax:+44 (0) 1372 836228
E-mail: [email protected]
Chapter 4
T. Lord
Pira International Randalls Road Leatherhead Surrey KT22 7RU UK
Tel:+44 (0) 1372 802000
Fax:+44 (0) 1372 802238
Chapter 5
F. B. Whitfield
Food Science Australia 16 Julius Avenue
Riverside Corporate Park Delhi Road (PO Box 52) North Ryde
NSW 1670 Australia
Tel:+61 2 9490 8333
Fax:+61 2 9490 8499
E-mail: frank.whitfield@foodscience. afisc.csiro.au
Chapter 6
R. J. Hamilton
Formerly of Liverpool John Moores University
10 Norris Way Formby L37 8DB UK
Tel:+44 (0) 1704 877572
Fax:+44 (0) 1704 877572
Chapter 7
A. Arnoldi DISMA
University of Milan Via Celoria 2 20133 Milano Italy
Tel:+39 02 503 16806
Fax:+39 02 503 16801
E-mail: [email protected]
Chapter 8
E. Spinnler
GER de Technologies et Procedes Ali-mentaires
CBAI INA-PG 78850 Thiverval France
Tel: 01 30 81 53 87 Fax: 01 30 81 55 97
E-mail: [email protected]
Chapter 9
C. Olieman
NIZO food research 2 Kernhemseweg PO Box 20 6710 BA Ede The Netherlands
Tel:+31 318 659 511
Fax:+31 318 650 400
Introduction
B. Baigrie, Reading Scientific Services Ltd, UK
1.1
Defining off-flavours and taints
Flavour is one of the most important sensory qualities of a food. Whilst the appearance and colour of a food provide the first indicator of quality, its flavour and texture are critical in confirming or undermining that initial impression (Cardello, 1994). The flavour of a food is determined by a complex mix of taste, aroma, chemical response and texture (Meilgaard et al., 1999). Taste is the response of the taste buds on the tongue to par-ticular soluble, involatile materials which trigger a range of basic taste sen-sations (variously categorised as sweet, sour, salty, bitter and umami).Aroma is the response of the olfactory epithelium in the roof of the nasal cavity to volatiles entering the nasal passage. The trigeminal nerve also responds to certain chemical irritants which may give a heating or cooling response. Finally, the texture of a food and the way it breaks down in the mouth deter-mine how tastants, odorants and trigeminal stimulants are released. More-over, the appearance and colour of the food, the physical perception of its texture and the sounds produced by the chewing of the food, will also affect how flavour is perceived and interpreted (Lawless and Heymann, 1998). Finally, factors such as genetic differences and individual experience also play a role in what we perceive and how we respond to that perception.
• Taint:an atypical odour or taste resulting from internal deterioration in the food
• Off-flavour:an atypical odour or taste caused by contamination by a chemical foreign to the food.
Off-flavours and taints can be triggered by the involatiles detected by taste, but the main chemicals involved are the volatiles involved in odour response. Whilst there is a relatively small range of involatile tastants and trigeminal stimulants, over 200 individual odour qualities have been iden-tified. Odours and aromas are usually composed of hundreds of compounds carried in an air stream which itself contains many other compounds. Since there are an estimated 1000 olfactory receptor genes influencing an indi-vidual’s perception of odours, making it possible for the human nose to detect very low concentrations of some of these compounds (below 0.01 parts per billion), identifying an off-flavour or taint can be a particularly challenging process.
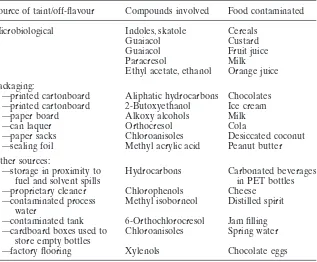
Off-flavours and taints can occur in many types of food for a variety of reasons. Table 1.1 illustrates the nature of the problem by showing, on the one hand, examples of microbiologically derived off-flavours and, on the
Table 1.1 Examples of sources of taints and off-flavours (source: Reading Scientific Services Ltd)
Source of taint/off-flavour Compounds involved Food contaminated
Microbiological Indoles, skatole Cereals
Guaiacol Custard
Guaiacol Fruit juice
Paracresol Milk
Ethyl acetate, ethanol Orange juice
Packaging:
—printed cartonboard Aliphatic hydrocarbons Chocolates
—printed cartonboard 2-Butoxyethanol Ice cream
—paper board Alkoxy alcohols Milk
—can laquer Orthocresol Cola
—paper sacks Chloroanisoles Desiccated coconut
—sealing foil Methyl acrylic acid Peanut butter
Other sources:
—storage in proximity to Hydrocarbons Carbonated beverages
fuel and solvent spills in PET bottles
—proprietary cleaner Chlorophenols Cheese
—contaminated process Methyl isoborneol Distilled spirit
water
—contaminated tank 6-Orthochlorocresol Jam filling
—cardboard boxes used to Chloroanisoles Spring water
store empty bottles
other, taints caused by a variety of contaminants. Table 1.2 shows some of the foodstuffs most commonly affected by taints. Whatever the cause, the occurrence of a taint and off-flavour problem can prove to be extremely costly for a food manufacturer. In addition to the direct costs of a product recall, lost revenue and production downtime, there may be even more serious consequences in terms of litigation, adverse publicity, lower sales and a damaged brand image. Understanding the nature and causes of taints and off-flavours, and developing appropriate means of identifying them so that they can be either prevented or identified rapidly, remain major preoccupations of the food industry. These are also the themes of this book.
1.2
The structure of this book
Since the processes involved in flavour perception are so complex, the first stage in the analysis of a taint is usually sensory evaluation of the affected product using a panel of experts trained in detecting and describing taints. The ability of panellists to describe accurately the sensory properties of taints and to relate them to known standards, is particularly useful in providing information about the chemical nature of the taint and in sug-gesting avenues for subsequent instrumental analysis. Chapter 2 reviews sensory methods in detecting and analysing taints and off-flavours in food, looking, in particular, at the various types of test available, and how to choose between them and interpret the results. After sensory evaluation, a concentrated flavour extract is prepared from the tainted product and then fractionated into individual compounds which can be analysed and identi-fied. Chapter 3 looks at the range of extraction techniques and the use of gas chromatography to fractionate and identify tainting compounds. It also considers new instrumental techniques such as stir-bar sorptive extraction and, in particular, the development of electronic noses.
Table 1.2 Foodstuffs affected by taints (source: PIRA)
Foodstuff %
Sweets 30
Cakes and biscuits 20
Beverages 15
Bread/pizza 10
Soups 5
Alcoholic drinks 5
Cheese 5
Crisps 5
The following group of chapters then look at some of the main causes of taints and off-flavours. Chapter 4 reviews the most important single cause of taints in food: packaging. It also builds on the previous chapters by looking in detail at how packaging taints are identified in practice as well as how they can be prevented. Chapter 5 discusses microbiologically derived off-flavours and the range of bacteria, fungi and yeasts responsible, the foods they affect and the particular off-flavours produced.Together with microbiological spoilage, oxidative rancidity is one of the principal causes of off-flavours and is discussed in Chapter 6. Chapter 7 then reviews another important process: the influence of the Maillard reaction.
1.3
References
british standards institution (1992), BS 5098 (ISO 6658): ‘Glossary of terms relating to sensory analysis’.
cardello a v(1994), ‘Consumer expectations and their role in food acceptance’, in MacFie H and Thomson D (eds),Measurement of Food Preferences, Blackie Academic and Professional, London.
lawless h and heymann h (1998), Sensory Evaluation of Food: Principles and Practice, Chapman and Hall, London.
Sensory analytical methods in detecting
taints and off-flavours in food
D. Kilcast, Leatherhead Food International, UK
2.1
Introduction
In the increasingly affluent societies of the developed countries, consumers expect a wide choice of food that is safe, enjoyable to eat, nutritious and of consistent quality. If food falls short of these criteria, there is sufficient choice in a commercially competitive environment for consumers to change their allegiances and find alternative products. Provided that their food is safe, consumers will view taste or flavour as the most important quality attribute. In particular, they will not tolerate flavours, commonly called taints or off-flavours, that are foreign to that product.
In common usage, the word ‘taint’ inevitably implies something that is unpleasant and undesirable. Within the context of food, definitions become more precise. The definition of taint (BSI, 1992) accepted in Standards is a taste or odour foreign to the product. This Standard also distinguishes an off-flavour as an atypical flavour usually associated with deterioration. These definitions are characterised by an important distinction from dic-tionary definitions: food taints are perceived by the human senses. This does not diminish the undesirable nature of chemical contamination of foods, but focuses on those contaminants that can be perceived, particularly by their odour or flavour, and which can be perceived at extremely low con-centrations, for example parts per million (ppm), 106, parts per billion (ppb),
109, or even parts per trillion (ppt), 1012. One important aspect of the
• Taints:unpleasant odours or flavours imparted to food through exter-nal sources.
• Off-flavours: unpleasant odours or flavours imparted to food through internal deteriorative change.
Although the two types of taint can render food equally unpleasant, this distinction is of great assistance in identifying the cause of taint problems. The difficulties in identifying taint problems result from a number of sources. First, consumer descriptions of taint are, with a few exceptions, notoriously unreliable, partly because of a lack of any training in analytical descriptive methods but mainly because of unfamiliarity with the chemical species responsible for taint. One notable exception is taint resulting from chlorophenol contamination, which is reliably described as antiseptic, ‘TCP’ or medicinal, this reliability being a consequence of consumer familiarity with products characterised by these sensations. Second, the extremely low concentrations that can give rise to taint present immense difficulties for the analyst who tries to identify the chemical nature of the taint. Third, taint can occur at all stages of the food manufacture and supply chain, and from many different sources at each stage. Consequently, the detective work needed to identify the cause of taint-oriented consumer complaints can be quite different for taints than for off-flavours.
The highly unpleasant nature of food taints can generate severe problems for retailer, producer, ingredients supplier, farmer, equipment supplier and even building contractor. These problems can include lost production, lost sales, lost consumer confidence, damaged brand image, damaged commercial relationships between supplier, manufacturer and retailer, and expensive litigation proceedings. Food manufacturers readily understand the financial implications of a day’s defective production, but not the more widespread implication of tainted production; for example, the tainted production will not be reworkable and the plant may suffer from extended shut-down whilst defective building materials are replaced. In addition, identifying the source of a taint can be time consuming and expensive.
The principal difficulty in protecting against taint is the extremely low levels of contamination that can give rise to unpleasant characteristics. Examples of the low concentrations at which the most commonly encoun-tered tainting materials (halophenols and haloanisoles) can be perceived are shown in Table 2.1.
2.1.1 The human senses
the standard sensory texts, for example Hutchings (1994), Lawless and Heymann (1998), Meilgaard et al. (1999), Piggott (1988) and Rosenthal (1999).
The visual senses are of particular importance in generating an initial impression of food quality that often precedes the input from the remain-ing senses. If the appearance of the food creates a negative impact, then the other senses might not come into play at all. The visual sense is often related only to colour, but provides input on many more appearance attributes that can influence food choice. In particular, the visual senses can provide an early and strong expectation of the flavour and textural properties of foods.
Taste (gustation) is strictly defined as the response by the tongue to soluble, involatile materials. These have classically been defined as four primary basic taste sensations: salt, sweet, sour and bitter, although in some countries this list is extended to include sensations such as metallic, astrin-gency and umami, this last sensation being associated with monosodium glutamate. The taste receptors are organised groups of cells, known as taste buds, located within specialised structures called papillae. These are located
Table 2.1 Taste thresholds (in water) of halophenols and haloanisoles
Compound Parts per billion (109)
2-Chlorophenol 0.1
2-Bromophenol 0.03
2,6-Dichlorophenol 0.3
2,6-Dichloroanisole 0.04 (odour)
2,6-Dibromophenol 5¥10-4
2,4,6-Trichlorophenol 2
2,4,6-Trichloroanisole 0.02
2,4,6-Tribromophenol 0.6
2,4,6-Tribromoanisole 8¥10-6(odour)
Table 2.2 The human senses
Sense Perception
Vision Appearance
Gustation Taste
Olfaction Odour/aroma Flavour
Chemical/trigeminal Irritant
Touch Texture
mainly on the tip, sides and rear upper surface of the tongue. Sweetness is detected primarily on the tip of the tongue, salt and sour on the sides of the tongue, and bitter on the rear of the tongue. Taste stimuli are characterised by the relatively narrow range between the weakest and the strongest stim-ulants (ca. 104) and are strongly influenced by factors such as temperature
and pH.
The odour response is much more complex. Odours are detected as volatiles entering the nasal passage, either directly via the nose or indirectly through the retronasal path via the mouth. The odorants are sensed by the olfactory epithelium, which is located in the roof of the nasal cavity. Some 150–200 odour qualities have been recognised. There is a very wide range (ca. 1012) between the weakest and the strongest stimulants. The odour
receptors are easily saturated and specific anosmia (blindness to specific odours) is common. It is thought that the wide range of possible odour responses contributes to variety in flavour perception. Both taste and odour stimuli can be detected only if they are released effectively from the food matrix during the course of mastication.
The chemical sense corresponds to a pain response through stimulation of the trigeminal nerve. This is produced by chemical irritants such as ginger and capsaicin (from chilli), both of which give a heat response, and chemi-cals such as menthol and sorbitol, which give a cooling response. With the exception of capsaicin, these stimulants are characterised by high thresh-olds. The combined effect of the taste, odour and chemical responses gives rise to the sensation generally perceived as flavour, although these terms are often used loosely.
Texture is perceived by the sense of touch and comprises two compo-nents: somesthesis, a tactile, surface response from skin, and kinesthesis (or proprioception), which is a deep response from muscles and tendons For many foods, visual stimuli will generate an expectation of textural prop-erties. The touch stimuli themselves can arise from tactile manipulation of the food with the hands and fingers, either directly or through the inter-mediary of utensils such as a knife or spoon. Oral contact with food can occur through the lips, tongue, palate and teeth, all of which provide tex-tural information (Meilgaard et al., 1999). The texture of products such as snack foods and hard fruits is also influenced by sounds emitted during mastication.
odorants and trigeminal stimulants are released from the food. The chemical species that give rise to taint can fall into each of these three classes, but the main species giving rise to taint are volatile materials exem-plified by those compounds shown in Table 2.1. However, bitter compounds also give rise to the perception of taints and off-flavours. These are fre-quently water-soluble involatile materials that are detected by the sense of taste.
The complex nature of food quality perception creates many difficulties for the sensory analyst, whose primary task is to use human subjects as an instrument to measure the sensory quality of foods. The perceptual processes described above are determined by physiological responses to stimuli, but when using human subjects for sensory analysis, psychological aspects must also be considered. The factors that should be considered in assessing the performance of human subjects in this way are accuracy, precision and validity (Piggott, 1995). Sensory measurements are a direct measure of human response. They have an inherently higher validity than instrumental measures, which are nonetheless of value as a complement to sensory data, for example in shelf-life assessment. In measuring human responses, low precision must be expected, but variation can be reduced by careful selection of a range of human subjects who can produce a response with lower variability, and by extensive training.
Improving accuracy (giving the correct answer without systematic error or bias) can be achieved by recognising the various sources of physiologi-cal and psychologiphysiologi-cal biases that can influence human subjects. The effect of physiological differences between individuals can be reduced, but not completely eliminated, by careful selection procedures. Psychological factors can introduce systematic biases that might not be recognised. These include those arising from unwanted interaction between panellists, and those from more subtle sources. These can be greatly reduced by choice of sensory test procedure and by careful experimental design and operation of sensory test procedure.
Appearance Sound
Texture Flavour
2.1.2 Thresholds
A common means of quantifying response to chemical stimuli is through the use of a threshold, commonly defined as the concentration in a speci-fied medium that is detected by 50% of a specispeci-fied population. This definition is widely used in describing sensory perception of stimuli, but unfortunately is frequently misused and misunderstood. Thresholds indi-cate the level of stimulus that is sufficient to trigger perception but, con-trary to common usage, a number of thresholds can be defined, none of which is invariant. Standards give the following definitions for thresholds relevant to taint testing (BSI, 1992):
• Detection threshold:the lowest physical intensity at which a stimulus is perceptible
• Recognition threshold:the lowest physical intensity at which a stimulus is correctly identified.
In dealing with taints, we are generally concerned with detection thresh-olds, but usually literature data do not define whether detection or recog-nition thresholds are being quoted. Literature data also frequently fail to cite the methodological variables, such as number of test subjects, degree of experience of test subjects, nature of instructions to test subjects, test pro-cedure and whether replicated, and details of any statistical analysis. These omissions may serve to explain the wide range of numerical values found by different researchers for the same thresholds.
Even if threshold measurements utilised the same test methodologies and exercised careful control over experimental variables, variations in measured thresholds must be expected as a result of the enormous range of human sensitivities. Measurements should therefore use as many human subjects as possible and should also include provision for repeat testing, since subject performance improves with practice. The medium in which the stimulus is present has a substantial effect on the measured thresholds, through masking effects from other flavours and from the different rate and extent of release that can occur.
2.2
Sensory test procedures
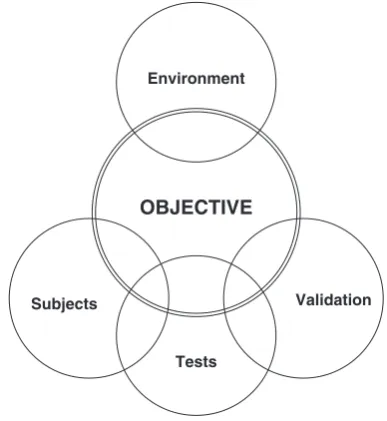
Any high-quality sensory evaluation system needs to satisfy a number of inter-related requirements. These are discussed below and more detailed discussions can be found in standard texts (e.g. Piggott, 1988; Meilgaard et al., 1999; Stone and Sidel, 1993; Lawless and Heymann, 1998). The requirements are shown schematically in Fig. 2.2.
2.2.1 Objectives
the required precision and that will be cost-effective. Testing for taint is most appropriately carried out as part of a quality control function, although some companies (for example, suppliers of packaging to the food industry) may need to carry out research investigations. The objectives of the system will then be defined by the quality procedures operated by the company.
2.2.2 Test environment
A suitable environment is essential for generating high-quality sensory data with minimal bias. The environment is important not only in providing stan-dardised working conditions for the assessors, but also in providing a work area for sample preparation and for data analysis. Detailed advice is given in a number of publications (e.g. Stone and Sidel, 1993; BSI, 1989).The three main components of a sensory evaluation environment are:
• a preparation area of adequate size and appropriately equipped • a testing environment, adjacent to, but separated from, the preparation
area
• individual booths to eliminate assessor interaction.
2.2.3 Type of test and test subjects
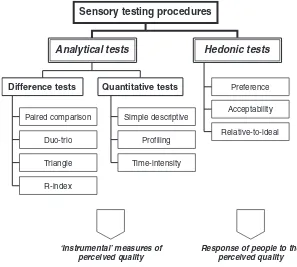
Many sensory test methodologies are available, but fall into two main classes, shown schematically in Fig. 2.3:
Subjects Validation
Tests Environment
OBJECTIVE
• Analytical tests.These tests are used to measure sensory characteristics of products by providing answers to the questions:
– is there a difference?
– what is the nature of the difference(s)? – how big is (are) the difference(s)?
• Hedonic/affective tests. These tests are used to measure consumer response to sensory characteristics of the products by providing answers to the questions:
– which product is preferred? – how much is it liked?
The two classes comprise tests that satisfy completely different objectives and which are subject to different operating principles. Analytical tests use human subjects as a form of instrument to measure properties of the food. Hedonic tests measure the response of consumer populations to the food in terms of likes or dislikes. Different psychological processes are used for each type of test. In general there is no simple linear relationship between the two types of data. It is of great practical importance that the type and
Paired comparison Simple descriptive
Quantitative tests Difference tests
Analytical tests
Sensory testing procedures
Relative-to-ideal Acceptability
Preference
Time-intensity
Response of people to the perceived quality ‘Instrumental’ measures of
perceived quality
Profiling Duo-trio
Triangle
R-index
Hedonic tests
numbers of subjects used for the analytical and hedonic tests are quite different.
The subjects to be used are defined by the objective of the test and by the consequential choice of test. The numbers of subjects to be used depend on the level of expertise and training of the assessors. Recommended minimum numbers are give in BS 5929 Part 1, 1986 (ISO 6658) (BSI, 1986), which also discriminates between assessors, selected assessors and experts.
2.2.4 Analytical tests
Both discriminative and descriptive tests use small panels of assessors chosen for their abilities to carry out the tests. Guidelines for establishing such assessors are given in BS 7667 Part 1, 1993 (ISO 8586-1) (BSI, 1993). A general scheme for establishing a panel requires the following steps:
• Recruitment. Panellists can be recruited from within the company, or dedicated part-time panellists can be recruited from the local popula-tion (company employees should not be compelled to participate). • Screening. These preliminary tests are used to establish that sensory
impairment is absent, to establish sensitivity to appropriate stimuli and to evaluate the ability to verbalise and communicate responses. These tests will depend mainly on the defined objectives of the sensory testing, but will typically consist of the following:
– the ability to detect and describe the four basic tastes: sweet, sour, salt and bitter; these may be extended to cover metallic, umami and astringent.
– the ability to detect and recognise common odorants, together with those characteristic of the product range of interest.
– the ability to order correctly increasing intensities of a specific stim-ulus, for example increasing sweetness or increasing firmness. – the ability to describe textural terms characteristic of relevant food
types.
– absence of colour vision deficiencies, (approximately 8% men, but only 0.4% women suffer colour vision deficiencies), tests can be carried out using Ishihara charts (available from opticians or booksellers).
Selection of suitable panellists is usually made on the basis of a good performance across the entire range of tests, rather than excellence in some and poor response to others. If the panel is to be used for a spe-cific purpose, then the tests relevant to that purpose can be weighted appropriately.
• Monitoring. Close monitoring of panel performance is essential and any drift that is identified must be corrected by retraining procedures.
2.2.5 Hedonic tests
Subjects (respondents) for hedonic tests are chosen to represent the target consumer population and to reflect any inhomogeneity in that population. Consequently, they need to be used in sufficient numbers to give statistical confidence that they are representative. They must be given the opportu-nity to behave as they would in a real consumption environment. In par-ticular, they must not be selected on the basis of sensory ability and must not be given any training. Numbers in excess of 100 respondents are nor-mally used. For the early stages of concept development, qualitative studies using focus groups with small numbers of respondents can be used, but the data generated should be treated carefully and conclusions must not be gen-eralised. The same subjects must not be used for both types of test and, in particular, in-house staff must not be used to generate hedonic data that may be viewed as consumer related.
2.3
Types of test: difference/discrimination tests
Difference or discrimination tests are perceived as one of the easiest classes of sensory testing to apply in an industrial environment and are conse-quently heavily used. The tests can be used in two ways, either to determine whether there is an overall difference between two samples or to determine whether one sample has more or less of a specific attribute than another. The tests have limited information content and can be unwieldy when many product comparisons are to be made. In such circumstances, alternative methods, such as profiling, are often superior, but the high sensitivity of well-designed difference tests can offer the best protection against taint problems. Difference tests are almost universally used to ascertain whether two samples are different, not to ascertain whether two samples are the same. It should be noted that, if a difference is not found, it does not prove that samples are the same. However, future revisions of ISO standards will advise sensory analysts on how to use the tests for the latter purpose.
2.3.1 Paired comparison test
make a guess, or they may be allowed to record a ‘no-difference’ response. In the directional form test (less commonly referred to as the 2-AFC (alternative forced choice) test), it is important that the panellists clearly comprehend the nature of the attribute of interest. It can be argued that if time is needed to train panellists to recognise a specific characteristic, a descriptive test should have been selected.
2.3.2 Duo–trio test
In the most common variant of the duo–trio test, the panellists are presented with a sample that is identified as a reference, followed by two coded samples, one of which is the same as the reference and the other different. These coded samples are presented in a balanced presentation order, i.e.
A(reference) A B A(reference) B A
The panellists are asked to identify which sample is the same as the reference. The duo–trio test is particularly useful when testing foods that are difficult to prepare in identical portions. Testing such heterogeneous foods using the triangle test, which relies on identical portions, can give rise to difficulties, but in the duo–trio test there are no inherent diffi-culties in asking the question ‘Which sample is most similar to the reference?’.
2.3.3 Triangle test
Three coded samples are presented to the panellists, two of which are identical, using all possible sample permutations, i.e.
ABB AAB
BAB ABA
BBA BAA
The panellists are asked to select the odd sample in either fixed-choice (pre-ferred) or no-difference procedures. The increased number of samples com-pared with a paired comparison test can result in problems with flavour carry-over when using strongly flavoured samples, making identification of the odd sample more difficult. Difficulties can also be encountered in ensur-ing presentation of identical samples of some foods.
2.3.4 3-AFC (alternative forced choice) test
panellists identify the nature of any difference in advance. In the test itself, the panellists are then asked to identify the sample (or samples) with the specified characteristic. For example, a typical instruction might be ‘One of these samples is more bitter than the others; please identify this sample’. O’Mahony (1995) has identified the reasons why this test can be more sen-sitive than the triangle test, but the test suffers from the need to identify the nature of the difference positively in advance.
2.3.5 R-index test
The short-cut signal-detection method of the R-index test is a relatively recent development (O’Mahony, 1979; 1986) and is less well used, but an application to taint testing has been described (Linssen et al., 1991). The test samples are compared against a previously presented standard and rated in one of four categories. For difference testing, these categories are standard, perhaps standard, perhaps not standard and not standard. The test can also be carried out as a recognition test, in which case the categories are standard recognised, perhaps standard recognised, perhaps standard not recognised and standard not recognised. The results are expressed in terms of R-indices, which represent probability values of correct discrimination or correct identification. The method is claimed to give some quantification of magnitude of difference, but its use has not been widely reported in the literature. One important limitation is that a relatively high number of judgements is needed in this form of test, leading to the risk of severe panellist fatigue, and in the case of some important taints, severe sensory adaptation that can result in non-identification.
2.3.6 Difference from control test
The test is of particular value when a control is available; the panellists are presented with an identified control and a range of test samples. They are asked to rate the samples on suitable scales anchored by the points ‘not different from control’ to ‘very different from control’. The test results are usually analysed as scaled data.
2.4
Types of test: quantitative and hedonic tests
2.4.1 Scaling procedures
Quantification of sensory data is needed in many applications. The record-ing of perceived intensity of attributes or likrecord-ing requires some form of scaling procedure. These procedures should be distinguished from quality grading systems, which are used to sort products into classes defined by a combination of sensory characteristics. Such systems are not open to quan-titative numerical analysis. Scaling procedures are mainly used to generate numeric data that can be manipulated and analysed statistically. Before this can be carried out, however, thought must be given to how the scales used are seen and interpreted by the assessors and how this may influence the type of analysis that can be safely applied. The different types of scale used are described below:
• Category scalesuse a defined number of boxes or categories (often 5, 7 or 9, although other numbers are sometimes used). The scale ends are defined by verbal anchors and intermediate scale points can be given verbal descriptions.
• Graphic scales (line scales)consist of a horizontal or vertical line with a minimum number of verbal anchors, usually at the ends. Other anchors can be used, for example, to define a central point, or to denote the posi-tion of a reference sample.
• Unipolar scaleshave a zero at one end and are most commonly used in profiling, especially for flavour attributes.
• Bipolar scaleshave opposite attributes at either end. Definition of the central point can often give rise to logical difficulties, as can ensuring that the extreme anchors are true opposites. This can be a particular problem for textural attributes, for example, when using ‘soft’ to ‘hard’ type scales. Bipolar scales are frequently used for consumer acceptabil-ity testing, especially using the ‘like extremely’ to ‘dislike extremely’ format.
• Hedonic scalesare used to measure consumer liking or acceptability. Category scales are usually used.
• Relative to ideal scales are a type of hedonic scale, which measures deviation from a personal ideal point.
The type of scale used and its construction depend on a number of factors:
• Purpose of test. Both category and graphic scales are commonly used with trained panels. In consumer testing, category scaling methods are usually used.
inexperienced assessors or consumers, scales incorporating a ‘neutral point’, such as the central point in an odd-numbered category scale, are sometimes avoided in order to minimise the risk of ‘fence-sitting’. • Number of assessors. Using small assessor numbers with a low number
of category scale points will limit statistical analysis options.
• Data-handling facilities.Category scaling responses can be entered rel-atively quickly onto a spreadsheet, whereas data from line scales must be measured, which can be a time-consuming procedure. Computerised data acquisition, either directly from a terminal or indirectly from optical readers, can avoid this problem.
In practice, establishing a trained sensory panel can often proceed from a category scale with a small number of scale points (e.g. five), through a category scale with more points (e.g. nine) to a line scale. Sensory analysts should be aware of difficulties that panellists have in using scales and careful training is needed to ensure that scales are unambiguous and can measure the intended response.
2.4.2 Simple descriptive procedures
Scaling may often be needed in order to quantify a single well-defined attribute. However, it should be established that there is no ambiguity in the attribute of interest. This is particularly relevant during product devel-opment or modification, when the assumption that a process or ingredient modification will change only a single attribute is frequently violated. Such changes are especially common when textural changes are a consequence of process or ingredient modifications. If it is suspected that several attrib-utes might be of interest, then the profiling procedures described in the subsequent sections should be considered.
2.4.3 Sensory profile tests
testing, but multivariate analysis methods such as principal component analysis are increasingly common. Graphical methods are often used to display results.
An alternative profile method is free-choice profiling, in which the asses-sors use the individual attribute list generated as the first stage of a simple qualitative test. Each assessor constructs an individual profile based on his/her own attributes and a consensus profile is constructed mathemati-cally using a technique known as generalised Procrustes analysis. This pro-cedure reduces panel training times considerably, but the consensus data are difficult to interpret reliably.
2.4.4 Time-related methods
Sensory attributes are not perceived instantaneously and can change in intensity with time in the mouth. In particular, the intensity of off-characteristics such as bitterness can develop with time. Time–intensity methods are used to measure intensity of a specific attribute as a function of time in the mouth. They have been used extensively to investigate the temporal behaviour of tastants, such as sweet and bitter molecules, and the release of volatile flavour materials from foods (Overbosch et al., 1991; Shamil et al., 1992). The use of time–intensity for flavour measurement is relatively well established and textural changes can also be monitored using the method.
A major limitation of the time–intensity method is that only a single attribute can be tracked with time and if a number of important attributes are thought to be time-dependent, separate sessions are needed for each attribute. Difficulties encountered in time–intensity profiling prompted the development of a hybrid technique, progressive profiling (Jack et al., 1994). In this technique, assessors carried out a profile on a set of texture descrip-tors at each chew stroke over the mastication period. Such a method has a number of potential advantages: several attributes can be assessed in one session, scaling is reduced to a unidimensional process and the most impor-tant aspects of the shape of a time–intensity curve are retained.
2.4.5 Consumer acceptability testing
such tests simple and to focus on overall acceptability. The most common procedure for operating the tests is to recruit consumers from a convenient high street or mall location and to carry out the tests in a convenient hall. Alternatively, a mobile test laboratory can be used to increase the degree of control.
2.5
Data handling, analysis and presentation
Sensory experiments can generate large amounts of data and reliable con-clusions require validation using statistical techniques. Details of suitable statistical methods can be found in a number of texts, e.g. O’Mahony (1986), Smith (1988), Meilgaard et al.(1999) and Lahiff and Leland (1994). Differ-ent types of sensory test procedure generally utilise specific analysis pro-cedures. Analysis of difference tests usually requires comparison of the test result against tables generated using the binomial expansion (e.g. Stone and Sidel, 1993). In the case of the more sophisticated profiling techniques, a wide range of options is available, both univariate and multivariate. Many statistical software packages are now available. The most sophisticated require a sound understanding of statistical principles, but more user-friendly packages are available that satisfy most requirements. However, it is usually found that no single package can cover the entire range of basic requirements. Clear and effective presentation of sensory data, including the results of statistical tests, is essential. Most standard spreadsheets are now able to offer a wide range of presentation possibilities for both uni-variate and multiuni-variate data. Specific aspects of the analysis of taint data are covered in Section 2.6.2.
2.6
Choosing and interpreting sensory tests
Sensory testing is employed extensively in the food and drinks industries for many purposes. Taint testing is commonly carried out as part of routine quality control procedures, but other applications can be seen for other purposes, for example in the selection of packaging materials in product development programmes.
2.6.1 Test selection and operation
can guarantee that a taint will be detected, steps can be taken to minimise the risk of not identifying a taint stimulus. The most important of these are the following:
• For all test procedures, if the identity of the tainting species to be tested for is known, use panellists who are known to be sensitive to that species. Unfortunately, it cannot be assumed that a panellist sensitive to one specific tainting species will also be sensitive to other tainting species.
• If a high-sensitivity panel is not attainable, especially if the nature of the taint is unknown, use as many panellists as possible in the hope of having someone present who is sensitive to the taint. Practical constraints will limit the number used, but if possible, this should not be less than 15. There is little value in using a smaller number repeatedly in replicated tests if their sensitivities are low.
• Use a high-sensitivity test procedure. Difference tests are generally more suitable than profile-type tests, as they are more rapid and do not require intensive training. In addition, a difference test against an ap-propriate, untainted control is a relatively easy task for the panellist. Triangular tests are commonly used, but if there is a risk of flavour carry-over, a duo–trio test using an untainted reference should be con-sidered. Other sensory tests have shown few applications in taint testing, but for rapid screening of a relatively large number of samples, scaling of taint intensity on either a category scale or an unstructured line scale can be of value.
be formalised by assigning scores to the scale points. An important point to note when using such ancillary data, however, is that these data are valid only from panellists who have correctly identified the odd sample. Data from panellists who have made incorrect identifications are invalid and must not be used.
2.6.2 Analysis of test data
It is essential when analysing the results of sensory taint test data to min-imise the risk of not identifying a taint that is present and to use statistical tests that are appropriate in this context. A fundamental problem is appar-ent here, as discussed by O’Mahony (1982, 1986). Convappar-entional hypothesis testing involves testing the experimental data against a null hypothesis (H0) that no trend, or difference, exists in the data. A probability value is calcu-lated that represents a difference occurring by chance. If this value is low, it is unlikely that the null hypothesis is true, and the alternative hypothesis (H1) is accepted, which states that a difference is present. On the other hand, a high value indicates that the result could have occurred by chance and the null hypothesis is not rejected. A probability value of 0.05 (5% sig-nificance) in a difference test can then be interpreted as indicating that a difference does appear to exist, but with a 5% (1 in 20) probability that the result could have been due to chance. If we require more assurance that we really have found a difference, a lower significance level of 1% could be used, giving a 1 in 100 probability of a chance result.
Unfortunately, the more assurance of a real difference that we seek, the greater the risk of not identifying a real difference that is present (Type II error). By increasing the significance level to 10%, 15% or even 20%, the risk of not identifying a real difference diminishes, but the risk of incor-rectly identifying a difference (Type I error) increases. The choice of an appropriate cut-off point depends on how prepared you are to be wrong; even 1% would be too high a risk in medical experiments, where values of 0.1% or 0.01% may be more appropriate. In sensory testing, however, and in particular in taint testing, the consequences of incorrectly saying that a difference exists are relatively minor, against the consequences of not identifying a difference and allowing tainted product to reach consumers. Consequently, levels of up to 20% should be used to minimise this risk, but accepting that by using a 20% cut-off, there will be an expectation that overall 1 in 5 will be incorrect.
2.7
Applications of sensory testing
Sensory testing procedures are employed in the context of taints and off-flavours in two different ways. First, diagnostic sensory testing can be carried out to investigate or confirm the presence of taint and to generate descriptive information that can be used to assist chemical analysis. Second, sensory testing can be carried out as part of preventive procedures designed to determine the risks carried by food-contact materials and other envi-ronmental factors in transferring tainting materials to food.
2.7.1 Diagnostic taint testing
Taint problems continue to be widespread in spite of considerable effort and expense on the part of the food and associated industries. These prob-lems frequently involve insurance claims or litigation, and in such cases correct sensory (and also chemical analysis) procedures must be adhered to rigorously.
The first indication of a taint problem is usually through consumer com-plaints on sensory quality. One consequence of the commonly low level of taint detection is that the complaints may come in at a low rate over a period of time and recognition of a taint problem may not be immediate. In addition, investigation of a sensory quality complaint arising from a single customer return requires care, owing to possible safety problems. Examination should be restricted to odour and, if feasible, chemical composition.
Examination of batches of suspect product should be carried out as a means of investigation but, again, care must be taken to guard against pos-sible safety problems. The suspect product to be tested should be from the same batch coding as the complaint material and as far as possible should have gone through the same distribution channels. In addition, suitable control material of similar age should be available. Availability of retained samples from points in the production and distribution chain is invaluable. In circumstances in which the complaint pattern suggests non-uniform dis-tribution within a production batch, testing can be carried out to a suitable statistical sampling plan, but such testing can often prove prohibitively time consuming and expensive.
problem appears to be continuing over a period of time, however, possible sources such as new building materials, process line components or water-borne contamination must be examined. If ingredients (including water supply) are suspected as continuing sources of taint, small test batches of product can be prepared and compared against appropriate controls. Mate-rials suspected as sources of taint can be tested using taint transfer tests, as described in the next section.
Particular care must be taken in gathering evidence and setting up test procedures if, as must frequently be assumed, insurance claims are likely or, even more importantly, litigation is likely. Companies supplying tainted materials may face litigation by their customers, and in turn may enter into litigation against their own suppliers. It is frequently advantageous to contract out testing work to an experienced third-party organisation in order to establish impartiality in generating data to be used as evidence. Care should, however, be taken to establish the scientific credentials and expertise of such organisations. A number of suggestions can be made in initiating such investigations if the timescales and costs of litigation are to be minimised:
• Have in place documented systems for rapid identification of the nature and source of the taint.
• Isolate affected product batch codes.
• Use both sensory and chemical analysis to establish both the occurrence and the identity of the taint – do not rely on one type of information only. • Store both suspect and control samples under conditions suitable for
future testing.
• Carry out sensory testing according to international standards procedures and use as many assessors (preferably sensitive) as possible.
• Extract as much information from the tests as possible, but do not compromise the test quality.
• Have the tests carried out and interpreted on a double-blind basis, especially if the tests are to be subcontracted to a third-party organisation.
• Ensure that the names and addresses of panellists are held, as presen-tation of sensory data in a court of law may require the presence of the individual panellists as witnesses.
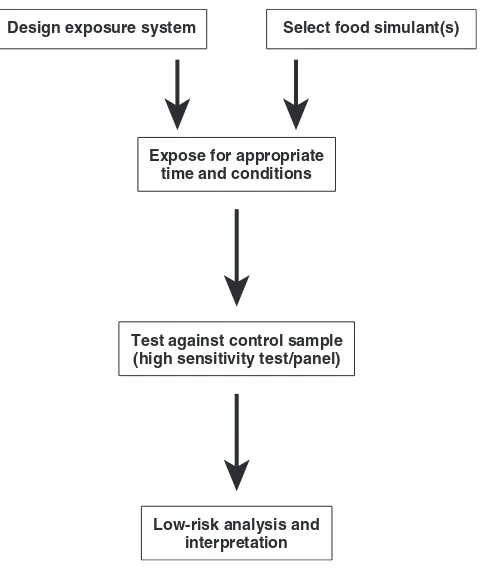
2.7.2 Preventive testing (taint transfer)
higher factors can be used for critical applications. An outline protocol for such tests is shown in Fig. 2.4.
The design of the exposure system varies considerably depending on the nature of the test. For example, taint testing of pesticide residues requires a full-scale field trial with rigidly defined crop growing, pesticide applica-tion and crop sampling procedures. In testing packaging systems, the model system may need to simulate either direct contact or remote exposure and, in testing process line components, factors such as product residence time and product temperature must be considered.
General factors to be considered in designing model systems for testing materials such as flooring, paints and packaging materials include the following:
• type of food/food simulant
• ratio of the volume or surface area of the material to the volume of the vessel
• ratio of the volume or surface area of the material to the volume or surface area of the food/food simulant
Expose for appropriate time and conditions
Test against control sample (high sensitivity test/panel)
Low-risk analysis and interpretation
Design exposure system Select food simulant(s)
• stage of exposure (e.g. at what stage during curing of a flooring mater-ial exposure is to start)
• length of exposure
• temperature and humidity at exposure
• exposure method (e.g. direct contact or vapour phase transfer)
• exposure lighting conditions (especially when rancidity development may occur)
• ventilated or unventilated exposure system
• temperature and length of storage of food/food simulant between expo-sure and testing
• sensory test procedure and interpretation.
Choice of appropriate foods/food simulants is an important consideration, with two possible approaches. Where a specific ingredient or product is known to be at risk, the test can be specifically designed around it. Where the purpose of the test is more general, however, simple foods or food simulants are often used. Solvent or adsorptive properties are the most important physicochemical considerations in selecting appropriate general simulants. Oils and fats will tend to absorb water-insoluble tainting species, and materials such as butter are known to be sensitive to taint transfer. High surface area powders with hydrophilic characteristics have also been found to be sensitive to taint transfer and tend to absorb water-soluble taints. Use of such materials will simulate a large proportion of the solvent and adsorp-tive characteristics of real foods. An additional requirement for suitable simulants, however, is that they should be relatively bland to enable easy detection, and also of acceptable palatability. This latter consideration, unfortunately, renders some simulants recommended for packaging migra-tion tests, for example 3% acetic acid, unsuitable for taint transfer testing. Still mineral water can be used to simulate aqueous liquids, and 8% ethanol in water to simulate alcoholic drinks. In the author’s laboratory, however, the characteristic ethanol flavour has been found to be rather unpleasant, and a bland vodka has been used, diluted down to 8% ethanol. Some suit-able materials for general purpose use are given in Tsuit-able 2.3.
2.8
Standardisation of test methods and
instrumental methods
packag-ing, but contains much useful information for setting up tests on other mate-rials. All the published methods are, however, deficient in their use of sensory testing methods, and the more correct and more sensitive proce-dures described here and based on BS 5929 (BSI, 1986) should be used to replace these where possible. At the time of writing, more comprehensive standards for testing packaging materials are under development.
In seeking to maintain high food quality and to minimise the risk of taint problems, the UK retailer Marks & Spencer has developed codes of prac-tice referring to the use of packaging films, plastics and paints (Goldenberg and Matheson, 1975). These guidelines stress the importance of testing by the packaging supplier before dispatch and by the food manufacturer before use. This important principle is, unfortunately, rarely recognised by the food industry in general. Food manufacturers frequently rely on sup-pliers to provide some general form of certification or test evidence that a material is free from taint, but the material is seldom tested under the con-ditions in which it will be used. Information provided by suppliers can be regarded as useful screening information, but users must protect themselves by re-testing under more realistic and rigorous conditions.
Sensory testing is an essential component of taint identification, but alone seldom gives a positive identification of a chemical species. Instru-mental methods of chemical analysis must be used for positive identifica-tion, especially in situations in which litigation or insurance claims occur. As most tainting species are volatile, gas chromatography–mass spectrom-etry is commonly used, but with prior extraction/concentration steps in order to increase sensitivity. Identification of involatile materials, for example those responsible for unwanted bitter flavours, can be a more dif-ficult problem, especially as sensory descriptions are imprecise and rarely helpful.
Table 2.3 Foods/food simulants for taint transfer testing
Type Food/simulant Comments
Fat Chocolate Bland variety (white or milk)
Unsalted butter Mixed prior to sensory testing, or outer surfaces only used for severe test
Hydrophilic Sugar High surface area preferred (e.g. icing
powder sugar); test as 5% solution
Cornflour Test as blancmange formulation
(can get textural variation)
Rusks/crispbread Expose crushed
Combined Biscuits High fat, e.g. shortbread
Milk Full cream; for short-term exposure
2.9
Ethical aspects
Any sensory evaluation operation using human subjects as a means of acquiring information on the sensory characteristics of foods must have ethical procedures in place designed to protect panellists from hazards asso-ciated with consuming unsafe food, and these must form part of general safety practices operated by the company management. Consuming or testing food that may be contaminated with unknown tainting species carries a specific toxic risk, and additional measures may be needed to protect panellists against such risks and also company staff against subse-quent litigation. Companies are now increasingly using guidelines originally drawn up in the UK for testing genetically modified ingredients (ACNFP, undated), but which are now regarded as being applicable to any situation in which there is a potential toxicity hazard associated with the ingestion of chemical substances, including novel ingredients. The guidelines define an exposure/risk matrix; depending on the information known about the test material, the position within the matrix defines whether or not human testing should take place. Rigid application of these guidelines would create difficulties in taint testing owing to the unknown nature of taints, but they also stress the overriding need for any organisation carrying out testing using human subjects to have a documented ethical procedure designed to protect human subjects, if necessary utilising external expertise. An essen-tial component of any ethical system is an advise and consent procedure, in which all known risks are summarised and panellists are allowed to with-draw from the test. Information that should be given includes:
• type of risk
• chemical name of any contaminants, if known
• natural occurrence in foods, and normal use (if appropriate)
• available toxicity data, either in numeric terms (e.g. LD50) or relative to
appropriate materials more familiar to the panellists
• approximate quantity that may be ingested during a test and anticipated number of tests over the course of the projects; if appropriate, panellists may be instructed to expectorate the samples and not to swallow, but some involuntary swallowing must be expected.
2.10
Future trends
qualitative or semi-quantitative basis and should be of great assistance in ensuring freedom from taint.
The development in instrumental methods is likely to follow the route exemplified by the ‘electronic nose’ systems, more correctly described as volatile sensors (Schaller et al., 1998). At present, these systems are detec-tion instruments, which cannot easily identify specific volatiles, although more recent instruments are more correctly regarded as developments of mass spectrometers. However, they are more usefully used as pattern recog-nition devices, using multivariate or neural network software systems. These can detect changes in volatile patterns that can potentially be related to foreign volatile components. Recent publications have shown potential applications in the detection of taint in cork stoppers (Rocha et al., 1998) and of boar taint in pork (Annor-Frempong et al., 1998). Unconfirmed reports have indicated that some food manufacturers are now using elec-tronic noses to screen incoming packaging materials for odour level. Recent reports have also indicated that similar sensing and pattern recognition systems could also be used for involatiles, although these may be less rele-vant to storage changes (Lavigne et al.,1998).
2.11
References
ACNFP (undated), ‘Guidelines on the conduct of the taste trials involving novel foods or foods produced by novel processes’, Advisory Committee on Novel Foods and Processes, London.
annor-frempong i e,nute g r,wood j d,whittington f wand west a (1998), ‘The measurement of the responses to odour intensities of “boar taint” using a sensory panel and an electronic nose’ Meat Sci,50(2), 139–51.
ASTM (1988), ASTM E619-84 ‘Evaluating foreign odors in food packaging’, American Society for Testing and Materials, Philadelphia.
british standards institution(1964), British Standard BS 3755 ‘Methods of test for the assessment of odour from packaging materials used for foodstuffs’, London.
british standards institution(1986), British Standard BS 5929 Part 1; ISO 6658. ‘Introduction and general guide to methodology’, London.
british standards institution(1989), British Standard BS 7183; ISO 8589. ‘Guide to design of test rooms for sensory analysis of food’, London.
british standards institution(1992), British Standard BS 5098; ISO 5492. ‘Glos-sary of terms relating to sensory analysis’, London.
british standards institution(1993), British Standard BS 7667 Part 1; ISO 8586-1. ‘Assessors for sensory analysis. Part 8586-1. Guide to the selection, training and monitoring of selected assessors’, London.
deutsches institut für normung (1983), DIN 10955 ‘Testing of container materials and containers for food products’, Berlin.
goldenberg n and matheson h r(1975), ‘ “Off-flavours” in foods, a summary of experience: 1948–74’,Chem Ind, 551–7.
hutchings j b (1994),Food Colour and Appearance, Blackie A&P, Glasgow.
lahiff m andleland j v(1994), ‘Statistical methods’, in Source Book of Flavors, G. Reineccius (ed), Chapman & Hall, New York, 743–87.
lavigne j j,savoy s,clevenger m b,ritchie j e,yoo s-y,ansyln e v,mcdevitt j t,
shear j b andneikirk d(1998), ‘Solution-based analysis of multiple analytes by a sensor array: Toward the development of an “Electronic tongue” ’,J Am Chem Soc,120, 6429–30.
lawless h t andheymann h (1998),Sensory Evaluation of Food. Principles and Practices, Chapman & Hall, London.
linssen j p h, janssens j l g m, reitsma j c e androozen j p (1991), ‘Sensory analysis of polystyrene packaging material taint in cocoa powder for drinks and chocolate flakes’,Food Additives Contamin,8(1), 1–7.
meilgaard m,civille g v andcarr b t (1999),Sensory Evaluation Techniques, 3rd edn, CRC Press, Boca Raton, Fl.
office international du cacao et du chocolat (OICC) (1998), ‘Transfer of pack-aging odours to cocoa and chocolate products’, Analytical Methods of the Office International du Cacao et du Chocolat, Verlag, Zurich.
o’mahony m a p d (1979), ‘Short-cut signal detection measures for sensory analysis’,
J Food Sci,44, 302–3.
o’mahony m a p d (1982), ‘Some assumptions and difficulties with common statis-tics for sensory analysis’,Food Technol,36(11), 76–82.
o’mahony m a p d (1986),Sensory Evaluation of Food: Statistical Methods and Pro-cedures. Marcel Dekker, New York.
o’mahony m a p d (1995), ‘Who told you the triangle test was simple?’ Food Qual Preference,6(4), 227–38.
overbosch p,afterof w g m andharing p g m (1991), ‘Flavour release in the mouth’,
Food Rev Internat,7, 137–84.
piggott j r (1988),Sensory Analysis of Food, 2nd edn, Elsevier Applied Science, London.
piggott j r(1995), ‘Design questions in sensory and consumer science’,Food Qual Preference,6(4), 217–20.
rocha s,delgadillo i,correia a j f,barros a andwells,p (1998), ‘Application of an electronic aroma sensing system to cork stopper quality control’,J Agric Food Chem,46(1), 141–51.
rosenthal a (1999),Food Texture, Perception and Measurement, Aspen Publishers, Gaithersburg, Maryland.
schaller e,bosset j o andescher f (1998), ‘“Electronic n