ESS
-
E
XTENSION OF
S
OCIAL
S
ECURITY
The Decade of Adjustment:
A Review of Austerity Trends 2010-2020 in 187 Countries
Isabel Ortiz
Matthew Cummins
Jeronim Capaldo
Kalaivani Karunanethy
ESS Working Paper No. 53
THE SOUTH CENTRE
INITIATIVE FOR POLICY DIALOGUE (IPD), COLUMBIA UNIVERSITY
Copyright © International Labour Organization, Columbia University and the The South Centre
First published 2015
Publications of the International Labour Office enjoy copyright under Protocol 2 of the Universal Copyright Convention. Nevertheless, short excerpts from them may be reproduced without authorization, on condition that the source is indicated. For rights of reproduction or translation, application should be made to ILO Publications (Rights and Permissions), International Labour Office, CH-1211 Geneva 22, Switzerland, or by email: [email protected]. The International Labour Office welcomes such applications.
Libraries, institutions and other users registered with reproduction rights organizations may make copies in accordance with the licences issued to them for this purpose. Visit www.ifrro.org to find the reproduction rights organization in your country.
ILO Cataloguing in Publication Data
The Decade of Adjustment: A Review of Austerity Trends 2010-2020 in 187 Countries / Isabel Ortiz, Matthew Cummins, Jeronim Capaldo, Kalaivani Karunanethy; International Labour Office. - Geneva: ILO, 2015 (Extension of Social Security Series No. 53)
International Labour Office Social protection Department
public expenditure / fiscal consolidation / austerity / adjustment measures / growth / impact on jobs welfare/ wage bill / subsidies / pension reforms / labour flexibilization / rationalization social protection / health reforms / consumption taxes / privatization / crisis recovery
The designations employed in ILO publications, which are in conformity with United Nations practice, and the presentation of material therein do not imply the expression of any opinion whatsoever on the part of the International Labour Office concerning the legal status of any country, area or territory or of its authorities, or concerning the delimitation of its frontiers.
The responsibility for opinions expressed in signed articles, studies and other contributions rests solely with their authors, and publication does not constitute an endorsement by the International Labour Office of the opinions expressed in them.
Reference to names of firms and commercial products and processes does not imply their endorsement by the International Labour Office, and any failure to mention a particular firm, commercial product or process is not a sign of disapproval.
ILO publications and digital products can be obtained through major booksellers and digital distribution platforms, or ordered directly from [email protected]. For more information, visit our website: www.ilo.org/publns or contact [email protected].
The editor of the series is the Director of the Social Protection Department, ILO. For more information on the series, or to submit a paper, please contact:
Isabel Ortiz, Director Social Protection Department International Labour Organization
4 Route des Morillons
CH-1211 Geneva 22 Switzerland
Tel. +41.22.799.6226 • Fax: +41.22.799.79.62
iii
Executive Summary
This paper: (i) examines the latest IMF government spending projections for 187 countries between 2005 and 2020; (ii) reviews 616 IMF country reports in 183 countries to identify the main adjustment measures considered by governments in both high-income and developing countries; (iii) applies the United Nations Global Policy Model to simulate the impact of expenditure consolidation on economic growth and employment; (iv) discusses how austerity threatens welfare and social progress; and (v) calls for urgent action by governments to adopt alternative and equitable policies for socio-economic recovery.
Analysis of expenditure projections reveals that there have been two distinct phases of government spending patterns since the onset of the global economic crisis. In a first phase (2008-09), most governments introduced fiscal stimulus programs and ramped up public spending. In 2010, however, premature budget cuts became widespread, despite vulnerable
populations’ urgent and significant need of public assistance. The second phase of the crisis is characterized by two major contractionary shocks, the first occurring in 2010-11 and the second taking off in 2016 and lasting at least until 2020.
The forthcoming adjustment shock is expected to impact 132 countries in 2016 in terms of GDP and hover around this level until 2020. One of the key findings is that the developing world will be the most severely affected. Overall, 81 developing countries, on average, are projected to cut public spending during the forthcoming shock versus 45 high-income countries. Comparing the forthcoming 2016-20 and pre-crisis 2005-07 periods further suggests that 30 per cent of countries are undergoing excessive contraction, defined as cutting expenditure below pre-crisis levels in terms of GDP. Overall, austerity is expected to impact more than two-thirds of all countries during 2016-20, affecting more than six billion persons or nearly 80 per cent of the global population by 2020.
In terms of austerity measures, a desk review of recent IMF country reports indicates that governments are weighing various adjustment measures. These include: (i) elimination or reduction of subsidies, including on fuel, agriculture and food products (in 132 countries); (ii) wage bill cuts/caps, including the salaries of education, health and other public sector workers (in 130 countries); (iii) rationalizing and further targeting of safety nets (in 107 countries); (iv) pension reforms (in 105 countries); (v) labour market reforms (in 89 countries); and (vi) healthcare reforms (in 56 countries). Many governments are also considering revenue-side measures that can adversely impact vulnerable populations, mainly through introducing or broadening consumption taxes, such as value added taxes (VATs) (in 138 countries), as well as privatizing state assets and services (in 55 countries). Contrary to public perception, austerity measures are not limited to Europe; in fact, many of the principal adjustment measures feature most prominently in developing countries.
Projections with the United Nations Global Policy Model indicate that the expected spending cuts will negatively affect GDP and employment in all regions. Compared to a baseline scenario without spending contraction, global GDP will be 5.5 per cent lower by 2020 further resulting in a net loss of 12 million jobs. Upper-middle and low income countries will be hardest hit, with fiscal adjustment reducing GDP by roughly 7.5 and 6 per cent, respectively, over the 2016-20 period. East Asia and Sub-Saharan Africa will be the most affected regions.
iv
are actually increasing subsidies and the wage bill, and expanding coverage/benefits of social protection and health, despite their contractionary fiscal environments.
This paper questions if the projected fiscal contraction trajectory—in terms of timing, scope and magnitude—as well as the specific austerity measures being considered are conducive to socio-economic recovery and the achievement of the Sustainable Development Goals (SDGs). This paper encourages policymakers to recognize the high human and developmental costs of poorly-designed adjustment strategies and to consider alternative policies that support a recovery for all.
JEL Classification: H5, H12, O23, H5, I3, J3
v
Table of Contents
1. Introduction ... 1
2. Global Expenditure Trends, 2005-2020 ... 1
2.1 Data and Methodology ... 1
2.2 Results ... 2
2.2.1 The Two Phases: Fiscal Expansion (2008-2009) and Fiscal Consolidation
(2010-2020)... 2
2.2.2 Excessive Contraction ... 5
2.3 From Fiscal Stimulus to Fiscal Contraction ... 8
3. Main Adjustment Measures Considered, 2010-2015 ... 11
3.1 Methodology... 11
3.2 Results ... 11
3.2.1 Global Adjustment Trends ... 11
3.2.2 Adjustment measures in high-income countries ... 15
3.2.3 Adjustment Trends in East Asia and the Pacific ... 16
3.2.4 Adjustment Trends in Eastern Europe and Central Asia ... 17
3.2.5 Adjustment Trends in Latin America and the Caribbean ... 18
3.2.6 Adjustment Trends in the Middle East and North Africa ... 19
3.2.7 Adjustment Trends in South Asia ... 20
3.2.8 Adjustment Trends in Sub-Saharan Africa ... 21
4. Impacts on Growth and Employment ... 23
4.1 Methodology... 23
4.2 Projection Results ... 24
5. Impacts on Welfare ... 28
5.1 Eliminating or Reducing Subsidies ... 28
5.2 Wage Bill Cuts or Caps ... 30
5.3 Rationalizing and Further Targeting of Safety Nets ... 31
5.4 Pension and Health Reforms ... 33
5.5 Labour Reforms ... 35
5.6 Increasing Consumption Taxes ... 36
5.7 Privatization of State Assets and Services ... 38
6. Conclusion: A Decade of Austerity ... 39
Annex 1: Projected Changes in Total Government Expenditure in 187 Countries, 2005-2020 ... 45
Annex 2: Number of Countries and Population Affected by Expenditure Contraction, 2008-15 53
Annex 3: IMF Country Reports Reviewed, February 2010 to February 2015 ... 54
Annex 4: UN Global Policy Model Simulation Details... 60
vi
List of Tables:
Table 1: Number of Countries and Population Affected by Expenditure Contraction, 2008-15 ... 4
Table 2: Changes in Total Government Spending, 2016-20 avg. over 2005-07 avg. ... 5
Table 3: Growth of Real Government Spending, 2016-20 avg. over 2005-07 avg. ... 5
Table 4: Main Adjustment Measures by Region, 2010-15 ... 13
Table 5: Main Adjustment Measures by Region, 2010-15 ... 13
Table 6: Adjustment Measures in High-Income Countries, 2012-15 ... 15
Table 7: Adjustment Measures in East Asia and the Pacific, 2012-15 ... 17
Table 8: Adjustment Measures in Eastern Europe and Central Asia, 2012-15 ... 18
Table 9: Adjustment Measures in Latin America and the Caribbean, 2012-15 ... 19
Table 10: Adjustment Measures in the Middle East and North Africa, 2012-15 ... 20
Table 11: Adjustment Measures in South Asia, 2012-15 ... 21
Table 12: Adjustment Measures in Sub-Saharan Africa, 2012-15... 21
Table 13: Impact of Fiscal Adjustment on GDP (per cent) and Employment (millions) ... 25
List of Figures: Figure 1: Number of Countries Contracting Public Expenditure as a percentage of GDP, 2008-20 ... 2
Figure 2: Population Affected by Public Expenditure Contraction, 2010-20 ... 3
Figure 3: Change in Total Government Spending, 2016-20 avg. over 2005-07 avg. ... 7
Figure 4: Size of Social Protection Component of Stimulus Packages 2009... 8
Figure 5: Support for the Financial Sector, Fiscal Stimulus Packages and Public Debt Increases, ... 10
Figure 6: Incidence of Austerity Measures in 183 Countries, 2010-15 ... 12
Figure 7: Main adjustment measures, 2010-12 and 2012-15 ... 14
Figure 8: Annual GDP Growth Rates, baseline (blue) and fiscal adjustment (red) ... 27
Figure 9: Global GDP Growth Rates, 2015-20 ... 28
Figure 10: Local and Global Food Price Indices, 2007-12 ... 30
Figure 11: Beneficiaries under New Social Assistance System in Moldova ... 33
Figure 12: Increase in Proportion of Population at Risk of Poverty in European Countries (2008-12) ... 35
Figure 13: Projected and Actual Fiscal Deficits in Developing Countries, 2007-15 (% of GDP) ... 42
List of Boxes: Box 1: Removing Food Subsidies despite High Food Prices ... 30
Box 2: Cambodia’s Wage Bill Cuts ... 31
Box 3: Targeting Social Assistance: The Case of Moldova ... 32
Box 4: Increasing Poverty in High Income Europe ... 35
Box 5: Examples of Labour Flexibilization Reforms Worldwide, 2010-12 ... 36
Box 6: Options to Increase Government Resources Exist even in the Poorest Countries ... 37
Box 7: Reversing Pension Privatizations ... 39
vii
Acknowledgements
This publication updates and expands on an earlier paper ―The Age of Austerity: A Review of Public Expenditures and Adjustment Measures in 181 Countries‖ by Isabel Ortiz and Matthew Cummins, published by the Initiative for Policy Dialogue at Columbia University and the South Centre. The analysis was first developed by the authors in UNICEF in early 2010, when fiscal
consolidation was just starting (―Prioritizing Expenditures for a Recovery with a Human Face: Results from a Rapid Desk Review of 86 Recent IMF Country Reports‖), and has since been
updated in late 2010, 2012, 2013, 2014 and now in 2015.
In this latest version, Jeronim Capaldo has added a section on the impacts on growth and jobs, and Kalaivani Karunanethy has assisted in the review of IMF country reports.
1
1. Introduction
In the wake of the food, fuel and financial crises, a fourth shockwave hit the global economy in 2010: fiscal adjustment. It would mark the onset of a prolonged period of budget cuts that is now projected to continue at least through 2020 in high-income and developing countries alike.
This working paper: (i) examines the latest IMF government spending projections for 187 countries by comparing the three distinct periods of 2005-07 (pre-crisis), 2008-09 (crisis phase I: expenditure expansion) and 2010-20 (crisis phase II: expenditure contraction); (ii) reviews 616 IMF country reports in 183 countries to identify the main adjustment measures; (iii) simulates the impacts of projected budget cuts on employment and growth using the United Nations Global Policy Model; (iv) discusses the varied effects of austerity on public welfare; and (v) calls for urgent action by governments to adopt alternative and equitable policies for socio-economic recovery.
Our review is based on information published by the IMF. The expenditure trend analysis uses country-level indicators extracted from the April 2015 World Economic Outlook database. To serve as a general reference, the projected changes in total government expenditure—both in terms of GDP as well as in real growth—for 187 countries are provided in Annex 1. Regarding the analysis of adjustment measures, the identification of different options considered by governments is inferred from policy discussions contained in 616 IMF country reports in 183 countries published between February 2010 and February 2015. Annex 3 presents the complete list of country reports reviewed. Annex 4 presents the detailed results from the employment and growth simulations.
2. Global Expenditure Trends, 2005-2020
2.1 Data and Methodology
Our analysis of government expenditure trends is based on IMF projections contained in the World Economic Outlook database (April 2015), the main source of comparable, cross-national fiscal data. Several caveats are worth mentioning. First, the scope of expenditure data varies across countries. While in most instances the data refer to central and local government, for some countries, the data refer to the public sector, which includes public enterprises. Second, total government spending projections may differ from the estimates used in this study as more up-to-date information becomes available. Third, expenditure data from IMF sources may vary from those reported in national budgets due to alternative projection assumptions and methods.
2
46 40
72 76
46
64 60 63
82 76 81 82 84
10 5
39 39
27
26 29 30
49
46 43 42
45 0 20 40 60 80 100 120 140 20 08 20 09 20 10 20 11 20 12 20 13 20 14 20 15 20 16 20 17 20 18 20 19 20 20 High income Developing PHASE 1: Fiscal expansion PHASE 2: Fiscal contraction
Shock 1 (2010-11)
Shock 2 (2016-20)
2.2 Results
2.2.1 The Two Phases: Fiscal Expansion (208-09) and Fiscal Consolidation (2010-20)
Analysis of expenditure projections verifies two distinct phases of spending patterns since the onset of the global economic crisis. In the first phase of the crisis, most governments introduced fiscal stimulus programmes and ramped up total spending. Overall, 137 countries (roughly three-quarters of the sample) expanded spending during 2008 and 2009 by an average annual increase of 3.3 per cent of GDP, with only about 50 countries contracting public expenditure (see Annex 1).
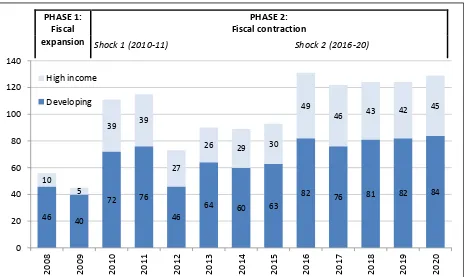
In 2010, however, governments started to scale back stimulus programs and reduce spending in a second phase of the crisis that is ongoing and expected to continue at least until 2020. As depicted in Figure 1, the expenditure contraction phase of the crisis is characterized by two unique shocks, the first occurring in 2010 and 2011 and the second taking off in 2016.
Figure 1: Number of Countries Contracting Public Expenditure as a percentage of GDP, 2008-20
Source: Authors’ calculations based on the IMF’s World Economic Outlook (April 2015)
In terms of the first shock, the number of countries reducing their budgets as a per cent of GDP mushroomed between 2009 and 2010, impacting 113 countries by 2011 (or about 60 per cent of the sample). The average contraction size during this period amounted to 2.3 per cent of GDP, on average, confirming that the change in fiscal position in most countries was both sudden and severe.
3 0
10 20 30 40 50 60 70 80 90 100
20
10
20
11
20
12
20
13
20
14
20
15
20
16
20
17
20
18
20
19
20
20
High income
Developing
Then, beginning in 2016, a new expenditure shock is projected to emerge, marking the beginning of a second, major period of contraction globally. Overall, budget reductions are expected to impact 132 countries in 2016 in terms of GDP and hover around this level at least until 2020.1 During the five years covering 2016 to 2020, expenditure contraction is expected to impact 127 countries, on average, which amounts to more than two out of every three countries worldwide. East Asia and the Pacific along with the Middle East and North Africa are the regions forecasted to undergo the most severe cuts during the second shock (Table 1). The average expenditure contraction of East Asian countries is expected to intensify from -1.5 per cent of GDP in 2014 to -4.3 per cent of GDP in 2016; in the Middle East, budget cuts are projected to deepen from -2.1 per cent of GDP in 2014 to -4.2 per cent in 2017. In terms of income groups, lower middle-income countries are expected to decrease overall government spending from -1.5 per cent of GDP to -2.8 per cent between 2014 and 2016.
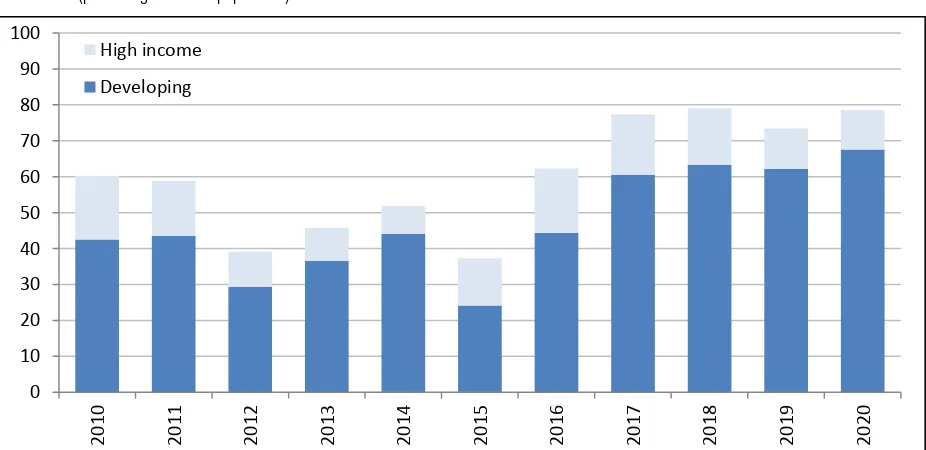
Turning to populations affected, expenditure projections indicate that austerity will affect more than 6.1 billion persons or nearly 80 per cent of the global population by 2020 (Figure 2). The populations of several developing regions are expected to be hit exceptionally hard, including more than 80 per cent of the inhabitants of the Middle East and North Africa,Latin America and the Caribbean, Eastern Europe and Central Asia. Looking at income groups, more than 90 per cent of the persons living in upper middle-income countries will be affected by austerity during the second shock. This underscores one of the more alarming findings, which, in stark contrast to newspaper headlines and public perception, verifies that austerity is increasingly a developing country phenomenon. In the year 2020, 83 per cent of persons living in developing countries are projected to be impacted by budget cuts, compared to 61 per cent of persons living in high-income countries.
Figure 2: Population Affected by Public Expenditure Contraction, 2010-20 (percentage of world population)
Source: Authors’ calculations based on the IMF’s World Economic Outlook (April 2015) and United Nation’s World Population Prospects: The 2010 Revision (2011)
4
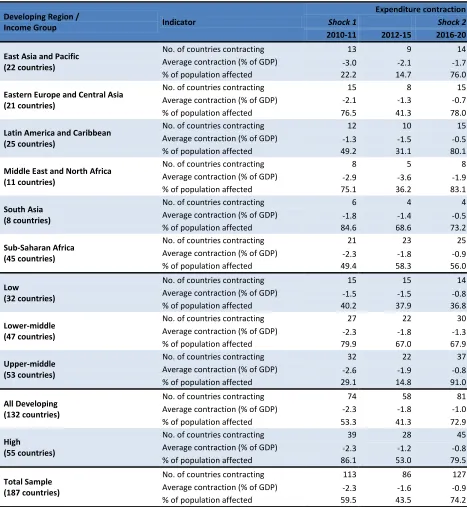
Table 1: Number of Countries and Population Affected by Expenditure Contraction, 2008-15 (period averages, percentage of GDP)
Developing Region /
Income Group Indicator
Expenditure contraction
Shock 1 Shock 2
2010-11 2012-15 2016-20
East Asia and Pacific (22 countries)
No. of countries contracting 13 9 14
Average contraction (% of GDP) -3.0 -2.1 -1.7
% of population affected 22.2 14.7 76.0
Eastern Europe and Central Asia (21 countries)
No. of countries contracting 15 8 15
Average contraction (% of GDP) -2.1 -1.3 -0.7
% of population affected 76.5 41.3 78.0
Latin America and Caribbean (25 countries)
No. of countries contracting 12 10 15
Average contraction (% of GDP) -1.3 -1.5 -0.5
% of population affected 49.2 31.1 80.1
Middle East and North Africa (11 countries)
No. of countries contracting 8 5 8
Average contraction (% of GDP) -2.9 -3.6 -1.9
% of population affected 75.1 36.2 83.1
South Asia (8 countries)
No. of countries contracting 6 4 4
Average contraction (% of GDP) -1.8 -1.4 -0.5
% of population affected 84.6 68.6 73.2
Sub-Saharan Africa (45 countries)
No. of countries contracting 21 23 25
Average contraction (% of GDP) -2.3 -1.8 -0.9
% of population affected 49.4 58.3 56.0
Low
(32 countries)
No. of countries contracting 15 15 14
Average contraction (% of GDP) -1.5 -1.5 -0.8
% of population affected 40.2 37.9 36.8
Lower-middle (47 countries)
No. of countries contracting 27 22 30
Average contraction (% of GDP) -2.3 -1.8 -1.3
% of population affected 79.9 67.0 67.9
Upper-middle (53 countries)
No. of countries contracting 32 22 37
Average contraction (% of GDP) -2.6 -1.9 -0.8
% of population affected 29.1 14.8 91.0
All Developing (132 countries)
No. of countries contracting 74 58 81
Average contraction (% of GDP) -2.3 -1.8 -1.0
% of population affected 53.3 41.3 72.9
High
(55 countries)
No. of countries contracting 39 28 45
Average contraction (% of GDP) -2.3 -1.2 -0.8
% of population affected 86.1 53.0 79.5
Total Sample (187 countries)
No. of countries contracting 113 86 127
Average contraction (% of GDP) -2.3 -1.6 -0.9
% of population affected 59.5 43.5 74.2
5 2.2.2 Excessive Contraction
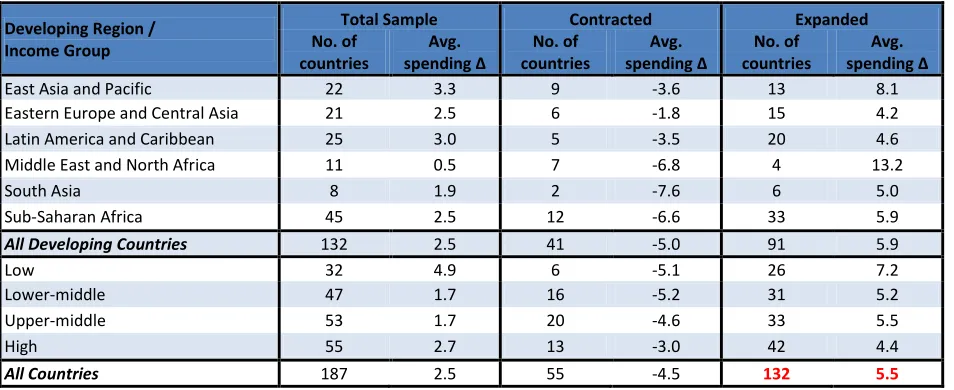
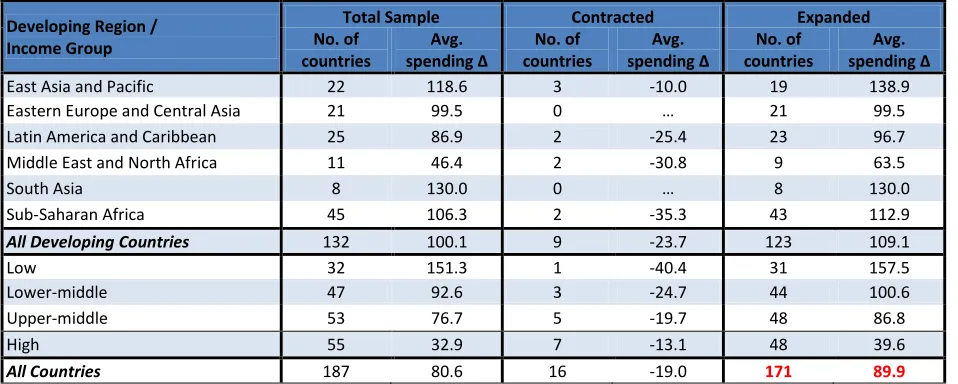
Excessive austerity can be defined as reducing total government expenditure to below pre-crisis levels, prior to the onset of the global financial crisis.2 Comparing the average level of public spending during the period of the second expenditure contraction shock (2016-20) with the average level of public spending during the pre-crisis period (2005-07) shows that the vast majority of countries are expected to maintain total expenditure far above pre-crisis levels. Projected spending amounts during the forthcoming phase of the crisis are 5.5 per cent of GDP higher, on average, than those during the pre-crisis phase in nearly 70 per cent of the sample (Table 2); in real terms, public expenditure is projected to be 90 per cent above pre-crisis spending levels in 90 per cent of the world (or 171 countries) (Table 3). These findings indicate that most governments are expected to have considerably higher levels of public support compared to the start of the global financial crisis.
Table 2: Changes in Total Government Spending, 2016-20 avg. over 2005-07 avg. (percentage of GDP)
Developing Region / Income Group
Total Sample Contracted Expanded No. of
countries
Avg.
spending Δ
No. of countries
Avg.
spending Δ
No. of countries
Avg.
spending Δ
East Asia and Pacific 22 3.3 9 -3.6 13 8.1
Eastern Europe and Central Asia 21 2.5 6 -1.8 15 4.2
Latin America and Caribbean 25 3.0 5 -3.5 20 4.6
Middle East and North Africa 11 0.5 7 -6.8 4 13.2
South Asia 8 1.9 2 -7.6 6 5.0
Sub-Saharan Africa 45 2.5 12 -6.6 33 5.9
All Developing Countries 132 2.5 41 -5.0 91 5.9
Low 32 4.9 6 -5.1 26 7.2
Lower-middle 47 1.7 16 -5.2 31 5.2
Upper-middle 53 1.7 20 -4.6 33 5.5
High 55 2.7 13 -3.0 42 4.4
All Countries 187 2.5 55 -4.5 132 5.5
Source: Authors’ calculations based on the IMF’s World Economic Outlook (April 2015)
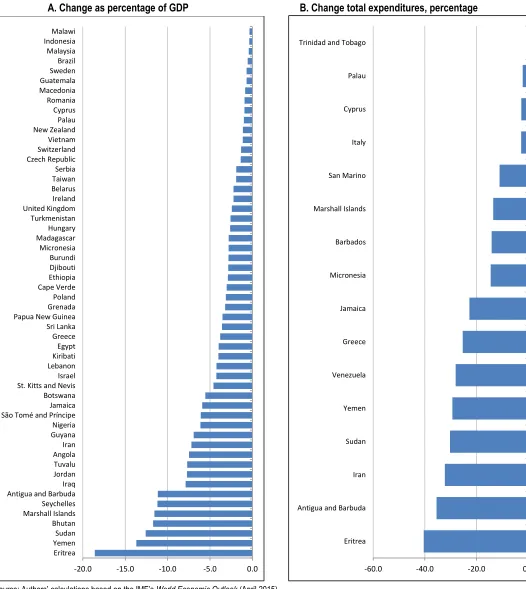
Despite the widespread positive spending trend, an alarming number of countries appears to be undergoing excessive spending contraction, which has major risks (see Sections 4 and 5). In terms of GDP, analysis of expenditure estimates reveals that 55 governments may be slashing their budgets excessively during 2016-20 (Figure 3A). Seventeen of these countries are expected to be spending more than 5.0 per cent of GDP less, on average, during the second shock than compared to expenditure levels during the pre-crisis period. These countries include: Angola, Antigua and Barbuda, Bhutan, Botswana, Eritrea, Guyana, Iran, Iraq, Jamaica, Jordan, Marshall Islands, Nigeria, São Tomé and Príncipe, Seychelles, Sudan, Tuvalu and Yemen. In real terms, 16 governments are forecasted to have smaller budgets in 2016-20, on average, than during 2005-07 (Figure 3B).
6
Table 3: Growth of Real Government Spending, 2016-20 avg. over 2005-07 avg. (percentage)
Developing Region / Income Group
Total Sample Contracted Expanded No. of
countries
Avg.
spending Δ
No. of countries
Avg.
spending Δ
No. of countries
Avg.
spending Δ
East Asia and Pacific 22 118.6 3 -10.0 19 138.9
Eastern Europe and Central Asia 21 99.5 0 … 21 99.5
Latin America and Caribbean 25 86.9 2 -25.4 23 96.7
Middle East and North Africa 11 46.4 2 -30.8 9 63.5
South Asia 8 130.0 0 … 8 130.0
Sub-Saharan Africa 45 106.3 2 -35.3 43 112.9
All Developing Countries 132 100.1 9 -23.7 123 109.1
Low 32 151.3 1 -40.4 31 157.5
Lower-middle 47 92.6 3 -24.7 44 100.6
Upper-middle 53 76.7 5 -19.7 48 86.8
High 55 32.9 7 -13.1 48 39.6
All Countries 187 80.6 16 -19.0 171 89.9
7
-60.0 -40.0 -20.0 0.0
Eritrea Antigua and Barbuda Iran Sudan Yemen Venezuela Greece Jamaica Micronesia Barbados Marshall Islands San Marino Italy Cyprus Palau Trinidad and Tobago Figure 3: Change in Total Government Spending, 2016-20 avg. over 2005-07 avg.
A. Change as percentage of GDP B. Change total expenditures, percentage
Source: Authors’ calculations based on the IMF’s World Economic Outlook (April 2015)
-20.0 -15.0 -10.0 -5.0 0.0
8
2.3 From Fiscal Stimulus to Fiscal Contraction
In 2008-09 there was a global consensus on countercyclical fiscal policies, whereby countries coordinated policies to combat the negative social and economic impacts of the crisis. The IMF spelled out the need for global fiscal stimulus: ―In normal times, the Fund would indeed be recommending to many countries that they reduce their budget deficit and their public debt. But these are not normal times… if no fiscal
stimulus is implemented, then demand may continue to fall… what is needed is… a commitment by
governments that they will follow whatever policies it takes to avoid a repeat of a Great Depression
scenario.‖3
During the first phase of the crisis (2008-09), 137 countries ramped up public expenditure, with the average annual expansion amounting to 3.3 per cent of GDP.
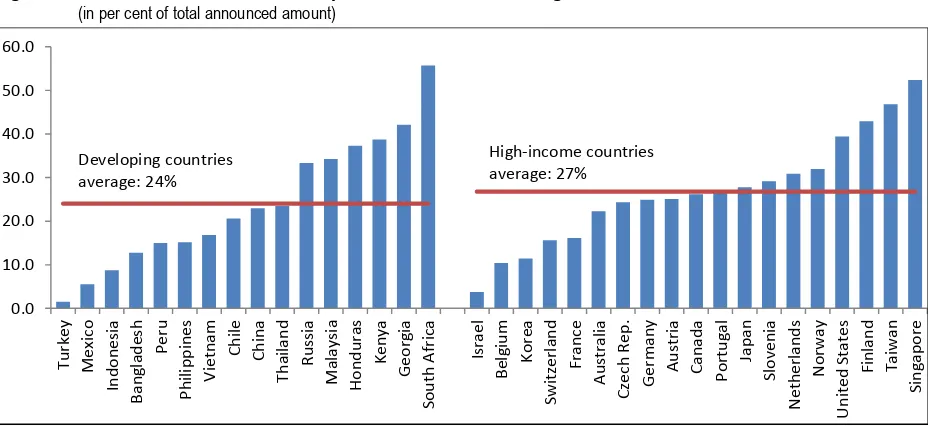
At least 48 countries announced fiscal stimulus packages totaling US$2.4 trillion, of which approximately a quarter was allocated to social protection measures (Figure 4). Social protection played a key role in attenuating the immediate negative effects of the crisis on. One of the key lessons from these initial crisis responses is that social protection can function as an automatic stabilizer most effectively if the relevant schemes and programmes are implemented early (ILO, 2014). In the absence of such social protection
measures, the effect of the crisis on unemployment, households’ disposable income and poverty rates in
2009-10 would have been much worse (ILO, 2011).
Figure 4: Size of Social Protection Component of Stimulus Packages 2009
(in per cent of total announced amount)
Sources: Authors’ calculations based on Zhang, Thelen and Rao (2010) and IMF country reports for Chile and Peru
What prompted governments to abandon fiscal expansion in 2010 and embrace expenditure contraction? The conventional answer is to address debt and fiscal deficits. However this seemingly straightforward explanation deserves further exploration, especially given the fragile state of recovery in 2010 and the clear, negative impacts that fiscal retrenchment would have on economic activity.
Early in 2010, IMF advice underwent a major change (later supported by the OECD and ultimately also by the G20). Two IMF Board papers approved in February 2010—―Exiting from crisis intervention policies‖ and ―Strategies for fiscal consolidation in the post-crisis world‖—called for large-scale fiscal
adjustment ―when the recovery is securely underway‖ and for structural reforms in public finance to be initiated immediately ―even in countries where the recovery is not yet securely underway‖ (IMF, 2010a;
3 Olivier Blanchard, Economic Counselor and Director, IMF Research Department,
9 IMF, 2010b). Reforms of pension and health entitlements were called for, accompanied by ―strengthened safety nets‖ for the poorest (IMF, 2010a, pp. 15-32). On the composition of fiscal adjustment, it was advised that most of it could come from:
Unwinding the previously adopted fiscal stimulus packages;
Reforming pension and health entitlements to reduce the long-term financial obligations of the state
by way of avoiding ―a rise in spending as a share of GDP‖ (IMF, 2010a, p. 16); Containing other spending, by means such as eliminating subsidies; and Increasing tax revenues.
All these suggested reforms became mainstream policy advice in a majority of countries around the world after 2010 and shaped the direction embraced by the economic adjustment programmes agreed with countries facing a sovereign debt crisis. Other international institutions also played a role. The Bank of International Settlements (BIS)—the bank for central bankers—joined the IMF in advocating front-loaded fiscal consolidation and structural reforms claiming that the limits to fiscal stimulus had been reached in a number of countries (BIS 2010 and 2011). The OECD 2010 Economic Outlook (OECD, 2010) also focused on the urgent need for fiscal consolidation and structural reforms (in, for example, labour and product markets), pointing out that in both OECD and non-OECD countries the economic slack was disappearing and recovery taking hold rapidly. While these positions generally focused on higher-income countries, they also urged fiscal adjustment in developing countries, given that the risk of debt distress was increasing there too. However, as the global policy reversal was completed, it became apparent that recovery was not under way in the world’s largest economies. Instead a pattern of slow growth and persistent unemployment seemed to settle in, partly due to fiscal consolidation itself.
Thus the second phase of the crisis, beginning in 2010, saw a total policy reversal, a 180-degree shift in
10
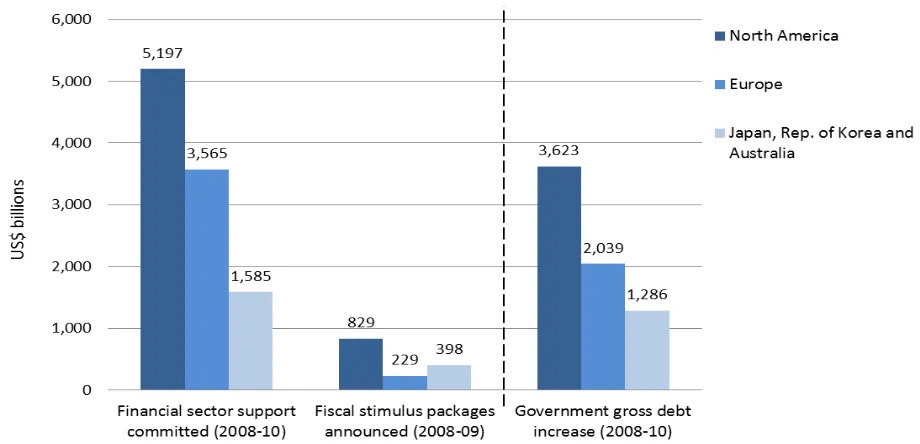
Figure 5: Support for the Financial Sector, Fiscal Stimulus Packages and Public Debt Increases, selected high income countries, 2008-10 (US$ billions)
Note: North America includes United States and Canada; Europe includes Austria, Belgium, Finland, France, Germany, Greece, Ireland, the Netherlands, Poland, Portugal, Spain, Sweden and the United Kingdom
Sources: ILO 2014, based on IMF, 2010c; IMF, 2013; Stolz and Wedow, 2010
The reasons for the quick, deep and prolonged cuts to public spending in developing countries are less clear. The IMF’s role in influencing policy through surveillance appears as a main contributing factor (Islam et al 2012; Molina 2010; Van Waeyenberge, Bargawi and McKinley 2010; Weisbrot and Montecino 2010).4
Numerous studies highlight the fallacious basis of austerity programs (CESR 2012, ILO 2012 and 2014, Krugman 2012, Stiglitz 2012, UNCTAD 2011b, United Nations 2013, Weisbrot and Jorgensen 2013, etc.). In the short term, austerity depresses incomes and hinders domestic demand, harming economic activity and employment and ultimately undermining recovery efforts. In the long term, as unemployment and excess capacity persist, potential output may decrease. Even recent research at the IMF acknowledges that fiscal consolidation has adverse effects on both short and long-term unemployment, private demand and GDP growth, with wage-earners hurt disproportionately more than profit- and rent-earners (Guajardo, Leigh and Pescatori 2011; Ball, Leigh and Loungani 2011). Furthermore, IMF Chief Economist Olivier Blanchard admitted to serious underestimation of these negative effects in calculations used to argue in favor of fiscal contraction (Blanchard and Leigh 2013). However, IMF operations have not yet reflected these findings.
In both high-income and developing countries, there is a strong need to continue countercyclical policies and higher public spending to avert recession, revitalize the economy, generate productive employment, support development needs and repair the social contract. The present contractionary policy stances fall short of what is needed for economic recovery and addressing the jobs crisis. Employment creation is
4 It is important to note that few governments actually have IMF programs, and the IMF’s influence of global and national policy
11
associated with a different set of macroeconomic policies that promote investment in productive capacities and growth of aggregate demand, coupled with adequate social policies (Epstein 2009; ILO 2009a, 2010a, 2010b and 2012; Ocampo and Jomo 2007; Pollin, Epstein and Heintz 2008; United Nations 2009a and 2013; UNCTAD 2011a and 2011b; Weeks and McKinley 2007). Further, the focus on fiscal balances deviates public attention from the unsolved root cause of the crisis, which is excessive deregulation of financial markets, as well as from logical global solutions, like a sovereign debt workout mechanism that deals fairly with both lenders and borrowers (UNCTAD 2011a). The United Nations (2009a, 2009b, 2012 and 2013) has repeatedly called for forceful and concerted policy action at the global level to promote employment-generating growth, financial market stability and support development.
3. Main Adjustment Measures Considered, 2010-2015
3.1 Methodology
How are governments achieving fiscal adjustment? And what are the main adjustment measures that have direct social impacts? To answer these questions, this section looks at policy discussions and other information contained in IMF country reports, which cover Article IV consultations, reviews conducted under lending arrangements (e.g. Stand-by Arrangements and Extended Credit Facility), consultations under non-lending arrangements (e.g. Staff Monitored Programs) and other publicly available IMF reports. In total, this section reviews all 616 reports that appeared between February 2010 and February 2015 covering 183 countries (see Annex 3 for details). Two caveats must be kept in mind. First, the
findings are solely based on the authors’ interpretation of information contained in IMF country reports. Secondly, to the extent that measures eventually adopted by governments may differ from those under consideration in IMF country reports, this analysis is only indicative, and actual outcomes require verification.
3.2 Results
3.2.1 Global Adjustment Trends
12
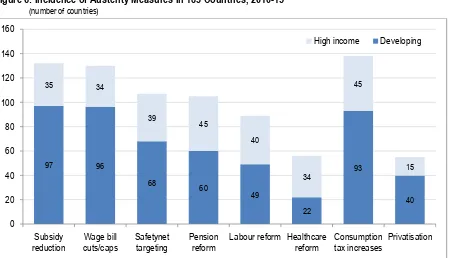
Figure 6: Incidence of Austerity Measures in 183 Countries, 2010-15 (number of countries)
Source: Authors’ analysis of 616 IMF country reports published from February 2010 to February 2015
The most commonly considered measures to contain or reduce government expenditure include:
Eliminating or reducing subsidies: Overall, 132 governments in 97 developing and 35 high-income countries appear to be limiting subsidies, predominately on fuel, but also on electricity, food and agricultural inputs, which makes this the most widespread adjustment measure.
Cutting or capping the wage bill: As recurrent expenditure, like salaries, tend to be the largest component of national budgets, an estimated 130 countries are considering reducing their wage bill, which is often carried out or planned as a part of civil service reforms. In total, 96 developing and 34 high-income countries are considering this policy stance.
Rationalizing and/or further targeting social safety nets: The review indicates that 107 governments in 68 developing and 39 high-income countries are considering rationalizing spending on safety nets and welfare benefits, often by revising eligibility criteria and targeting to the poorest, which is a de facto reduction of social protection coverage.
Reforming old-age pensions: Approximately 105 governments in 60 developing and 45 high-income countries are discussing different changes to their pension systems, such as raising contribution rates, increasing eligibility periods, prolonging the retirement age and/or lowering benefits, among others.
Labour flexibilization reforms: These generally include revising the minimum wage, limiting salary adjustments to cost of living standards, decentralizing collective bargaining and increasing the ability of enterprises to fire employees. Some 89 governments in 49 developing and 40 high-income countries are considering some form of labour flexibilization.
97 96
68 60
49
22
93
40
35 34
39
45
40
34
45
15
0 20 40 60 80 100 120 140 160
Subsidy reduction
Wage bill cuts/caps
Safetynet targeting
Pension reform
Labour reform Healthcare reform
Consumption tax increases
13 Healthcare system reforms: These are being considered by 56 governments in 22 developing and 34 high-income countries and can include raising fees and co-payments for patients as well as introducing cost-saving measures in public healthcare centers.
At the same time, commonly adopted measures to increase government revenues are:
Increasing consumption taxes on goods and services: This can be achieved either through increasing or expanding VAT rates or sales taxes or by removing exemptions. Some 138 governments in 93 developing and 45 high-income countries are employing some form of change to their consumption-based taxes, making this the most prominent revenue side being considered in response to fiscal pressure.
Privatization of public assets and services: This is another option being pursued to increase short-term revenues which, according to IMF reports, is being considered by 55 governments in 40 developing and 15 high-income countries.
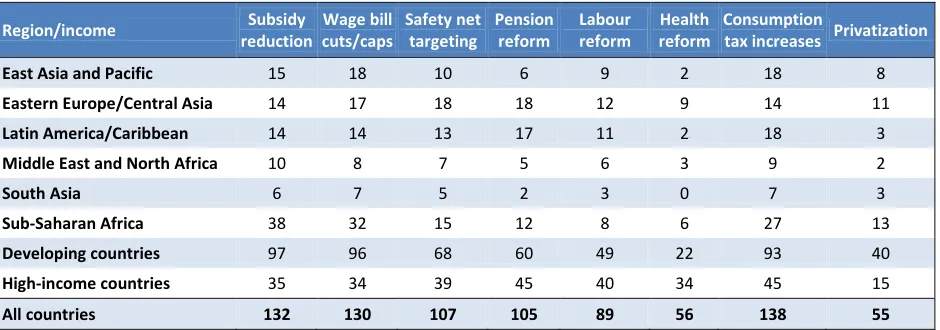
Contrary to public perception, an examination of IMF country reports indicates that austerity measures are not limited to Europe. In fact, many adjustment measures emerge more frequently in developing countries (Tables 4 and 5). For instance, while pension and labour reforms are dominant in high-income countries, developing countries exhibit a higher incidence of wage bill cuts/caps and lower subsidies. In contrast, consumption tax increases and privatization are equally common in both groups.
Table 4: Main Adjustment Measures by Region, 2010-15 (number of countries)
Region/income Subsidy
reduction
Wage bill cuts/caps
Safety net targeting
Pension reform
Labour reform
Health reform
Consumption
tax increases Privatization
East Asia and Pacific 15 18 10 6 9 2 18 8
Eastern Europe/Central Asia 14 17 18 18 12 9 14 11
Latin America/Caribbean 14 14 13 17 11 2 18 3
Middle East and North Africa 10 8 7 5 6 3 9 2
South Asia 6 7 5 2 3 0 7 3
Sub-Saharan Africa 38 32 15 12 8 6 27 13
Developing countries 97 96 68 60 49 22 93 40
High-income countries 35 34 39 45 40 34 45 15
All countries 132 130 107 105 89 56 138 55
Source: Authors’ analysis of 616 IMF country reports published from February 2010 to February 2015
Another interesting finding relates to the scale of austerity measures being adopted by individual countries. Overall, at least two policy options are being discussed in 169 countries, three or more in 145 countries, four or more in 122 countries, five or more in 91 countries, six or more in 56 countries and seven or more in 15 countries: Barbados, Belarus, Belgium, Bulgaria, Croatia, Cyprus, Czech Republic, Egypt, Fiji, France, Greece, Hungary, Iceland, India, Ireland, Italy, Jamaica, Jordan, Kuwait, Latvia, Lebanon, FYR Macedonia, Malta, Moldova, Montenegro, Netherlands, Palau, Poland, Portugal, Romania, Russia, Serbia, Slovak Republic, Slovenia, Spain, Turkey, Tuvalu and the United Kingdom. On the other side of the spectrum, only seven countries in the world appear not to be contemplating any type of adjustment based on information from their latest IMF country reports. This list includes Aruba, Equatorial Guinea, Hong Kong China, Rwanda, South Sudan, Syria and Uzbekistan.
14
2012) including labour reforms, pension reforms and healthcare reforms. Three adjustment measures became slightly less frequent (reducing subsidies, rationalizing/targeting safety nets and privatizations).
Table 5: Main Adjustment Measures by Region, 2010-15
(percentage of countries)
Region/income Subsidy
reduction
Wage bill cuts/caps
Safety net targeting
Pension reform
Labour reform
Health reform
Consumption
tax increases Privatization
East Asia and Pacific 62 62 24 29 29 10 76 19
Eastern Europe/Central Asia 53 84 58 68 53 32 47 26
Latin America/Caribbean 42 53 37 74 58 11 58 11
Middle East and North Africa 100 75 50 50 75 13 75 13
South Asia 71 71 43 29 29 0 86 29
Sub-Saharan Africa 74 62 24 24 19 14 55 14
Developing countries 65 66 34 42 37 15 61 17
High-income countries 47 51 51 70 72 51 55 23
All countries 59 61 40 51 48 26 59 19
Source: Authors’ analysis of 616 IMF country reports published from February 2010 to February 2015
Figure 7: Main adjustment measures, 2010-12 and 2012-2015 (number of countries)
Source: Authors’ analysis of 616 IMF country reports published between February 2010 and February 2015
The next sections present the incidence of adjustment measures in high income countries and geographic regions, focusing on recent trends (2012-15). For an analysis of the earlier period (2010-12), see The Age of Austerity: A Review of Public Expenditures and Adjustment Measures in 174 Countries.
0 20 40 60 80 100 120
Subsidy reduction
Wage bill cuts/caps
Safety net targeting
Pension reform
Labour reform Healthcare reform
Consumption tax increases
15 3.2.2 Adjustment measures in high-income countries
Labour and pension reforms are the most common among the range of austerity measures that high-income countries are considering or have adopted since 2012. As many as 38 countries are considering labour market reforms, including measures to reduce the tax wedge (e.g. Austria, Belgium, Iceland and Slovakia), limiting wage indexation (e.g. Belgium, Cyprus), increase employment flexibility (e.g. Chile, Norway), reform collective bargaining (e.g. Slovakia, Spain, Sweden), and contain minimum wages (Latvia).
About 37 countries are considering pension reforms, such as raising the retirement age, discouraging early retirement, limiting or freezing benefits, increasing taxes or reducing tax exemptions on pension income and increasing employee contributions. These measures are being discussed in the majority of European countries and beyond. For instance, Antigua and Barbuda and Kuwait are weighting to reform their pension systems; Russia, to increase to 40 the number of contribution years required for a minimum wage recipient to to claim benefits.
In addition, 29 countries are considering increases in VATs or removing exemptions, including for basic items, such as Croatia, Israel, Japan, Luxembourg, the Netherlands and Spain.
Healthcare reforms feature prominently in 27 countries, such as Austria, Belgium, Canada, Croatia, France, Germany, Iceland, Japan, the Netherlands and New Zealand, generally focusing on contain healthcare spending by rationalizing benefits and improving efficiency in the health sector.
About 27 countries are considering cuts/caps in the public-sector wage bill (e.g. Canada, France, Finland, Malta, Slovenia) and a similar number rationalizing safety nets, reducing both benefits and beneficiaries, adopting more narrow-targeted approaches (e.g. Belgium, Cyprus, Greece, Russia, Spain, Trinidad and Tobago).
Privatizations are in the agenda of 12 countries, such as Latvia (banking), Malta (utilities), Portugal (airports, postal services), Russia (banking), Slovak Republic (telecommunications) and Slovenia (banking).
Table 6: Adjustment Measures in High-Income Countries, 2012-15
Country Subsidy
reduction
Wage bill cuts/caps
Safety net targeting
Pension reform
Labour reform
Health reform
Consumption
tax increases Privatization
Antigua and Barbuda
•
•
Australia
•
Austria
•
•
•
•
•
Bahamas
•
•
•
•
Barbados
•
•
•
•
Belgium
•
•
•
•
•
•
•
Canada
•
•
•
•
Chile
•
Croatia
•
•
•
•
•
•
•
Curaçao
•
•
•
•
•
•
Cyprus
•
•
•
•
•
•
•
Czech Republic
•
Denmark
•
•
•
•
•
Equatorial Guinea
Estonia
•
Finland
•
•
•
•
16
Country Subsidy
reduction
Wage bill cuts/caps
Safety net targeting
Pension reform
Labour reform
Health reform
Consumption
tax increases Privatization
Germany
•
•
•
Greece
•
•
•
•
•
•
•
•
Hong Kong
I.
Iceland
•
•
•
•
•
•
Ireland
•
•
•
•
•
•
Israel
•
•
•
•
Italy
•
•
•
•
•
•
Japan
•
•
•
•
Korea
•
•
•
•
•
•
Kuwait
•
•
•
•
•
•
Latvia
•
•
•
•
Lithuania
•
•
Luxembourg
•
•
•
•
•
Macao
•
Malta
•
•
•
•
•
•
Netherlands
•
•
•
•
New Zealand
•
•
•
•
Norway
•
•
•
•
•
Poland
•
•
•
•
•
•
Portugal
•
•
•
•
•
•
•
•
Qatar
•
Russia
•
•
•
•
•
•
San Marino
•
•
•
•
•
•
Saudi Arabia
•
•
•
•
•
•
Singapore
Slovak Republic
•
•
•
•
•
Slovenia
•
•
•
•
•
•
•
•
Spain
•
•
•
•
•
•
St. Kitts and Nevis
•
•
•
•
Sweden
•
Switzerland
•
•
•
Trinidad and Tobago
•
•
•
•
United Arab Emirates
•
•
•
United Kingdom
•
•
•
•
•
United States
•
•
•
•
Uruguay
Total 25 27 27 37 38 27 29 12
Source: Authors’ analysis of 284 IMF country reports published between September 2012 and February 2015
3.2.3 Adjustment Trends in East Asia and the Pacific
Subsidy reduction and cuts/caps to the public-sector wage bill dominate the list of austerity measures for the East Asia and Pacific region, together with raising consumption taxes.
Subsidy reform is being considered by 13 countries, such as Fiji, Indonesia, Malaysia, Myanmar, Timor-Leste and Thailand. While energy subsidies or subsidies to state-owned utility companies are the main focus, other reforms include cuts to copra subsidies to help low-income farmers on remote islands in Kiribati and to low-income housing subsidies in the Philippines.
About 13 countries are considering cuts/caps to the public wage bill (e.g. most of the Pacific islands, Laos, Malaysia, Timor-Leste and Vietnam).
17
Tuvalu). While Kiribati has already introduced a new VAT, Malaysia is planning to introduce a goods and services tax in 2015 with Myanmar and Timor-Leste planning the same.
At the same time, Fiji, the Marshall Islands, Micronesia and Palau are considering pension reforms, and Malaysia, Mongolia and Tuvalu are narrowing social protection schemes. Labour market reforms are also on the agenda in at least six countries in the region, Cambodia, China, Indonesia, Timor-Leste and Tuvalu.
Table 7: Adjustment Measures in East Asia and the Pacific, 2012-15
Country reductionSubsidy Wage bill cuts/caps Safety net targeting Pension reform Labour reform Health reform Consumption tax increases Privatisation
Cambodia
•
•
•
China
•
•
Fiji
•
•
•
•
•
Indonesia
•
•
•
•
Kiribati
•
•
•
•
Lao PDR
•
•
Malaysia
•
•
•
•
•
Marshall Islands
•
•
•
•
Micronesia
•
•
•
•
Mongolia
•
•
•
Myanmar
•
•
•
Palau
•
•
•
•
•
Papua New Guinea
Philippines
•
•
Solomon Islands
•
Thailand
•
•
Timor-Leste
•
•
•
•
Tonga
•
•
Tuvalu
•
•
•
•
•
•
•
Vanuatu
•
•
Vietnam
•
Total 13 13 5 6 6 2 16 4
Source: Authors’ analysis of 284 IMF country reports published between September 2012 and February 2015 3.2.4 Adjustment Trends in Eastern Europe and Central Asia
Wage bill cuts/caps, pension reforms and rationalizing safety nets feature most prominently across Eastern Europe and Central Asia.
Wage bill cuts/caps are discussed in the IMF country reports in Armenia, Belarus, Hungary, Kazakhstan, Macedonia, Moldova, Montenegro, Poland, Russia, Serbia and Ukraine. For example, Serbia undertook a 10 per cent public sector wage cut while Macedonia implemented a freeze on public-sector wages and new hirings to achieve savings in the wage bill.
18
Safety net rationalization is considered in 11 countries and the phasing out of subsidies is prominent in 10 countries—including cuts to energy subsidies, agricultural subsidies and transfers to state-owned enterprises and utilities—across the region. Both of these options appear in Azerbaijan, Serbia and Ukraine.
Labour market reforms, such as improving flexibility in hiring and wage bargaining, is reported in the policy discussions of 10 countries such as Hungary, Poland, Turkey, Serbia and Montenegro. To cite one example, Kosovo reduced the maternal leave period in 2012.
Lastly, privatization is being considered in various areas like energy (Albania, Armenia, Romania), aluminum (Montenegro) and socially-owned enterprises (Serbia).
Table 8: Adjustment Measures in Eastern Europe and Central Asia, 2012-15
Country Subsidy
reduction
Wage bill cuts/caps
Safety net targeting
Pension reform
Labour reform
Health reform
Consumption
tax increases Privatisation
Albania
•
•
•
Armenia
•
•
•
Azerbaijan
•
•
•
Belarus
•
•
•
•
Bosnia
•
•
Bulgaria
•
•
•
•
•
•
Georgia
Hungary
•
•
•
•
•
•
•
Kazakhstan
•
•
•
Kosovo
•
•
Kyrgyz Republic
•
•
•
•
•
Macedonia
•
•
•
Moldova
•
•
•
•
•
•
•
Montenegro
•
•
•
•
•
Romania
•
•
•
•
•
•
•
•
Serbia
•
•
•
•
•
•
•
Turkey
•
•
•
•
•
•
Ukraine
•
•
•
•
•
•
Uzbekistan
Total 10 16 11 13 10 6 9 5
Source: Authors’ analysis of 284 IMF country reports published between September 2012 and February 2015
3.2.5 Adjustment Trends in Latin America and the Caribbean
In Latin-American and the Caribbean, adjustment measures largely center on pension, labour, wage bill and subsidy reforms; a number of countries are also increasing consumption taxes.
Belize, Costa Rica, El Salvador, Grenada, Guyana, Jamaica, Mexico, Nicaragua, Paraguay, Peru, and St. Vincent and the Grenadines discussing pension reforms.
Policy discussions on labour market reforms have focused on reducing regulations, keeping minimum wages low, and increasing flexibility in working arrangements, hiring practices, wage bargaining and contracts. For example, Colombia is considering containing the pace of growth of the minimum wage and Suriname relaxing employment protection regulations.
19
2016, El Salvador is considering to increase its VAT to 15 per cent and Suriname planning to introduce a new VAT tax.
Subsidy reform affects eight countries across the region. This includes El Salvador (electricity), Suriname (electricity and water), Guyana (electricity), Bolivia (fuel), Paraguay (electricity and water) and Nicaragua (electricity).
Containing the public-sector wage bill is another frequently mentioned austerity measure affecting Belize, Costa Rica, El Salvador, Grenada, Jamaica, Mexico and Suriname among others.
Privatizations are being considered in The Bahamas (energy and water sectors), Colombia (energy), Haiti (telecommunications), Jamaica (public services) and Paraguay (public utilities).
Table 9: Adjustment Measures in Latin America and the Caribbean, 2012-15
Country Subsidy
reduction
Wage bill cuts/caps
Safety net targeting
Pension reform
Labour reform
Health reform
Consumption
tax increases Privatisation
Belize
•
•
•
•
•
Bolivia
•
•
•
Brazil
•
•
Colombia
•
•
•
•
Costa Rica
•
•
•
•
•
Dominica
•
El Salvador
•
•
•
•
•
Grenada
•
•
•
•
•
Guatemala
•
Guyana
•
•
Haiti
•
•
•
•
Jamaica
•
•
•
•
•
Mexico
•
•
Nicaragua
•
•
•
•
•
Panama
•
Paraguay
•
•
•
•
•
Peru
•
•
St. Vincent
•
•
•
Suriname
•
•
•
•
•
Total 8 10 7 14 11 2 11 2
Source: Authors’ analysis of 284 IMF country reports published between September 2012 and February 2015 3.2.6 Adjustment Trends in the Middle East and North Africa
Subsidy reform is the key adjustment measure in the Middle East and North Africa region, as all countries are under pressure to reform their energy and, in some cases, food and other subsidies. Algeria, Egypt, Iran, Jordan, Lebanon, Morocco, Tunisia and Yemen are considering to reduce subsidies and to provide fuel at market prices. Egypt, Jordan and Morocco also have substantial food subsidy programs, which are a key component of their social protection systems and under the reform discussion.
20
Regarding consumption taxes, Egypt plans to replace its current sales tax with a VAT regime, Iran is bringing forward a planned increase from 6 to 8 per cent, and Algeria is considering to limit exemptions.
Table 10: Adjustment Measures in the Middle East and North Africa, 2012-15
Country reductionSubsidy Wage bill cuts/caps Safety net targeting Pension reform Labour reform reformHealth Consumption tax increases Privatisation
Algeria
•
•
•
•
Egypt
•
•
•
•
Iran
•
•
•
•
•
Jordan
•
•
•
•
•
•
Lebanon
•
•
•
•
•
Morocco
•
•
•
•
•
Tunisia
•
•
•
•
•
Yemen
•
•
Total 8 6 4 4 6 1 6 1
Source: Authors’ analysis of 284 IMF country reports published from September 2012 to February 2015
3.2.7 Adjustment Trends in South Asia
Subsidy reform and cutting the public-sector wage bill are key austerity measures considered or adopted in South Asia.
Five countries in the region have large energy and food subsidies and are currently in the process of reforming them. Bangladesh, India, Nepal, Pakistan and Sri Lanka have cut fuel subsidies through adjustments of prices and tariffs and by reducing transfers to state-owned fuel companies and utilities that sell at capped prices. Bangladesh, India and Sri Lanka have already cut subsidies and raised fuel prices substantially since 2013. Pakistan has started an ambitious program that is expected to reduce subsidies from about 1.8 per cent of GDP to 0.3-0.4 per cent of GDP over a three-year period.
The public sector wage bill is under scrutiny in Afghanistan, Bhutan, India, Nepal and Pakistan. Afghanistan is pursuing wage restraint even as it attempts to expand public services in order to meet its commitments toward the Millennium Development Goals (MDGs). Bhutan instituted a new Pay Commission in 2014 to recommend wage adjustments in the public sector. Nepal introduced a hiring freeze in 2012. Pakistan is considering a civil service reform to improve the quality of the public service, reduce corruption and contain the wage bill.
Six countries are considering increasing consumption taxes. Sri Lanka is considering to extend VAT to more sectors in order to broaden the tax base; Bhutan is considering to remove sales tax exemptions for basic items and to introduce a VAT. Similarly, Afghanistan aimed to introduce a VAT in 2014 and India is planning to introduce a goods and services tax in 2015.
Privatizations are being considered in Afghanistan (banking sector) and in Pakistan, where 65 public enterprises have been approved for privatization by the Council of Common Interest.
21
Table 11: Adjustment Measures in South Asia, 2012-15
Country Subsidy
reduction
Wage bill cuts/caps
Safety net targeting
Pension reform
Labour reform
Health reform
Consumption
tax increases Privatisation
Afghanistan
•
•
•
Bangladesh
•
•
•
Bhutan
•
•
India
•
•
•
•
•
•
Nepal
•
•
•
•
•
Pakistan
•
•
•
•
Sri Lanka
•
•
Total 5 5 3 2 2 0 6 2
Source: Authors’ analysis of 284 IMF country reports published from September 2012 to February 2015
3.2.8 Adjustment Trends in Sub-Saharan Africa
Subsidy reform and wage bill cuts/caps are the main adjustment measures being considered across Sub-Saharan Africa, followed by consumption tax increases, further targeting and pension reform.
Removing subsidies is prevalent in more than 30 countries, such as Angola, Burundi, Comoros, Gabon, Madagascar, Mauritania, Senegal, Sudan and Tanzania. Reforms focus on energy subsidies and in some cases, food and agricultural subsidies (usually for agricultural inputs such as fertilizer). Gabon eliminated most industrial diesel subsidies in January 2014 as did Mauritania. Burkina Faso has increased prices for butane while Tanzania increased electricity prices. Ghana raised electricity and water tariffs (the former by 60 per cent). Zambia raised retail fuel prices in May 2013 by an average of almost 22 per cent, which generated savings for the government of about 1.2 per cent of GDP. Many of these countries are also considering to cut transfers to state-owned electricity companies, which cover the shortfalls from setting tariffs below cost-recovery prices (e.g. Comoros, Mauritania, Senegal). Aside from fuel subsidies, other subsidies are also being targeted, such as for maize and agricultural inputs in Zambia.
The removal of universal subsidies is often accompanied by a safety net consisting of cash transfers that are narrowly targeted to the poorest. For example, policy discussions contained in IMF Angola country
reports focus on reducing fuel subsidies that benefit all Angolans and instead introduce ―a well-targeted conditional cash transfer scheme to protect the less fortunate with a subsidy amount of 50% of the poverty line [that] would cost on an annual basis around ½% of GDP, one eighth of the current level of spending
on fuel subsidies‖. Madagascar is phasing out its fuel subsidies that support all citizens but only the
poorest are to be compensated by a small targeted urban transport subsidy.
Table 12: Adjustment Measures in Sub-Saharan Africa, 2012-15
Country Subsidy
reduction
Wage bill cuts/caps
Safety net targeting
Pension reform
Labour reform
Health reform
Consumption
tax increases Privatisation
Angola
•
•
Benin
•
•
•
Botswana
•
•
•
•
•
•
Burkina Faso
•
•
Burundi
•
•
•
•
•
Cabo Verde
•
•
Cameroon
•
Chad
•
Comoros
•
•
•
•
Congo
•
Congo, Rep.
•
•
•
22
Country Subsidy
reduction
Wage bill cuts/caps
Safety net targeting
Pension reform
Labour reform
Health reform
Consumption
tax increases Privatisation
Ethiopia
•
•
•
Gabon
•
•
•
Gambia
•
•
•
Ghana
•
•
•
•
Guinea
•
•
Guinea Bissau
•
•
Kenya
•
•
•
Lesotho
•
Liberia
•
•
Madagascar
•
•
Mali
Mauritania
•
•
•
•
•
Mauritius
•
•
•
•
Mozambique
•
•
•
•
Namibia
•
•
•
Nigeria
•
•
•
•
•
Rwanda
São Tomé
•
Senegal
•
•
•
•
•
Seychelles
•
Sierra Leone
•
South Africa
•
•
•
•
South Sudan
Sudan
•
•
•
•
Swaziland
•
•
Tanzania
•
•
•
•
Togo
•
•
•
•
•
Uganda
•
•
•
Zambia
•
•
•
•
Zimbabwe
•
•
•
•
•
Total 31 26 10 10 8 6 23 6
Source: Authors’ analysis of 284 IMF country reports published from September 2012 to February 201
Containing the wage bill is the second most common austerity measure in Sub-Saharan Africa (26 countries). This affects some of the poorest countries struggling to deliver public services in health and education, such as Benin, Comoros, Ethiopia, Kenya, Nigeria, São Tomé and Principe, Togo and Zambia.
Ethiopia’s 2013 Article IV report notes that ―the restraining of recurrent spending has taken place across
all the sectors, with notable decline in the ratios of current spending-to-GDP in the education and health
sectors, reflecting public sector wage restraint dur