Introduction
The end of the 20th century was closed with record-breaking level of mergers and largest ac-quisitions since Dollar value of mergers around the world reached USD 2.3 billion in 1999 and the average merger grew over 20% between 1985 and 1999, where most of the activities were strategic measures as the companies held mergers and acquisitions of other companies engaged in different industries to enter new market and expand their businesses (Martin and
Sayrak, 2003). Business diversification is the
company’s effort to engage in multiple business lines or expand its business in different
indus-tries, therefore the company seeks benefits from
the economies of scale and economies of scope when operating in diverse industries (Teece,
1982). On the other hand, diversification can
also be followed by internal governance costs while managing the company with many busi-ness lines (Roberts and Milgrom, 1995; Rajan et al., 2000).
Several previous studies have tried to
ex-amine the correlation between diversification
and company’s performances, but the empirical evidences are still contradictive. The results of Stulz (1990), Lang and Stulz (1994), Berger and Ofek (1995), Servaes (1996), Lins and Servaes (1999), Rajan et al. (2000), Campa and Kedia (2002), and Martin and Sayrak (2003) found
a negative correlation between diversification
and company’s performances. Meanwhile, the results of Maksimovic and Phillips (2002), Gomes and Livdan (2004) as well as Santalo and Becerra (2008) found a positive correlation
*Gedung Departmen Manajemen FEUI, Kampus Baru UI Depok, 16424, Indonesia, E-mail: [email protected] **Gedung Departemen Manajemen FEUI, Kampus Baru UI Depok, 16424, Indonesia, E-mail: [email protected]
Listed Firms
Ony Humarseno* and Dony Abdul Chalid**
Department of Management, Faculty of Economics and Business, Universitas Indonesia
This study analyzes the correlation between business diversification and performances in Indone -sian listed companies from 2006-2011. In addition to observing business diversification impact on company’s performance in term of Return on Assets (ROA) and Tobin’s Q, this research also observes the business diversification impact on the performances of different companies at different level. The result of this research indicates that diversification gives negative effect to ROA and Tobin’s Q, while for higher level of diversification, the effect on Tobin’s Q is relatively high. The negative effect of di -versification on ROA is higher in the group of companies with higher ROA. The different results show that when using Tobin’s Q as a measure of companies’ performances, diversification gives negative impact to companies’ performance in the intermediate level.
between diversification and company perfor
-mances. Recent research has tried to find the difference in correlation between diversifica -tion and performances in different companies. For example, Lee and Li’s study (2001), which
saw the correlation between diversification and
performances is not linear or inconsistent on different level of company’s performances. The
result shows that diversification was negatively
related to Return on Equity (ROE) when the company posted good performance and gave positive correlation to ROE when the compa-ny posted poor performances. They assumed
a negative correlation between diversification
and company’s performance disappears and be-come positive as poor company’s performance.
This research aims at reexamining the
diver-sification effects to company’s performances by
using developing country context such as Indo-nesia. Most of previous studies used developed countries context, thus the research in develop-ing countries could enrich knowledge of
corre-lation between diversification and performance (Yiu et al., 2005). There are many diversified
companies in Indonesia, and the decision to
ap-ply diversification strategy is important consid -ering that there are some conglomerate groups in Indonesia that play major role in the national economy.
In Indonesia, the study about diversification
effect is still limited; one of them was
conduct-ed by Harto (2005), who found that diversifica -tion could reduce company’s value. However the study only observed linear correlation
be-tween diversification and company’s perfor -mances. This research attempted to close the gap, by looking at the possibility of non-linear
correlation between diversification and perfor -mances and ignore that in certain performance range there is different correlation at certain performance levels.
Literature Review
Previous studies tried to observe the
diversi-fication effects to company’s performance. One
of the arguments stated there is positive impact
of diversification to the company, the diversifi -cation make the company able to create internal
capital market. Diversified company is more efficient in allocating resources as it is able to
generate internal capital market and make more
efficient resources allocation (Weston, 1970)
and able to reduce investment shortage (Stulz,
1990). Another argument is a diversified firm is more efficient (Chandler, 1997) and more
productive compared to a company focusing on
one area. They concluded that diversification
did not disturb company’s value (Maksimovic and Phillips, 2002; Gomes and Livdan, 2004)
On the other hand, diversification also con -tained some disadvantages that have been found by researchers. In term of capital
allo-cation, Stulz (1990) assumed that diversified
company invested too much in low investment opportunity business lines. In accordance with
the statement, Jensen (1971) stated that more diversified companies invested in unprofitable
projects. Scharfstein and Stein (2000) argued
that by operating in many business lines, a firm
can increase costs as increasing incentives for managers.
Rajan et al. (2000) argued that agency cost model can explain investment deviation in
di-versified companies. Then according to Meyer et al. (1992), there is an influence of cost as a
result of division manager who tries to affect to management to allocate resources to the di-vision, it’s considered to increase company’s costs.
Moreover, Lang and Stulz (1994) found
that diversified companies have lower Tobin’s
Q mean and median than focused companies.
They also found that diversification has a
negative correlation with the company
perfor-mances. It is inferred based on their findings that diversified companies have lower perfor -mance than focused companies. They assumed
that diversified companies seek growth by di -versifying as there is no more growth in their businesses. Lang and Stulz (1994) also added
that diversified companies in the related busi -ness activity are able to use their current skills.
Therefore, these firms have comparative advan -tages in their business activities, while
diver-sified companies non-related activities do not
Meanwhile, Berger and Ofek (1995) found
that diversification reduced company’s value. They argue diversified companies have lower profitability than focused companies. They also
found that excess investment related to lower
diversified companies and business segment of diversified companies more frequently spent
excess investment than a company with one business line. Berger and Ofek (1995) also add-ed the subsidy in the lower segments as value
reduction suffered by diversified companies.
In addition, Martin and Sayrak (2003)
con-cluded that diversification destroys shareholders value. It was based on previous studies' findings have outlined, which diversification reduces
company’s value, and it disserves shareholders. This conlusion is supported by some evidences,
such as diversified companies tend to have low
-er Tobin’ Q value, div-ersified companies traded
up to 15% discount when compared to focused companies value, and the stock market tends to well respond over an increase in focused
com-panies. They also said diversified companies'
low performances are motored by capital
mis-allocation. They assumed it is caused by ineffi -cient internal fund raising allocation or agency problems. The misallocation also made cross-subsidies, where the company’s investment in
a weak division was supported by cash flows
from a stronger division.
However, there are also other studies which
found that diversification can improve com -pany’s performances, but at a certain point it actually degrade company’s performance. Qian
et al. (2008) showed that regional diversifica -tion has a positive effect on company’s perfor-mances at the secondary level, after that it gave negative effect. They also found that developed countries can maximize their performance if their diversify into a number of developed countries and restrain a number of developing countries. As for market potential problems, in-frasructure, and economic development, these differences are important to be considered among developing regions. Costs and risks can be a problem if the company operates in devel-oping regions. Researchers such as Borghesi et
al. (2007) found that the company’s decision to
diversify can have different impact on
compa-ny’s value, depending on age of the company. The result indicated that the major company in stagnant industry has more advantages by
con-ducting diversification.
The other study was conducted by Lee and
Li (2012), who tried to find the correlation between diversification and company’s per -formances in different level of per-formances. They found that negative correlation occured in the high performance companies, while for low performance companies, the correlation is positive. They assume that negative
corre-lation between diversification and company’s
performance in high performance companies is in accordance with the assumption that high
performance companies, which are profitable
companies, are better to maintain their market niche rather than diversify. Meanwhile, posi-tive correlation on low performance companies indicated that companies in declining phase can increase their income by diversifying and
expanding to seek benefit from economies of
scale and economies of scope.
Research Method
Data and sample
The sample used in this study are listed com-panies in Indonesia Stock Exchange in
2006-2011 and not operating in the financial sector.
The companies must also report their business segments with two digit minimum code of North
American Industry Classification (NAICS)
Research model and variables
This study uses quantitative data analysis for panel data. There are two main models, the
first model is used to see the relationship be
-tween diversification and company performace
and the second model is used to examine linear
relationship between diversification and per -formance. Each model uses two performance measures such as ROA and Tobin’s Q. The
specifications for both models are as follow:
Model 1.1
ROAit = β0 + β1DIVit + β2(SIZE)it + β3(DEBT)it + β4(EBIT/ Sales)it+β5(Capex/Sales)it
+ ui 1)
Model 1.2
Tobin’s Qit = β0 + β1DIVit + β2(SIZE)it
+ β
3(DEBT)it + β4(EBIT/Sales)it +β5(Capex/Sales)it + uit 2)
Model 2.1
ROAit = β0 + β1DIV
2
it + β2(SIZE)it
+ β
3(DEBT)it + β4(EBIT/ Sales)it +β5(Capex/Sales)it + uit 3)
Model 2.2
Tobin’s qit = β0 + β1DIV
2
it + β2(SIZE)it
+ β
3(DEBT)it + β4(EBIT/ Sales)it
+β
5(Capex/Sales)it + uit 4)
Meanwhile, the third model is used to exam-ine whether the performance level affects the
correlation of diversification and perfomance.
This model will be estimated by using quantile
regression. The spesification of third model is
as follow:
Model 3.1
ROAit = αit+ βn Xit + uit 5)
QROA(τ|X) = α(τ) + βn(τ)X 6)
where the X is independent variables (DIV, SIZE, DEBT, EBIT/sales and Capex/Sales) that
used in this research and QROA(τ|X) described conditional quantile of ROA to τ, which is as-sumed to depend (nearly dependent) on X.
Model 3.2 is used to observe diversifica -tion effect on company’s performance based on Tobin’s Q value of the company, which will be estimated using quantile regression. The quan-tile regression method developed by Koenker
and Basset (1978) by publishing a journal enti -tled “Quantile Regression”. Koenker and
Bas-set (1978) argued that this method could esti -mate linear correlation between the indepedent variables X and certain quantile of dependent variables Y. Therefore, based on Hasibuan (2010) this method allows researchers obtain diferent marginal effect for each quantile. This method can be used to analyze not normal data distribution. It is also an advantage compared to least square method.
Model 3.2
Tobin’s Qit = αit+ βnXit + uit 7)
QTobin’s Q(τ|X) = α(τ) + βn(τ)X 8)
Research variables
ROA is the dependent variable to measure company performance based on accounting earning based. The accounting earning based to measure company performance has been widely used by previous researchers (Grant et al., 1988; Khana and Palepu, 2000; Cheng and Farber, 2008). Accounting based performance measure is an important, both for internal and external to conduct evaluation (Gaver and Gav-er, 1998). In addition, equity price based on the
market does not always reflect operating perfor -mance and company value (Lee and Li, 2012). Tobin’s Q is a dependent variable to measure market based perfomance following previous studies (Lang and Stulz, 1994; Servaes, 1996; Khana and Palepu 2000; Campa and Kedia, 2002; Santalo and Becerra, 2008). Tobin’s Q
reflected what the market is thinking and di
DIV is a diversification measurement based on Herfindahl index obtained by 1 minus Her
-findahl index. If the company only has one seg -ment thus DIV value is 0 and if the company has 10 segments and each segment has 10%
sales of total company’s sales, then Herfindahl
index is 0.1 and DIV is 0.9. DIV2 is the squared
value of diversification to see non linear effect of diversification conducted by the company. It is reflected that additional diversification can
make an increase and whether at same point it will lead to decreased performance.
Furthermore, the control variables are used to accomodate several variables that can affect company's performance such as company size (SIZE), company leverage level (DEBT), profit -ability level (EBIT/Sales) and capital expendi-ture (Capex/Sales).
Result and Discussion
Panel data analysis is used to process data from the samples. Table 2 shows the descrip-tive statistics of samples used in this study. Ta-ble 3 shows the correlations between variaTa-bles are not strong enough or no correlation is above 0.80, except correlation between DIV and DIV2 which has a value of 0.9628. This is reasonable becasueDIV2obtained by squaring DIV value, despite both variables were not used simultane-ously in one model.
The Hausman test suggests the use of Fixed Effect panel data model. However, the regres-sion is performed by using Generalized Least Square model to overcome heteroscedasticity and autocorrelation.
Table 1. Variables definition
Variables Explanation Measurement Dependent
ROA Accounting based measure Net income / total asset
Tobin’s Q Market based measure (market value of equity+book value of preferred stock+book value of debt ) / (book value of asset)
Independent
DIV Diversification measurement 1 – sales revenue based on Herfindahl index
DIV2 Diversification measure that move exponentially (1 – sales revenue based on Herfindahl index)2
SIZE Measure of company size Natural logarithm of total aset
DEBT Measure of leverage Total liabilities / total asset
EBIT / Sales Measure of operational profitability Earnings before interest and taxes / total sales
Capex / Sales Capital expenditure ratio Capital expenditure / total sales
Table 2. Descriptive statistics
Variabel Mean Std. dev. Max Min
ROA 0.0388 0.0843 0.3710 -0.4039
Tobin's q 1.2530 1.200 10.3300 0.1650
DIV 0.1376 0.2003 0.7187 0.0000
DIV2 0.0590 0.1097 0.5165 0.0000
SIZE 20.9410 1.5800 25.3028 16.3062
DEBT 0.2663 0.2514 2.0245 0.0000
EBIT/Sales 0.1094 0.3544 5.7433 -2.1384
Capex/Sales 0.1200 0.4699 11.5049 0.0000
Table 3. Correlation between variables
Tobin's Q DIV SIZE DEBT EBIT/Sales Capex/Sales DIV2 ROA
Tobin's Q 1.0000
DIV 0.0054 1.0000
SIZE 0.0662 0.1469 1.0000
DEBT -0.4119 -0.1003 0.0195 1.0000
EBIT/Sales 0.0564 0.0573 0.1827 -0.0598 1.0000
Capex/Sales 0.0644 0.0685 0.0522 -0.0104 0.0206 1.0000
DIV2 -0.0049 0.9628 0.1660 -0.0755 0.0634 0.0549 1.0000
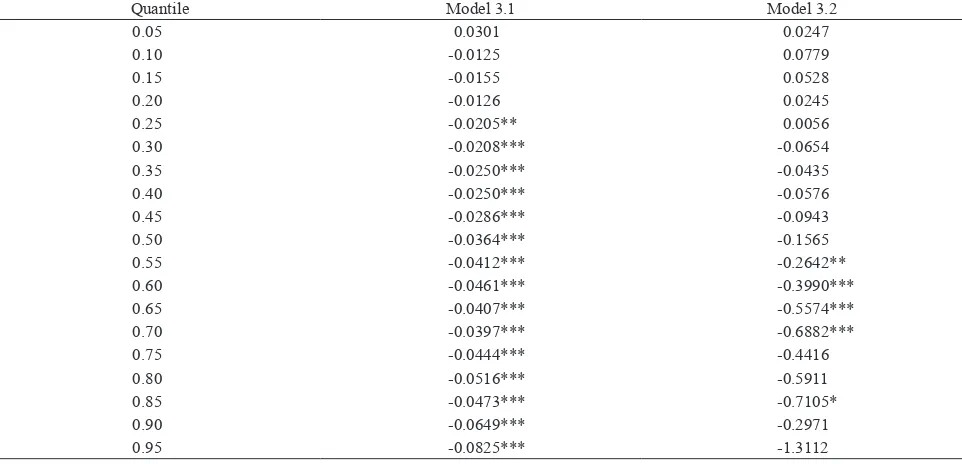
While going through the quantile regression
results in Table 5, it can be seen that there is
a different relationship between diversification
and the company performance at various perfor-mance quintile level. It can be seen from the
in-creasing negative influence from diversification
over the company’s performance along with in-creasing level of corporate performance within the range of 0.25 quantile to 0.95 quantile. This suggests a negative relationship between
diver-sification and the company’s performance that
can be explained using the BCG Matrix and the
Grand Strategy Matrix, in which diversification
strategy is used by companies that have a low market or industry sales growth, while in fact Indonesia is an emerging market that still has
high growth, therefore diversification will make
the company loose focus on their market niche.
Diversification decisions can make a company loose the benefits from the industry that still has
the potential growth that can degrade the
com-panies’ performance. Other findings from the
above results show that the performance meas-urement using ROA indicates that a diversified company tends to invest in unproductive assets, so an increase in assets does not guarantee an increase in revenue, so this will degrade the performance of the company. Model 3.2 shows that for the companies with relatively high
per-formance (quintile 0.55, 0.60, 0.65, 0.70, and 0.85), the diversification makes investors' view
on the company will be negative. This indicates that for the company that has already a high performance, then will diversify, potential
rev-Table 5. Result of quantile regression (diversification on the company’s performance)
Quantile Model 3.1 Model 3.2
0.05 0.0301 0.0247
0.10 -0.0125 0.0779
0.15 -0.0155 0.0528
0.20 -0.0126 0.0245
0.25 -0.0205** 0.0056
0.30 -0.0208*** -0.0654
0.35 -0.0250*** -0.0435
0.40 -0.0250*** -0.0576
0.45 -0.0286*** -0.0943
0.50 -0.0364*** -0.1565
0.55 -0.0412*** -0.2642**
0.60 -0.0461*** -0.3990***
0.65 -0.0407*** -0.5574***
0.70 -0.0397*** -0.6882***
0.75 -0.0444*** -0.4416
0.80 -0.0516*** -0.5911
0.85 -0.0473*** -0.7105*
0.90 -0.0649*** -0.2971
0.95 -0.0825*** -1.3112
*Significant at α = 10% ** Significant at α = 5% ***Significant at α = 1%
Table 4. Result of panel regression
Model 1.1 Model 1.2 Model 2.1 Model 2.2
Constant -0.0862** -0.1721 -0.0881** -0.2946
DIV -0.0276* -0.4276*** -
-DIV2 - - -0.0386 -0.6821***
SIZE 0.0075*** 0.0632*** 0.0075*** 0.0678***
DEBT -0.1153*** -0.0319 -0.1149*** -0.0217
EBIT/Sales 0.0307*** 0.0389*** 0.0307*** 0.1116***
Capex/Sales -0.0045 0.1419*** -0.0047 0.1186**
Adj. R2 0.2152 0.0856 0.2142 0.0789
enue loss is still huge from the current market
and will reduce profitability.
This result is not in line with the findings
of Lee and Li (2012), who found that the
re-lationship between diversification and different
performance of companies within ROE
quan-tile range from 0 to 1, where diversification is
negatively related to ROE when the company’s performance is good and it is positive with ROE when the performance is poor. However, the
findings of the authors are in line with studies
conducted by Lang and Stulz (1994), Berger and Ofek (1995), Lins and Servaes (1999), Ra-jan et al. (2000), Campa and Kedia (2002), and Martin and Sayrak (2003), which found a
nega-tive relationship between diversification on the
company’s performance
From the analysis of the regression result in the previous discussion, it can be seen that the least squares method only gives linear results
between diversification and performance as
seen in Table 4. According to Lee and Li (2012), the least squares estimator only focuses on the central tendency of the distribution. Therefore, this method does not allow researchers to see
the relationship between diversification and
performance of the companies that are on the non-central area.
By looking at the results of this study, the authors found that the relationship in
diversi-fication of the company in Indonesia has a pat -tern which decreases along with an increase in the performance of the company, where the higher performance of a company, the greater
the negative effect of diversification on the per -formance of the company due to various factors as claimed by Stulz (1990). Stulz (1990) argued
that a diversified company invests too much
on the business lines that have low investment
opportunities. Jensen (1971) claims the diver
-sified company mostly invests in unprofitable
projects. There is a negative relationship from
the diversification on the performance, while
Scharfstein and Stein (2000) argued that the various business lines which are operated by a company will increase operational cost as incentives for managers is higher, and agency cost factor proposed by Rajan et al. (2000) is included.
In addition, Martin and Sayrak (2003)
con-cluded that diversification has a negative im
-pact, because based on their findings, a diver
-sified company has problems with inefficient capital allocation. Inefficient capital allocation, according to them, is caused by the inefficiency
in internal funds that led to the unfavorable
in-vestment. The existence of inefficient capital
allocation also leads to cross subsidies between divisions, the weak divisions will be supported by a stronger division. Meyer et al. (1992) also argued that there are still other problems from
the diversification which influence cost due to
the charge made by division managers who
seek to influence top management in order to
channel the resources of the company in their division. It will also lead to unfavorable invest-ment, since divisions held by managers who
influence the top management have a business that is not necessarily beneficial, as the effort in channeling these resources is to influence the
top management.
Conclusion
The result of data analysis in this study
in-dicates that the diversification strategy has a
negative relationship with company’s perfor-mance, either by using the measurement values
of ROA and Tobin's Q. The effect of diversifi -cation claimed by Tobin's Q is more sensitive,
so the addition of diversification on a certain
level will drastically degrade the company’s performance. Furthermore, the negative
ef-fect of diversification on ROA is greater in the
group of companies with relatively high ROA. The different result occurs if we use Tobin's Q as a measure for the company’s performance,
which is diversification leads to negative im -pact on the company’s performance for a group of companies with a high performance level.
Afterward, using ROA measurement, in a company that has a relatively low level of
per-formance, the negative effect of diversification
strategies on the performance of the company is smaller than a company with relatively high per-formance. Using Tobin's Q as the measurement of the company’s performance on the
-tion negatively affects performance (Tobin's Q) and the negative effect continues to increase in parallel with the increase in the performance of the company. The next study is expected to ex-emplify the importance of the corporate govern-ance component on the research model. The
lat-est study on diversification and the company’s
performance indicates the importance of the role of corporate governance and the ownership
structure in affecting the role of diversification
on the company’s performance (Hoechle et al., 2012; Chen and Yu, 2012). Corporate govern-ance is an important issue in the management of companies in Indonesia, so the next study needs
to discuss it. The weaknesses of this study is re-lated to the issue, whether endogenous
diversi-fication affects the performance or performance affects the decision on the diversification pro
-cess. The study assumes that diversification
affects performance of the company. Previous
studies show the influence of the company's
performance against the strategy of business
diversification lived by the company. Campa
and Kedia (2002) argue that the company's decision to diversify its business is a response
to external factors influenced by the change in
environmental conditions that also affects the company's enterprise value.
References
Berger, P. and Ofek, E. (1995), Diversification
Effect on Firm’s Value, Journal of Financial Economics, 37: 39-65.
Borghesi, R., Houston, J., and Naranjo, A.
(2007), Value, Survival, and the Evolution
of Firm Organizational Structure, Financial Management, 36(3): 5-31.
Campa, J.M. and Kedia, S. (2002), Explaining
the Diversification Discount, Journal of Fi -nance, 57: 1731-1762.
Chandler, A.D. (1977), The Visible Hand, Cam-bridge: Belknap Press.
Chen, C.J. and Yu, C.M.J. (2012),
Manage-rial Ownership, Diversification, and Firm
Performance: Evidence from an Emerging Market, International Business Review, 21: 518–534.
Cheng, Q. and Farber, D.B. (2008), Earnings Restatements Changes in CEO Compensa-tion and Firm Performance, Accounting Re -view, 83: 1217-1250.
David, R.F. (2008), Strategic Management: Concept and Cases, 12th Ed
., USA: Prentice Hall.
Gaver, J.J. and Gaver, K.M. (1998), The Re-lation between Nonrecurring Accounting Transactions and CEO Cash Compensation, Accounting Review, 73: 235-253.
Gomes, J. and Livdan, D. (2004), Optimal
Di-versification: Reconciling Theory and Evi -dence, Journal of Finance, 59: 507–535.
Grant, R.M., Jammine, A.P., and Thomas, H.
(1988), Diversity, Diversification, and Prof -itability among British Manufacturing
Com-panies 1972–84, Academy of Management Journal, 31: 771–801.
Harto, P. (2005), Kebijakan Diversifikasi Pe -rusahaan dan Pengaruhnya terhadap Kin -erja: Studi Empiris pada Perusahaan Publik Indonesia, Simposium Nasional Akuntansi VIII (SNA 8). Surakarta: Universitas Seb-elas Maret.
Hoechle, D., Schmid, M., Walter, I., and Yer -mack, D. (2012), How Much of the
Diversi-fication Discount Can Be Explained by Poor
Corporate Governance?, Journal of Finan -cial Economics, 103: 41–60.
Khanna, T. and Palepu, K. (2000), Is Group
Affiliation Profitable in Emerging Markets? An Analysis of Diversified Indian Business
Groups, Journal of Finance, 55: 867–891. Jensen, M.C. (1986), Agency Costs of Free
Cash Flow, Corporate Finance Takeovers, American Economic Review, 75: 323-329. Jensen, M. and Murphy, K.J. (1971), Perfor
-mance Pay and Top Management Incentives, Journal of Political Economy: 1248-1280. Koenker, R. (2005), Quantile Regression,
Economoetric Society Monograph, Cam-bridge: Cambridge University.
Koenker, R. and Bassett, G.(1978), Regression
Lang, H.P. and Stulz, R.M. (1994), Tobin’s q,
Diversification and Firm Performance, Jour-nal of Political Economy, 102: 1248–1280.
Lee, B.S. and Li, M.Y.L. (2012), Diversifi -cation and Risk-adjusted Performance: A Quantile Regression, Journal of Banking and Finance, 36: 2157-2173.
Lins, K. and Servaes, H.(1999), International Evidence on the Value of Corporate
Diversi-fication, Journal of Finance, 54: 2215–2239. Maksimovic, V. and Phillips, G. (2002), Do
Conglomerate Firms Allocate Resources
Inefficiently Across Industries? Theory and
Evidence, Journal of Finance, 57: 721-767. Martin, J.D. and Sayrak, A. (2003), Corporate
Diversification and Shareholder Value, Jour-nal of Corporate Finance, 9: 37–59.
Meyer, M., Milgrom, P., and Roberts, J. (1992),
Organizational Prospects, Influence Costs,
and Ownership Changes, Journal of Eco -nomics and Management Strategy, 1: 9-35. Qian, G., Li, L., Li, J., and Qian, Z. (2008),
Regional Diversification and Firm Perfor -mance, Journal of International Business Studies, 39: 197-214.
Rajan, R., Servaes, H., and Zingales, L. (2000),
The Cost of Diversity: The Diversification Discount and Inefficient Investment, Jour-nal of Finance, 55: 35–80.
Santalo, J. and Becerra, M. (2008), Competi-tion from Specialized Firms and the
Diver-sification Performance Linkage, Journal of Finance, 63: 851–883.
Scharfstein, D. and Stein, J. (2000), The Dark Side of Internal Capital Market: Divisional
Rent-Seeking and Inefficient Investment,
Journal of Finance, 55: 2537-2564.
Servaes, H. (1996), The Value of Diversifica
-tion during the Conglomerate Wave, Journal of Finance, 51: 1201–1225.
Stulz, R.M. (1990), Managerial Discretion and Optimal Financing Policies, Journal of Fi -nancial Economics, 26: 3–27.
Villalonga, B. (2004a), Does Diversification Cause the “Diversification Discount”?, Fi -nancial Management, 33: 5-27.
Villalonga, B. (2004b), Diversification Dis -count or Premium? New Evidence from BITS Establishment-level Data, Journal of Finance, 59: 479–505.
Weston, J.F. (1970), The Nature and Signifi -cance of Conglomerates Firms, St. John’s Law Review, 44.