TOWARD RURAL SUSTAINABLE PHOTOVOLTAICS
DEVELOPMENT IN INDONESIA THE EFFECTS OF
SOCIO-ECONOMIC BENEFIT, INFORMATION ACCESS, AND FINANCING
FACILITIES TO THE SUSTAINABILITY OF PHOTOVOLTAICS
TECHNOLOGY APPLICATIONS
I Wayan Sujana
Director of Champions KD Technologies Menara Danamon Suites 03, Floor 12nd
Jl. Prof. Dr. Satrio, Kav. E IV/6, Mega Kuningan, South Jakarta Phone : (021) 5760533
ABSTRACT
The search for a substitute for fossil energy resources in view of the growing demand for environmentally friendly technologies for electricity generation, and the needs of the growing economics and population in Indonesia have increased the interest in photovoltaic as a long term, environmentally friendly and reliable energy technology. Although Indonesia outperformed its regional neighbors and joined China and India as the only G20 members posting growth during the 2009 economic crisis, Indonesia still struggles with poverty and unequal energy distribution. Forty percent of Indonesian households are still not electrified and most of them live in the rural area. Indonesia is trying to introduce a modern electricity technology to rural population who cannot be served economically or in a timely manner by the conventional rural electrification system. For several decades, the electricity generation in Indonesia have been under the monopolistic management of national electric company, PLN controlled and funded by the government. Experience shows that PLN has for reasons of limited funding, inadequate capacity, and has been unable to service and ensure the expansion of the utility grid to most rural households. The utilization of a photovoltaic system is targeted to contribute to the rural electrification and contribute in total of one half percent to the domestic energy mix. The photovoltaic development in Indonesia is progressing very slowly. The goal to have 50 MWp of photovoltaic generating power in the year 2010 has not been accomplished. Current installed photovoltaic capacity is 10 MWp about 2.85 percent of the year 2025 target. This dissertation studies socio and economic viability, rural information access and financial facilities influences to the sustainability of photovoltaic system dissemination in the rural area of Indonesia.
INTRODUCTION
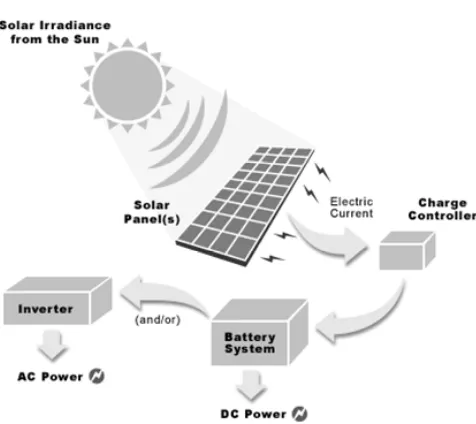
Scientifically, photovoltaic (PV) or solar cells are best known as a method in converting energy from the sun into electric power. The photovoltaic effect refers to protons from light bumping electrons into a higher state of energy to create electricity. Direct current (DC) electricity is produced by solar cells from light, which can be used to power appliances and or to recharge a battery (please refer to Figure 1 on Solar Energy Conversion). The first practical application of PV were to power orbiting satellites and other space crafts, but currently the majority of PV have been used for mostly grid connected power generation. There is also a smaller market for off-grid power for remote appliances such as for Solar Home System (SHS), pumps, irrigation needs, public road lighting, remote mini market and many more. Note that both: in-grid and off-grid system, an inverter is often required to convert the DC electricity to Alternating Current (AC) power to energize AC appliances.
The development of PV energy is a part of Clean Development Mechanism, CDM. PV power does not produce any harmful emissions during its entire life cycle. Based on IEA (International Energy Agency) report; today, average greenhouse gas emissions are ranges between 25-32 g/kWh. This number could decrease to 15 g/kWh in the future if an intensive program for using renewable energy sources is implemented progressively. Intensive utilization of renewable resources will significantly help the aims to reduce those targets. Nuclear, low temperature geothermal and wind are as good sources, emitting 6-25 g/kWh, 0-1 g/kWh and 6-25 g/kWh respectively compared to a geothermal high-temperature emitting 91-122 g/kWh, a diesel power emitting plant 893 g/kWh, a coal-fired power plant emitting 915-994 g/kWh and a combined cycle gas-fired power plant emitting 400-599 g/kWh. Using renewable energy sources in transportation, fabrication, manufacturing and home appliances would further drop carbon emissions.
Figure 1: Solar Energy Conversions
Photovoltaic soon will have an explosive growth once it reaches its cost parity (When it is competitive with cost of conventional electricity generation without subsidy). The solar photovoltaic industry will achieve grid parity before year 2013 said Stephen O’Rourke, senior analyst covering semiconductor capital equipment and materials for Deutsche Bank Securities (New York City), at the Industry Strategy Symposium (ISS, 2008), held in Half Moon Bay, California. Some Physicists also claimed that recent technology and business developments bring the cost of solar energy more in parity with that of fossil fuels. In 2007; Faiman; the director of the Ben-Gurion National Solar Energy Center of Israel, announced that the Center had entered into a project with Zenith Solar to create a home solar energy system that uses reflector as small as 10 square meter dish. In testing, the concentrated solar technology proved to be up to five times more cost effective than standard PV silicon panels, which would make it almost as competitive to power generated by oil and natural gas. Currently, there are more alternatives to standard crystalline silicone modules includes casting wafers, and thin film (CIGS, amorphous Silicon, CdTe and microcrystalline Silicon). Referring to Figure 2 on Best Research-Cell Efficiencies, experimental solar cells that gave higher than 40 percent efficiency is already identified (University of Delaware R&D labs with efficiencies of 42 percent achieved in conjunction with DuPont by means of concentration of light). This efficiency is rapidly rising while mass production costs are falling. If ones are willing to invest in continuous R&D for PV’s as much as they spend for fossil fuels, PV technologies products can be developed as a competitive option for a long term renewable energy sources for electrification.
Nowadays, solar panels get less costly as supply chain system start to get stronger. As the people start being familiar with the technology, manufacturers increase their production as demand increases. The cost of production is expected to fall drastically in the years to come. Utility rates has been increasing since the past 20 years and even today, with the increasing of crude oil price and pressure on carbon emission reduction the rate of PV demand will increase and automatically will force its generation cost ($/ kWh) to fall.
Several diligent approaches have been done to support movement of PV utilization around the globe, in the year 2006 some investors in the United States began offering 25 years Power Purchase Agreement (PPA) in the return of free solar panel installation. PPA objective was to purchase electricity at a fixed price and the rate was set lower than normal electric rates. Within 4 years (year 2010), over 90 percent of PV’s projects are expected under PPA throughout the United States. Another bright approach, in Berkley, California, the local government offered innovative financial option to the investors. This financial option adds an amount to the property assessment to allow the city to pay for the installed panels up front. The home owner pays for over a 20 year period at a rate equal to the annual electric bill savings, thus allowing free installation for the homeowner. In Germany, the government offered income tax credit to the PV users, or private sectors who used PV as their electricity generation based.
estimated to be 18.8 GWp said analyst from Navigant Consulting and Electronic Trend Publications. During the period of 2006 to 2007, Germany was the fastest growing major world PV market. By 2008, 35 percent of the world totals installed was located in Germany. At the time, the German PV industries generated more than 10,000 jobs in production, distribution and installation.
THEORETICAL FRAMEWORK AND HYPOTHESIS DEVELOPMENT
As the earth’s human population has increased, natural ecosystems have declined and changes in the balance of natural cycles redistribute water, oxygen, nitrogen and carbon through` Sustainability has become a wide-ranging term that can be applied to almost every facet of life on earth, from local to a global scale and over carious time periods. Paul Hawken in Wikipedia (2010) was quoted to point out that: Sustainability is about stabilizing the currently disruptive relationship between
earth’s two most complex systems – human culture and the living world (2010). Sustainability, at least
as a concept, has permeated most spheres of life, not solely because it is a political requirement but because it clearly resonates with something deep within us even though we have a poor understanding of what it is. Fricker (Fricker, 2005) quoted:
Brundtland Report that sustainable development is defined as development that meets the needs of the present without compromising the ability of future generations to meet their own needs (2005).
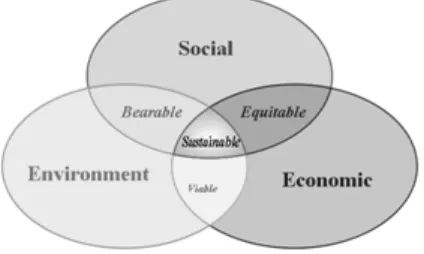
Lester Brown in his book entitled Eco-Economy, Building an Economy for the Earth (2001) emphasized that “An economy is sustainable only if it respects the principles of ecology, meaning that ecology should be put before the economy”. Sustainability is the capacity to endure. In ecology, sustainability describes how biological systems remain diverse and productive over time. For humans it is the potential for long-term maintenance of well being, which in turn depends on the well being of the natural world and the responsible use of natural resources (Sustainability-Wikipedia, the free encyclopedia, 2010). At the 2005 World Summit it was noted that this requires the reconciliation of environmental, social and economic demands - the “three pillars” of sustainability. This view has been expressed as an illustration using three overlapping ellipses indicating that the three pillars of sustainability are not mutually exclusive and can be mutually reinforcing.
Economic and Socioeconomic Benefit
Economic benefit is defined as benefit quantifiable in terms of money, such as revenue, net cash flow, net income (Business Dictionary, 2010). It can be defined as well as the positive contribution to national product (or other measure of value) from an economic activity or project (Benefit, 2011). Social economics may refer broadly to the “use of economics in the study of society.”More narrowly, contemporary practice considers behavioral interactions of individuals and groups through social capital and social “markets” (not excluding for example, sorting by marriage) and the formation of social norms. In the latter, it studies the relation of economics to social values (Socioeconomics - Wikipedia, the free encyclopedia, 2010).
Socio-economic benefits arise from the impact of a project, policy, or programme on a potentially wide range of variables. They can be summarized as:
1. Societal benefits arise from changes in social and natural capital in a region which arise from a project, policy or programme; and
2. Economic benefits due to impacts on economic or environmental activity as a result of changes in production and consumption, costs and the use of resources.
A socio-economic benefits framework provides a combined assessment of both these types of benefit in terms of economic resource benefits. It aims to encapsulate all social and economic benefits which might arise. It is these resource benefits that we consider in this study (Price Waterhouse Coopers, 2006). A loan extended by a bank to a business in need of operating capital. This may take several forms, from a short-term loan to a line of credit. Different banks have different facility plans for their clients who own or run businesses (Facility - financial definition of Facility, 2008). A few journals and studies were written globally on PV technology and its applications. Most previous studies relatively focused on the relationship between technical and economic aspects and the growth of PV applications. It was perceived that PV serves as sustainable solutions for global energy problems. Some writings investigating this point of view are listed as per following.
Solar energy is perceived as the best, perhaps the only widespread solution to global warming. High growth is forecasted for residential solar markets as solar moves to take on a measurable supply of world energy (Solar residential Panel Market Shares, Forecasts, and Strategies for 2008-2014, 2008). The same thing was seconded in one of journal articles listed in Environmental Design + Construction. It was mentioned that solar energy may be a great opportunity for electrical contractors and homebuilders. On the other hand, there is a learning curve - particularly with regard to recent technological advances like combination service entrance devices and communication gateways. Interest in solar power is also being spurred by advances in electrical distribution technologies that allow a homeowner to proactively plan for the future installation of a PV system. For example: a combination service entrance device features spaces for components necessary to distribute solar energy throughout home but it can operate like a common residential load center until those components are installed (Solar Incentives, 2009).
Even in Nicaragua, a PV study in Nicaragua led by Max Lacayo, reported that:
The company name was Empresa de Comunicaciones SA (ECAMI), which was established in Nicaragua and due to the absence of grid electricity, the only way to make use of the existing facilities was by supplying and installing SHS. ECAMI sells and installs on a commercial basis, about 50 percent of sales are to NGOs, 30 percent to private customers, and 20 percent to government programs:
ECAMI technical staffs are sent for regular updates from equipment manufacturers and this is also considered to be an important incentive for retaining good staff. People benefit from these systems in different ways. PV replaces kerosene for lighting in homes and replaces diesel-generated electricity for the island mini-grid system. Some benefits which were noted to be brought by SHS:
1. Medical center performs 24-hour emergency services and longer consultation hours. 2. Water pumps bring fresh clean water to communities.
3. Health level is increased.
4. Schools are getting lighting and radio receivers, literacy level is increasing. 5. Working hours are longer.
6. More job opportunities. (New energy leapfrogs the old, 2009)
Conventional energy resources, mostly existing in third-world countries are in extinction and began to drag changes in political and economic situations. Thus, there is an emergency to switch to renewable energy; PV (Spellberg, 2006).
Spellberg, in Power of the poor (2006), realizes the need to promote PV especially in the developing countries for the following, mostly economic reasons:
1. Most developing countries are located in areas geographically exposed to the sun all year long.
2. PV can be decentralized in order to electrify small communities dispersed throughout large, remote areas.
3. Per-capita demand for electricity in the underdeveloped world pales in comparison to that in the modernized world.
4. PV electrification can be implemented entirely at the grassroots level-the very people who consume the electricity the arrays generate.
5. Community-based electrification provides two widespread socioeconomic benefits that centralized fossil-fuel projects simply can’t: employment and social collaboration.
6. PV is ideal to use in countries with stability problem for its secure solar arrays, compared to fossil-fuelled power plants.
7. PV is an emerging technology with “immature” economies of scale. 8. PV promises development specialists more for their money.
Thus, Spellberg concluded:
PV technology is ready, and the time-economically-speaking-is-right; macro development planners must begin viewing the sun as a powerful new ally in the global against poverty (Spellberg, 2006).
defines PV systems investor’s Internal Rate of Return (IRR). James Bing concluded that:
In order to make the PV investment economic, it is imperative to lower initial costs as much as possible. The key driver to the objective is the reduction of module costs.
The ability to maintain systems performance is critical from the perspective of preserving the generating capability of the system and extending its useful life, however the associated cost are not major influences on PV energy cost, and those on IRR.
Also, James Bing found that:
Market characteristics play an important role in determining the final value proposition. However, as these are subject to public policy considerations, they can vary from place to place and from time to time. Even review of renewable energy public policy in the United States in the last ten years graphically illustrates the variability of these factors.
The market price of conventional energy (fossil fuel generated), while it too many influenced by government policy, is ultimately a product of markets, which in turn are defined by world demand for fuel, by global politics, and ultimately by geology and, therefore, an investment in PV systems represents a calculated risk / opportunity, with potential hazard and rewards (Bing, 2006).
Some other journals focusing on economic aspect of PV are cited as per below: Frost and Sullivan (2010) pointed out:
A new analysis that in order to sustain the growth momentum of solar PV systems market in North Asia, it is pertinent for governments to continue their support for the industry till the price reaches grid parity. The government support may vary; policy guidelines, tax credit, subsidies, or rebates. In the journal article listed in Global Warming Focus, they as well underlined that North Asian countries have led the Asia Pacific region in terms of early adoption of solar PV systems as well as in developing a very strong production base that caters the world demand (Frost & Sullivan, 2010).
Financial supports, as an economic aspect, in fact, was realized to be significant in PV application growth. In On-Going Global Struggle to Reduce Emissions Necessitates Large-scale Adoption of Solar PV Systems in Southeast Asia. It was elaborated that besides increasing commitment from local governments, solar PV systems for rural electrification projects are likely to be driven by active participation of non-governmental organizations and availability of funds from international financial agencies, and involvement of local communities. Some ways to rev up the pace of growth of the solar PV systems market in Asia Pacific; establish realistic targets, streamline policy framework, boost customer awareness (On-Going Global Struggle to Reduce Emissions Necessitates Large-scale Adoption of Solar PV Systems in Southeast Asia, 2010).
Moreover, PV has been used effectively to replace kerosene as an electrifying source in India. Some banks managed to provide loans for households to install PV at homes; typically USD 300 - 500 for a system to power 2 to 4 small light appliances. Partner banks agreed to let borrowers pay only 15% of the purchase and the rest of the loan could be paid off in 5 years. UNEP’s (United Nations Environment Program) subsidy helped reducing the interest rate from 12% to 5%. The program involved as well an interest rate-buy down, marketing support and a vendor qualification process. (The UN Foundation and the Shell Foundation provided project’s funding, 2007)
While in China, the PV development was able to gain acknowledgment internationally. The China Renewable Energy Development Project (REDP) won the Ashden Awards for Sustainable Energy. The project started in 2001, aiming to increase the access of electricity for these isolated rural populations, using PV technologies. The REDP model of using a market-driven approach to reduce costs, and improve system quality has greatly expanded the market for solar home systems, and also supported the growth of network of wholesale suppliers and retailers. There was no credit system, unless one provided by local retailers’ settlement. Also, local and regional authorities may purchase the system in bulk and distribute them for free or at half price, using their Poverty Alleviation Fund (High quality solar lighting comes to rural China, 2008).
Many other journals pointed out that the growth of PV applications is highly correlated with the economic aspects in general view.
In Bermuda, through the deeper penetration of renewable energy done by the government, one of the PV suppliers, Evolution Solar, initiated to formally establish a new Bermuda subsidiary. The company wants to play an important role in using PV to assist in the reduction of dependency on the expensive oil imports from large to small scale supply and distribution of solar panels. Evolution Solar Establishes Bermuda Subsidiary (Evolution Solar Establishes Bermuda Subsidiary, 2010)
Researchers at the US Department of Energy’s Lawrence Berkeley National Laboratory (Berkeley Lab) released a new study on the installed costs of solar photovoltaic (PV) power systems in the U.S., showing that the average cost of these systems declined by more than 30 percent from 1998 to 2008. This is mainly due to cost of installing the units. Within the last year of this period, costs fell by more than 4 percent. The study also found that the average size of direct cash incentives provided by state and local PV incentive programs declined over the 1998-2008 study period (New Berkeley Lab Report Shows That the Installed Cost of Solar Photovoltaics Systems in the US Fell in 2008, 2009).
PV was also considered economically applicable in residences. In the United States, despite the effects the struggling economy has had on new home construction, interest in supplementing residential power with solar energy is growing. The primary driver is economic. State and federal capital rebates help a homeowner ease the cost of installing a photovoltaic system. While in Canada, feed-in tariff is mean utilities purchase solar energy from an individual homeowner at higher rate than the homeowner would pay for grid electricity, which provides an incentive for homeowners to install photovoltaic system (Solar Incentives, 2009).
Economic parameters such as discount rate and technical parameters have a major impact on the feasibility of an investment in PV energy. By taking technical parameters into account the payback period can be twice as much compare to only taking account of economic paramaters (March, 2010).
CONCEPTUAL RESEARCH FRAMEWORK
Frameworks involve regression between WTP (as dependent variable) and three independent variables namely; Economic Viability, Access to information search and Access to financing facilities through three steps:
1. Regression of Economic viability. This is to examine the strength of the of Socio-Economic viability correlation to the WTP
2. Regression of combined Socio-Economic viability and Access to the technology information. The correlation will be examined and compared to association found in step 1.
3. Regression of combined Socio-Economic viability, Access to information and Access to financing facilities. The correlation will be examined and compared to association found in step 2.
Economic and socio-economic parameters are variables those many researchers believe to have close relationship with the sustainability of PV application in the rural area. However, socio-economic viability alone have proven to have low impact to the growth of PV dissemination in rural area. This is true with the fact that the PV dissemination growth in the rural Indonesia is very slow ever since the technology was introduced in the mid 80’s.
Based on the Consumer Behavior and Utility Maximization theory, there is an economic explanation for how different consumers allocate their money income among different goods and services. Ones those applicable in this study are: rational behavior (consumers try to get the “most for their money” to maximize their total utility), preferences (consumers have clear cut preferences and can determine how much marginal utility they get from consuming more units of a product), and budget constraints (all consumers face a budget constraint, therefore must make decisions about what they buy based on their limited budget). Or in other words to say it that: there are some processes and evaluation required before a customer decides to purchase goods or services. These processes include but not limited to product information, possible external influences, financing access information and many more. In the area such rural where education, income and transportation access is limited and difficult, the lack of information access and the limitation of financing facilities may be the root cause of the problems. And therefore, these two variables combined with socio-economic viability, demographic condition and social status are worthwhile to be examined to whether or not they have influences to the sustainability of PV application in the rural area. Thus;
Hypothesis 1:
1.b. Income does not have positive influence to the sustainability of PV technology application in the rural area of Indonesia.
1.c. Energy Expenditure does not have positive influence to the sustainability of PV technology application in the rural area of Indonesia.
1.d. Education does not have positive influence to the sustainability of PV technology application in the rural area of Indonesia.
1.e. Monthly Installment of Debt does not have positive influence to the sustainability of PV technology application in the rural area of Indonesia.
Hypothesis 2:
PV socio-economic viability and access to information search all together have a stronger positive influence to the sustainability of PV technology application in the rural area of Indonesia in comparison to the influence found in Hypothesis #1a.
Hypothesis 3:
PV socio-economic viability, access to information search and access to financing facilities all together have a stronger positive influence to the sustainability of PV technology application in the rural area of Indonesia in comparison to the influence found in Hypothesis #2
METHODS
Research is divided into two studies: First; rural PV technology economic viability evaluation. Cost Benefit Analysis (CBA) will be used to evaluate the viabilities (tangible and intangible) of PV dissemination within the rural customers. Secondly; Evaluation of correlation between sustainability of PV technology application and three variables namely; economic viability, access to information search and access to financing facilities. Rural Willingness to Pay (WTP) for the technology will be used to reflect sustainability of PV technology application parameter. WTP and Technology Acceptance (TA) tools are common tools to identify whether or not a new product or technology can be accepted within a society. However, WTP surveys are important for understanding relatively unknown market and it is a proven method for identical research worldwide. Multiple regression modeling will be used to calculate the coefficient value of the independence variables. This is to identify how significant each explanatory or independent variable in influencing the dependent variable.
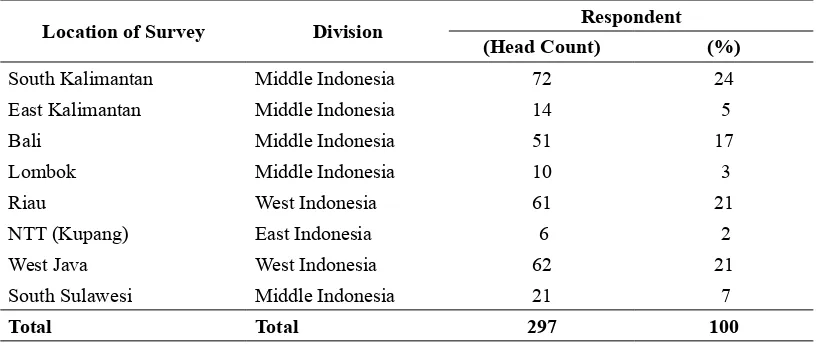
Table 1: Location of WTP Survey
Location of Survey Division Respondent (Head Count) (%)
South Kalimantan Middle Indonesia 72 24 East Kalimantan Middle Indonesia 14 5
Bali Middle Indonesia 51 17
Lombok Middle Indonesia 10 3
Riau West Indonesia 61 21
NTT (Kupang) East Indonesia 6 2
West Java West Indonesia 62 21
South Sulawesi Middle Indonesia 21 7
Total Total 297 100
RESULTS AND DISCUSSION
Payback Period, Net Present Value (NPV), and Annual Life Cycle Saving (ALCS)
Based on the calculated NPV and payback period tabulated in the Table 2; the benefit of 150 Wp and 200 Wp, 700 Wp, 750 Wp and 1,000 Wp systems begins in the third year which at the same time informs us as to their payback period. The writer presents the detail how the benefits and cost of each power load system are discounted in the Appendix C. The basic idea of applying discounted rate of return to the cash flows is to convert all figures into present value thus we are comparing apple to apple. The estimated NPV for each of the following load; 150 Wp, 200 Wp, 700 Wp, 750 Wp and 1000 Wp is USD 5,116.00, USD 6,223.00, USD 26,278.00, USD 27,635.00, and USD 38,707.00 in the respective order. The cumulative NPV of the project simply obtained by subtracting the discounted benefits from the discounted costs beginning at the present and continuing through out the life cycle of the project. The annual life cycle cost saving for each of the following load; 150 Wp, 200 Wp, 700 Wp, 750 Wp and 1000 Wp is USD 271.12, USD 329.73, USD 1,392.43, USD 1,464.36 and USD 2,051.08 respectively.
Internal Rate of Return (IRR)
Table 2: CBA at 7.96 % DCFROR and Market Price of Kerosene Rp7,800 per liter and 6 % Average Fuel Inflation Rate
Design Load 150Wp 200Wp 700Wp 750Wp 1000Wp
PV Unit Cost (Rp) 10,160,000 13,195,000 44,040,000 49,410,000 63,755,000
PV Unit Cost (USD) 1,069.47 1,388.95 4,635.79 5,201.05 6,711.05
Amount Bank Loan in % 0.00% 0.00% 0.00% 0.00% 0.00%
Down Payment (RP) 0.00 0.00 0.00 0.00 0.00
Life Cycle Cost, LCC (US$/ kWh) (0.54) (0.46) (0.37) (0.44) (0.37)
Annual Life Cycle Saving, ALCS
(US$) 271.12 329.73 1,392.43 1,464.36 2,051.08
Net Present Value, NPV (Rp) 48,605,996 59,113,875 249,637,197 262,532,260 367,720,279
Net Present Value, NPV (US$) 5,116.42 6,222.51 26,277.60 27,634.97 38,707.40
Internal Rate of Return, IRR 40% 46% 63% 63% 75%
Pay Back Period (years) 3 3 3 3 3
Sensitivity Analysis
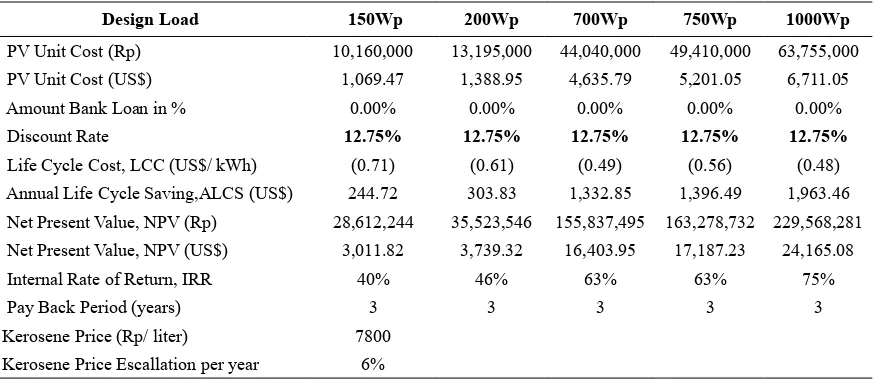
The key elements of CBA includes cost, benefits, and discount rates. Consequently, it is very important to vary key variables in the CBA in order to determine the effect of changing these key assumptions on the results. In a project that involves replacement cost and fossil fuel (kerosene) trading (where the price is very much driven by the market or market volatile), kerosene price per unit and market discounted rate of return are those needed to be varied and tested. Based on Central Bank of Indonesia (BI) data (November 18, 2009), noted that the highest DCFROR (monthly average) for the past 5 years occurred during economic downturn from Jan 2006 to April 2006 at 12.75 percent. Using this worst case assumption, Table 3 summarized the economic value of PV implementation at 12.75 percent and at market price of kerosene Rp 7,800.
Table 3: CBA at 12.75 % DCFROR and Market Price of Kerosene Rp. 7,800 per liter
Design Load 150Wp 200Wp 700Wp 750Wp 1000Wp
PV Unit Cost (Rp) 10,160,000 13,195,000 44,040,000 49,410,000 63,755,000
PV Unit Cost (US$) 1,069.47 1,388.95 4,635.79 5,201.05 6,711.05
Amount Bank Loan in % 0.00% 0.00% 0.00% 0.00% 0.00%
Discount Rate 12.75% 12.75% 12.75% 12.75% 12.75%
Life Cycle Cost, LCC (US$/ kWh) (0.71) (0.61) (0.49) (0.56) (0.48)
Annual Life Cycle Saving,ALCS (US$) 244.72 303.83 1,332.85 1,396.49 1,963.46
Net Present Value, NPV (Rp) 28,612,244 35,523,546 155,837,495 163,278,732 229,568,281
Net Present Value, NPV (US$) 3,011.82 3,739.32 16,403.95 17,187.23 24,165.08
Internal Rate of Return, IRR 40% 46% 63% 63% 75%
Pay Back Period (years) 3 3 3 3 3
Kerosene Price (Rp/ liter) 7800
Kerosene Price Escallation per year 6%
of kerosene will continue to rise as global crude oil reserves is depleting while the consumption continue to rise worldwide.
Table 4: CBA at 12.75 % DCFROR and Subsidized Kerosene
Design Load 150Wp 200Wp 700Wp 750Wp 1000Wp
PV Unit Cost (Rp) 10.160.000 13.195.000 44.040.000 49.410.000 63.755.000
PV Unit Cost (USD) 1,069.47 1,388.95 4,635.79 5,201.05 6,711.05
Amount Bank Loan in % 0.00% 0.00% 0.00% 0.00% 0.00%
Discount Rate 12.75% 12.75% 12.75% 12.75% 12.75%
Life Cycle Cost, LCC (USD/ kWh) (0.71) (0.61) (0.49) (0.56) (0.48)
Annual Life Cycle Saving, ALCS (USD) 24.63 76.92 (112.18) (121.90) (100.87)
Net Present Value, NPV (Rp) 2.880.227 8.993.637 (13.116.137) (14.252.239) (11.794.050)
Net Present Value, NPV (USD) 303.18 946.70 (1,380.65) (1,500.24) (1,241.48)
Internal Rate of Return, IRR 12.75% 12.75% < 12.75 < 12.75% < 12.75%
Pay Back Period (years) 5 6 >20 >20 >20
Kerosene Price (Rp/ Liter) 3,500
Kerosene Price Escalation per year 6%
Potential Kerosene Fuel Saving
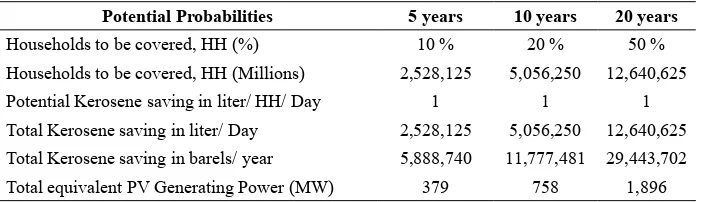
The potential of kerosene saving for Indonesia from PV implementation will definitely be very significant. To electrify 20 percent of un-electrified households will need around 5 million liters of kerosene per day or equivalent to 758 MW PV generating capacity. PV can substitute this need and save the country from kerosene dependency. Table 5 describes the detail.
Table 5: Potential of Kerosene Saving for 150 Wp PV System Utilization
Potential Probabilities 5 years 10 years 20 years
Households to be covered, HH (%) 10 % 20 % 50 %
Households to be covered, HH (Millions) 2,528,125 5,056,250 12,640,625
Potential Kerosene saving in liter/ HH/ Day 1 1 1
Total Kerosene saving in liter/ Day 2,528,125 5,056,250 12,640,625
Total Kerosene saving in barels/ year 5,888,740 11,777,481 29,443,702
Total equivalent PV Generating Power (MW) 379 758 1,896
Intangible Benefit
The first sub-section below discusses the health and safety impact of the current practices found in the rural as yet with PV technologies implementation and the second sub-section discusses the benefit of PV from the Clean Development Mechanism (CDM) prospective.
Health and Safety
Short term hazards of some components in the kerosene such ethyl benzene compounds and toluene includes potential acute toxicity to aquatic life in the water column as well as potential inhalation hazards. Kerosene has moderate volatility and moderate to high acute toxicity to biota with product specific toxicity related to the type and concentration of aromatic compounds.
Long term potential hazards of some of the lighter, more volatile and water soluble compounds such as benzene, toluene and xylene include contamination of ground water supply. Chronic effect of some of the constituents in kerosene such benzene, toluene, xylene, naphthalene, alkyl benzenes, and various PAH’s include changes in the liver and harmful effects on the kidneys, heart, lungs, and nervous system. Increased rate of cancer, immunological, reproductive, fetotoxic, effects have also been associated with some of the compounds found in kerosene. American Lung Association has indicated that sulfur dioxide is a damaging pollutant, produced when sulfur-containing fuels are burned, as in kerosene.
The presence of PV technologies in the rural will help to eliminate the hazards of kerosene and will improve the health quality of the peoples, protect local environment and increase energy conservation and efficiency.
Clean Development Mechanism (CDM)
Indonesia is a part of the United Nation Framework on Climate Change and has been participating in the negotiations and development issues very closely. Unlike developed countries, Indonesia does not have quantitative commitments under the Kyoto Protocol at the present. However, through the Clean Development Mechanism (CDM), Indonesia could benefit from investments in the Green House Gases (GHGs) emission reduction projects. This will contribute towards; the country’s sustainable development goals, the improvement of the environment as a whole and result in additional financial inflows. CDM projects generated a type of certified emission reduction (CERs) that can be traded in the international market. Like any other trade, CERs units accrued through the CDM are a commodity. These CERs will be mutually important to both developing and developed countries because it provides mutually shared benefits for both parties.
The CDM can contribute to Indonesia’s sustainable development objectives through: 1. Local environmental protection benefits
2. Sustainable ways of producing energy
3. Poverty alleviation through income generation and employment 4. Increasing energy conservation and efficiency
Table 6 below shows how GHGs from CO2 emission is converted to USD for designated PV loads. Table 6: CO2 Emission Trade Estimation throughout PV System Life Cycle
Load Design (watt) 150 200 700 750 1000
Load (kilo watt-hour) 0.518 0.820 2.465 2.640 3.095
Life (year) 25 25 25 25 25
Specific CO2 Emission (kgCO2/kWh) 0.26 0.26 0.26 0.26 0.26
Total Emission (Ton CO2 per 25 years) 1.23 1.95 5.85 6.26 7.34
Carbon Offset1) USD/Ton CO2 500.00 500.00 500.00 500.00 500.00
USD per 25 years 614.48 972.73 2924.11 3131.70 3671.44
Source: CSEm WP 189 M. August 2009
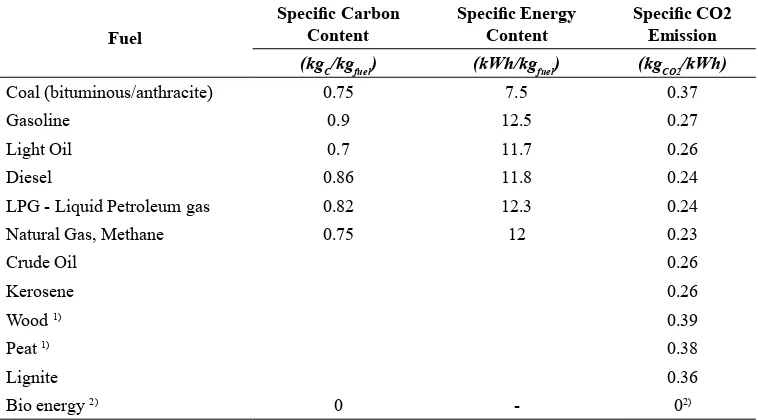
Table 7: CO2 Emission Vs Fossil Fuel Combustion
Fuel
Specific Carbon
Content Specific Energy Content Specific CO2 Emission (kgC/kgfuel) (kWh/kgfuel) (kgCO2/kWh)
Coal (bituminous/anthracite) 0.75 7.5 0.37
Gasoline 0.9 12.5 0.27
Light Oil 0.7 11.7 0.26
Diesel 0.86 11.8 0.24
LPG - Liquid Petroleum gas 0.82 12.3 0.24
Natural Gas, Methane 0.75 12 0.23
Crude Oil 0.26
Kerosene 0.26
Wood 1) 0.39
Peat 1) 0.38
Lignite 0.36
Bio energy 2) 0 - 02)
Source: EPA: engineeringtoolbox.com/co2-emission
Descriptive Statistic
Sustainability of a product application in an area can be expressed or reflected by the Technology Acceptance (TA) or Willingness to Pay (WTP) of the customers from the described area. In this research the researcher is using WTP survey (due to its simplicity and its usefulness for numerous research application worldwide) to represent the sustainability degree of PV system application.
Willingness to Pay (WTP) represents a compensated variation on how much a consumer might be willing to pay for an additional gain to have access to lighting, television, radio, internet and access to green or non polluting energy.
The goal of WTP study was to conduct 300 households survey across Indonesia archipelagos. However, the actual households surveyed were 297 due to difficulties in collecting the community member.
CONCLUSION
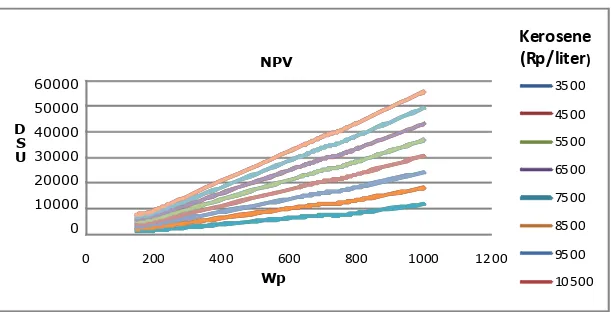
PV technology cost of generating electricity is still higher than conventional electricity grid system of various energy sources. However, PV technology is a cost competitive and sustainable option to supply electricity to the rural households to replace energy supply from kerosene. The Net Present Value of PV utilization against kerosene can be estimated using Figure 5.1. PV technology will be even more competitive if higher generating capacity plants are built, energy conversion efficiency increases and more environmental externals are taken into account. The source of PV energy is free and it is available throughout the archipelagos.
To support the success of rural PV dissemination in Indonesia, a more aggressive development strategy is needed; strategy that can help the dissemination to grow stronger and create deeper customer involvement in the program. Enhancement of socialization as part of delivering the technology information strategy and access to finacing facilities are those factors identified in this research to be significant to the success of the program.
Indonesia must continue to pursue and strongly support PV technology implementation for its rural development with three main reasons:
1. The failure of the National Electric Company (PLN) to be fully committed to supply power to the rural area. Although PLN plans to further expand and increase their power capacity, it is least likely that the rural people will have the access to benefit from it.
2. PV technology is cost competitive against kerosene even though market failures in incorporating socio-economic and environmental externalities into pricing. When these components are taken into account, PV will be even more competitive with conventional as well as with modern electrification technologies.
3. Kerosene is a primary need for the rural lighting. Kerosene is a very toxic substance and its price will continuously increase due to increases of global demand and the scarcity of world crude supplies. Indonesia as much as possible needs to avoid its dependency on global crude supply by gradually diversifying their domestic crude needs to green fuel resources where possible. Indonesia can build geographically diverse solar electric systems that are less vulnerable to volatile fossil-fuel based market and international energy politics.
Figure 3 : NPV of 20 Years Life Cycle PV System in the Rural Indonesia
0 200 400 600 800 1000 1200
U
Despite PV technology being sustainable; its development is still facing a few challenges on such availability of financial facilities access, information access, government supports and adoption approach.
Financial Challenges
Market growth of PV systems has been challenged by its high up-front capital requirement that makes the system unaffordable to the majority of the rural end users. There is no loan incentive program that has been agreed on by the government or private financial institutions. Some offer financing with high interest rate and relatively short period of loan payback. Moreover, rural access to financing is difficult due to skepticism among bankers concerning the inability of the rural debtors to payback loans. Lack of financing facilities for the rural has contributed to the low interest and Willingness to Pay (WTP) for the technology. This research result shows that rural access to finacing has a strong positive correlation to its (WTP). Please refer to WTP regression model in Chapter IV.
Information Access Challenges
PV is a relatively new technology to the majority of the rural Indonesians. Importantly, socialization as an information delivery strategy plays a key role in the introduction and market development of the product. However, socialization has not been seen by the majority of the stakeholders as an important marketing tool for the rural PV dissemination. The lack of PV knowledge has contributed to the low interest and Willingness to Pay (WTP) for the technology. Research shows that rural knowledge on PV has positive correlation to its WTP. Please refer to WTP regression model in Chapter IV.
Government Support Challenges
Market penetration of PV systems has been challenged by the low support of the government. There are several regulations and policies recognizing the value of renewable energy in general. However, legislation that recognizes the value of PV technologies and its rural dissemination has not been specifically arranged. Specific PV policy guidelines is important to specifically manage and regulate loan system, tax credits, rebates, technology transfer, or privatization. The lack of the technology knowledge among related government institution and policy makers is also a big challenge
to be resolved. This can be one of the grass roots on why the government support is very low. The government supports are important to enhance the acceleration and further sustain its development.
Adoption Approach Challenges
PV development in Indonesia is still adopting the early development approach in which the customers will finance the PV systems, as well as managing most aspects of installation and operations. This has proven to be an ineffective way to expand the PV market share considering the hassles it creates to the end users. Furthermore, this approach will give no advantage to the customers in leveraging the available incentive structures as well as the access to financing.
Technical Concern
Suppliers and installation vendors often ignore the value of basic technical knowledge that customers need to have. To create a PV self reliance community, basic knowledge training is very important. It is a must as bigger and more reliable maintenance infrastructures and supply chains are to be built. Stakeholders (at least manufacturer, suppliers, installations vendors) must picture; training, support and quality improvement as the key to the business sustainability.
Theory Implications
The recent rural PV studies relatively focused on the relationship between economic viability and the technology acceptance itself. Most researchers believe that demand will increase when PV technology reaches its cost parity, while some indicated that the implementation of PV in the rural area is economically viable. The result of this study seconded this statement as its CBA indicated a positive NPV troughout the system life cycle. In addition, calculated NPV found to have a direct relationship with its load design. Despite PV is an economical technology to be implemented in the rural area, its dissemination is still having a few challenges and far from moving forward. This stagnancy helps us to reliaze that the dissemination of PV system is not only affected by economic parameters but also other variables that related to the demographic and social status condition depending on where the technology intends to be implemented.
This study has identified two additional variables (on the top of economic viability) proven to be associated with the dissemination growth of PV in the rural area. Those are information and financing facilities access. Combining all three variables would create a model that will enable faster dissemination of this technology in the rural area. The two parameters identified in this study have never been included by previous researcher as important rural buying decision.
Recommendations
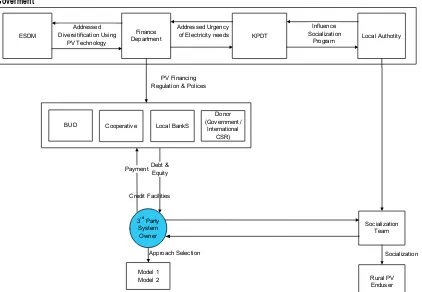
Accesses to Information and Financing have to be granted to the rural potential customers. Top-Down approach is highly recommended to speed up the process illustrated in the recomendation Figure 4.
Figure 4: Accesses to Information and Financing Schematic
Goverment
ESDM DepartmentFinance KPDT Local Authotity
BUD Cooperative Local BankS
Enhancement of PV rural knowledge is critical. The enhancement can be done through integrated product’s socialization. Potential customer’s confidence in the system’s continuous operations must be built; thus, the availability of Product information and all intangible have to be presented clearly and transparently. In addition, the socialization team must work with local resources for ensuring:
1. The long term impact of the project to the rural economics is properly addressed 2. Solution for various payment schemes
3. The environmental impact of projects is properly addressed
4. The health and safety hazards of kerosene combustion and spills is also addressed.
Access to Financing
PV technology has yet to be recognized as consumer goods that can be financed like a house or a car, eventhough PV is a competitive technology for rural electrification program. Access to financing for the rural is very limited; low percentage of households borrow from banks is mainly because of no access or loan facilities available for the rural. And therefore, most have to rely on their own saving and did not anticipate being able to get a bank loan. Although the module cost of PV has been declining at least by 30 percent during the last 10 years (period of 1998 to 2008; Journal by Berkely Lab, October 2009), current system cost offered still high for the Indonesian rural in majority. Reduction or elimination of up-front capital expenses has become a major constraints for years and will still become an issue for years to come, unless new innovative approach is introduced. This approach must be moving away from the current approach business model which principally revolve around the ownership and operate by individual. The new approach has to consider third party or private sector ownership to increase the number of market players and competition. Several approaches can be done in order to create a sustainable PV application in the rural area. The following are a few options;
Proposed Approach #1 (Adoption Approach Model 1)
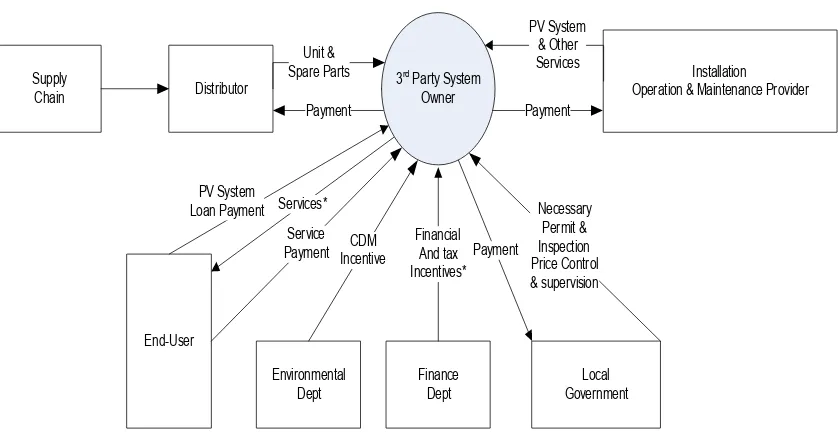
The approach is a new business model that is operated by third parties which handle all installation aspects of the projects, financial related matters, supply chain, permits, operations and maintenance, but the system owned by the customer (rural). Electricity is generated using stand alone system (SHS) installed in each house. Please see the illustration of the approach in Figure 5.
Figure 5: Customer Owned and Third Parties Operated PV System
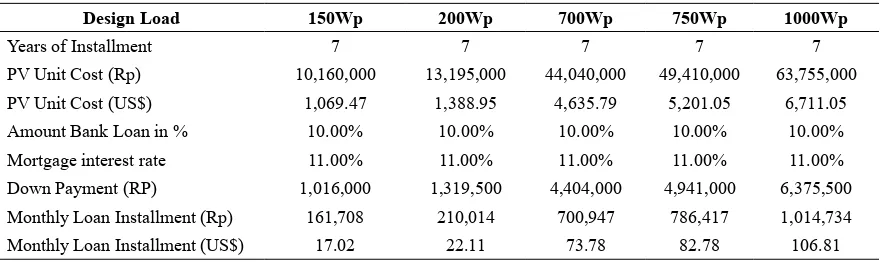
To lease a unit of 150 Wp load design with 10 percent down payment, the rural can pay USD 17.00 monthly installment on the top of their monthly service fee (which is still in the range of their WTP). Loan scheme per designated load design can be seen in Table 7.
Table 7: Rural Photovoltaic Scheme
Design Load 150Wp 200Wp 700Wp 750Wp 1000Wp
Years of Installment 7 7 7 7 7
PV Unit Cost (Rp) 10,160,000 13,195,000 44,040,000 49,410,000 63,755,000
PV Unit Cost (US$) 1,069.47 1,388.95 4,635.79 5,201.05 6,711.05
Amount Bank Loan in % 10.00% 10.00% 10.00% 10.00% 10.00%
Mortgage interest rate 11.00% 11.00% 11.00% 11.00% 11.00%
Down Payment (RP) 1,016,000 1,319,500 4,404,000 4,941,000 6,375,500
Monthly Loan Installment (Rp) 161,708 210,014 700,947 786,417 1,014,734
Monthly Loan Installment (US$) 17.02 22.11 73.78 82.78 106.81
The advantage of implementing customer owned and third party operated PV system are: 1. Ensurance of services, reliability and electricity distribution to the rural end users 2. Higher access to financing
3. Reduce hassles and complexity to the end users 4. Able to leverage the available incentive structures
5. Creation of stronger supply chain (PV become commoditized)
Proposed Approach #2 (Model 2)
The deregulation initiative will determine the success of the following recommended approach. Deregulation in this approach is needed in order to be able to privatize the electricity generation at a lower scale (lower than 1 Mega Watt, refer to Appendix E on Electrification Policy and Regulation SWOT Analysis). The approach is very similar to approach #1 except the system is owned by the third party. In this approach, the rural customers have to agree to sign Power Purchase Agreement (PPA) with the PV system owner. The electricity is generated in one area and distributed using mini grid system to individual houses. The additional advantages of approach#2 on the top of approach #1 are:
Figure 6: Third Party Owned and Operated PV System
The additional advantage of such a system scheme is that PLN can agree to sign Power Purchase Agreement (PPA) with the PV system owner. Price (Rp/ kWh) to be negotiated between two parties referring to global PV generation cost as a benchmark. Rp/kWh sales have to be fixed for 20 years to protect end users from price ambiguity. The area of services must become an exclusive area for the third party operator; unless additional electricity demand is justified. The future additional electricity supply must be tendered-out.
Figure 7: Third Party Owned and Operated PV System (Electricity Sale to PLN)
Recommendations for Further Study
PV system has shown their potential to provide electricity supply for some developing countries, only that it has not been fully engaged in Indonesia. In order to achieve Indonesia’s goal to have 50 MWp non subsidized PVgenerating power (BPPT, 2008), the researcher recommends similar study be conducted in order to capture urban market.
REFERENCES
Agar, David. 2005. A Description of Current Technology in Solar Cells. Department of Physical
Chemistry University of Jyvaskyla
Armi Susandi. “Potential Area for Solar Energy Generator and Its Benefit to Clean Development
Mechanism (Cdm) in Indonesia”. Meteorology Department. ITB
Bakshi R. 1999. Financing Renewable Electric Technologies in Developing Countries-an India View, in
Financing Renewable energies : Windows of Opportunities, European Renewable Association : 63
Bakthavatsalani V. Renewable Energy Financing – An India View, In Financing Renewable Energies:
Windows of Opportunities, European Renewable Association : 56 – 61
B. Allard, G.F. Craun, N.T. de Oude, M. Falkenmark, H.L. Golterman, T. Lindstrom, W. T. Piver.
Water Polution
Bank Helps Customers to Buy Solar Home Systems. 2008. Appropriate Technology : 24
Business Dictionary. 2010. Retrieved April 2010, from www.businessdictionary.com : http://www.
businessdictionary.com/definition/economic-benefit.html
Chen, A. J., Boudreau, M. C., & Watson, R. T. (2008). Information System and Ecological Sustainability. Journal of Systems and Information Technology : 186-201
Consumer Behaviour – Wikipedia, the Free Encyclopedia. 2010. Retrieved April 2010, from Wikipedia: http://en.wikipedia.org/wiki/consumer_behaviour
Evolution Solar Establishes Bermuda Subsidiary. 2010. Energy & Ecology Business : 43
Facility – Financial Definition of Facility. (2008). Retrieved May 2010, from Fianncial Dictionary: http://financial-dictionary.thefreedictionary.com/facility
Fricker, A. 2005. Measuring up Sustainability. Retrieved March 2010, from org: http:// www.metafuture. org/articlesbycolleagues/alanfricker/measuring%20up%20to%20sustainability.htm
Frost & Sullivan. 2010. Global Warming Focus
Harvard Business Review. Strategies for Growth
Hawkins, D.I., Best, R. J., & Coney, K. A. 2004. Consumer Behavior – Building Marketing Strategy.
New York : McGraw-Hill
High Quality Solar Lighting Comes to Rural China. 2008. Appropriate Technology : 40
Jeffery D. Sachs. 2006. The End of Poverty, Economic Possibility for Our Time. Penguin Books
Jogiyanto HM. 2008. Metodologi Penelitian Sistim Informasi. Penerbit ANDI Yogyakarta
Marketing – Wikipedia the Free Encyclopedia. 2009. Retrieved February 2010, from Wikipedia:
http://en.wikipedia.org/wiki/marketing
Mary L. Boas. DePaul University. Mathematical Methods in the Physical Sciences. Second Edition:Jon Wiley & Son
New Berkeley Lab Report Shows that the Installed Cost of Solar Photovoltaic Systems in the US Fell in 208. 2009. US Department of Energy
New Energy leapfrogs the Old. 2009. Appropriate Technology: Proquest Agriculture Journal : 30 On-Going Global Struggle to Reduce Emissions Necessitates large-Scale Adoption of Solar PV
Systems in Southeast Asia. 2010. Global Warming : 15
Peter P. Rogers, Kazi F. Jalal, Jhon A. Boyd. An Introduction to Sustainable Development. Published
by Glen Educational Foundation, Inc.
Price Waterhouse Coopers. 2006. Main Report Socio-Economic Benefits Analysis of GMES. Retrieved May 2010, from http://esamultimedia.esa.int/docs/GMES/261006_GMES_D10_final.pdf
Sales-Wikipedia, the Free Encyclopedia. 2010. Retrieved May 2010, from Wikipedia: http://
en.wikipedia.org/wiki/Sales#The_relationship_between_sales_and_marketing Samuelson Nordhaus. 2004. Ilmu Makro Ekonomi. Edisi Tujuh Belas. McGraw-Hill
Samuelson Nordhaus. 2003. Ilmu Makro Ekonomi. Edisi Tujuh Belas. McGraw-Hill
Sergio Pacca, Deepak Sivaraman and Gregory A. Keoleian. 2006. Life Cycle Assessment of the 33 kW Photovoltaic System on the Dana Building at the University of Michigan: Thin Film Laminates,
Multi-crystalline Modules and Balance of System Components. Report No. CSS05-09. Juni 1, 2006
Socioeconomics-Wikipedia, the Free Encyclopedia. 2010. Retrieved May 2010, from Wikipedia:
http://www.en.wikipedia.org/wiki/Socioeconomis Solar Incentives. 2009. Environmental Design + Construction : 4
Solar Residential Panel Market Shares, Forecasts and Strategies for 2008-2014. 2008. Resource Week : 311 Spelberg, J. 2006. Power for the Poor. Appropriate Technology; ProQuest Agriculture Journals : 48
Sustainability-Wikipedia,the Free Encyslopedia. 2010. Retrieved April 2010, from Wikipedia: http://
www.en.wikipedia.org/wiki/Sustainability
Thampapillai, D. J. 2010. Perfect Competition and Sustainability: a Brief Note. International Journal
of Social Economics : 384-390
The Different Between Sales and Marketing. 2009. Retrieved March 2010, from Small Business
Notes : http://www.smallbusinessnotes.com/operating/marketing/salesmktdiff.htm The UN Foundation and the Shell Foundation Provided Project’s Funding. 2007. Research Information Ltd.
Tremblay, T. 2009. Harnessing Cultural and Human Capital for Economic Sustainability: a New Brunswick Model. Journal of Enterprising Communities: People and Places in Global Economy
Uma Sekaran. Research Methods for Business, A Skill Building Approach
Verhelst, B., Desmet, J., Debruyne, C., Landeghem, H. V., & Vandevelde, L. 2010. Technical and Business Economic Study of Photovoltaic Systems
William E. Grant, Ellen K. Pedersen, Sandra L. Marin. Ecology and Natural Resources Management,
System Analysis and Simulation: John Wiley and Sons, Inc.