(Disampaikan pada Seminar Nasional “Agroforestry sebagai Pemanfaatan Lahan berkelanjutan di Masa Depan”, INAFE, Bandarlampung, 7 Mei 2009)
Aplikasi
Multi-Criteria Decision Analysis(MCDA) dan Sistem Informasi Geografi (SIG)
untuk mengestimasi tingkat resiko kebakaran hutan di Kawasan Mahakam Tengah,
Kabupaten Kutai Barat − Kalimantan Timur
Arief Darmawan1
1Jurusan Kehutanan Fakultas Pertania n, Universitas Lampung Jl. Prof. Soemantri Brojonegoro No. 1 Bandar Lampung, Indonesia
Email: [email protected]. ac.jp
ABSTRAK
Kebakaran hutan dan lahan telah menyebabkan kerugian ekonomi dan ekologi yang sangat besar di Indonesia. Dua kebakaran besar terjadi di tahun 1982-1983 dan 1997-1998 setelah musim kemarau berkepanjangan akibat pengaruh fenomena El-Niño. Pasca kejadian besar terakhir, walaupun telah banyak dana dan usaha terkuras, kebakaran hutan dalam skala yang lebih kecil tetap terjadi hampir setiap tahun. Penelitian ini bertujuan untuk mengidentifikasi tingkat resiko kebakaran hutan dan lahan secara eksplisit keruangan (spatially explicit), sehingga dapat digunakan dalam kegiatan pencegahan dini kebakaran mendatang. Multi-Criteria Decision Analysis (MCDA) dan Sistem Informasi Geografi (SIG) dikombinasikan untuk mengestimasi tingkat resiko kebakaran hutan dan lahan berdasarkan indeks kondisi bahan bakar, indeks iklim, indeks topografi, dan indeks manusia. Indeks bahan bakar diketahui dari tiga indikator, yakni tipe penutupan lahan, temperatur permukaan lahan, dan keadaan pernah atau tidaknya lahan tersebut terbakar. Indeks iklim didapat berdasarkan peta curah hujan rata-rata per tahun hasil interpolasi data tahunan curah hujan 35 stasiun klimatologi di seluruh Propinsi Kalimantan Timur. Indeks topografi di estimasi berdasarkan empat indikator, yakni: ketinggian, kemiringan, aspek, dan jenis tanah. Indeks manusia di asumsikan melalui tiga indikator, yaitu: jarak dari jalan terdekat, jarak dari sungai terdekat, dan jarak dari pemukiman terdekat. Beberapa kriteria dan indikator tersebut dievaluasi dan dinilai oleh para ahli dari perguruan tinggi dan teknisi kebakaran hutan dengan menggunakan teknik Analytical Hierarchy Process (AHP). Implementasi dari model analitik tersebut, peta yang memperlihatkan lima tingkatan resiko kebakaran hutan dan lahan dapat dihasilkan.
Kata kunci: Kebakaran hutan dan lahan, MCDA, SIG, Analytical Hierarchy Process (AHP)
INTRODUCTION
(Disampaikan pada Seminar Nasional “Agroforestry sebagai Pemanfaatan Lahan berkelanjutan di Masa Depan”, INAFE, Bandarlampung, 7 Mei 2009)
that fire is very useful because it quickly and effectively reduces the biomass of newly cleared forests to nutrient rich ash that can fertilize crops (Cochrane, 2000). As long as the use of fire is well managed, it should be accepted as the simplest and cost-effective system of land management processes – and at times as part of land use changes – rather than as a problem to be suppressed.
In Indonesia, notably East Kalimantan, the aforementioned fire roles were, however, obscured by great economic and ecological losses caused by large wildfire of Borneo (1982-83 and 1997-98). Fires were mostly regarded as a problem that has to be suppressed than a subject that could be managed. Current fire management, is almost exclusively a government effort and focuses more on fire suppression than on fire management strategies that balance prevention, preparation, fire fighting, and restoration of damage (Tacconi et al., 2006). Much of this emphasis is based on perceptions of fire from outside the tropics. The assumption that the fires are uncontrolled wildfires that threaten lives and destroy infrastructure appears generally established. This partial understanding, however, become more obvious when a recurrent land and forest fires in a smaller scale occurred almost every year after the 1997-1998 wildfires. Focusing solely on fire suppression was clearly inadequate because fire fighting is strongly limited in its effectiveness, expensive, difficult to implement, and addressing only the symptoms. Moreover, the underlying cause of this repeating catastrophic event is primarily from human activities which require more social approach to determine the causes of fires than merely fire suppression (Dennis et al., 2005; Geist and Lambin, 2002). To this point, a better perspective of fire problem should be considered which place fire within a context of balance management strategy where various data and information especially if presented in a spatially explicit form such as fire risk map, are very important.
The main purpose of this paper is to identify areas that are most susceptible to fire occurrences in a spatially explicit approach, thus to reduce future incidence of major forest and land fires by combining geographical information system (GIS) and multi-criteria decision analysis (MCDA).
MATERIALS AND METHODS
1. Data
The data used in this paper were as follows:
1. Geo-corrected Landsat TM/ETM+ datasets of 1992, 1997, 2000 and 2003 (path 117 row 60). 2. Time-series fire hotspot data taken from Ministry of Forestry which derived from time-series
NOAA-AVHRR images. 3. Topographic maps (1:250,000).
4. Historical rain climatic data from 35 climatic stations distributed across East Kalimantan Province.
5. Digital elevation model from Shuttle Radar Topography Mission (SRTM).
(Disampaikan pada Seminar Nasional “Agroforestry sebagai Pemanfaatan Lahan berkelanjutan di Masa Depan”, INAFE, Bandarlampung, 7 Mei 2009)
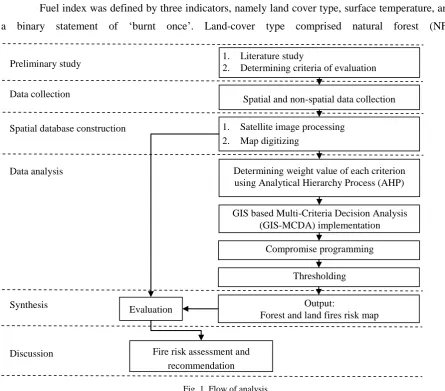
Preliminary study 1.2. Literature study Determining criteria of evaluation
Data collection Spatial and non-spatial data collection
1. Satellite image processing 2. Map digitizing
•
Data analysis Determining weight value of each criterion using Analytical Hierarchy Process (AHP)
GIS based Multi-Criteria Decision Analysis (GIS-MCDA) implementation
Compromise programming
Synthesis Evaluation Output:
Forest and land fires risk map
Discussion Fire risk assessment and recommendation Spatial database construction
Thresholding
Fig. 1. Flow of analysis
7. Decision maker preferences taken from questionnaire devoted for six university experts and six government officers (field technicians).
2. Method
This paper consists of preliminary study, data collection, spatial database construction, data analysis, synthesis, and discussion. We combined MCDA and GIS to estimate the degree of fire risk based on the conditions of fuel index, climate index, topographic index, and human index of the study area. Flow of the study is depicted in Fig. 1.
Fuel index was defined by three indicators, namely land cover type, surface temperature, and a binary statement of „burnt once‟. Land-cover type comprised natural forest (NF),
fragmented/degraded forest (FF) and shrub and grassland (SG) derived from land-cover classification of landsat images. Surface temperature was obtained from the thermal band of Landsat image (Lillesand et al., 2004). Burned-once map is a Boolean state of ever-burned and never-burned areas that was created from time-series analysis of satellite images which simply joint the burned areas resulted from image classification of the earliest data (1992) and burned area detection using NBR (Normalized Burn Index) differencing (after Phua et al., 2007) of 1992~1997, 1997~2000, and 2000~2003.
(Disampaikan pada Seminar Nasional “Agroforestry sebagai Pemanfaatan Lahan berkelanjutan di Masa Depan”, INAFE, Bandarlampung, 7 Mei 2009)
historical rainfall data from 35 climatic stations across East Kalimantan Province.
Topographic index was estimated by four indicators, namely elevation, slope, aspect, and soil type. Elevation was derived from the 90 m spatial resolution SRTM Digital Terrain Elevation Data (DTED). Slope and aspect were computed from the elevation data using surface fitting method (exact fit to four nearest neighbors and center cell) which included within the TNTmips software (Microimages, Inc, 2001). Soil type was also included within this topographic index which typically illustrates the physical. Soil type was extracted from land-system map of RePPProT.
Human index was assumed by three indicators, i.e. distance from nearest roads, distance from nearest rivers, and distance from nearest settlements. A distance raster was created from vector layer of each variable.
The above criteria and indicators were evaluated and weighted by university experts and forest fire technicians using Analytical Hierarchy Process (AHP).
Raster grid was used for overall GIS analysis. All data were resampled to the SRTM spatial resolution (90 m) to standardize the size and position of pixels. The processes of spatial data construction as well as database management in this chapter were conducted under GIS and remote sensing commercial software TNTmips.
R
ESULTS AND DISCUSSIONS1. Criteria weight valuation
From twelve decision makers, only four decision makers (i.e. experts 1 and 2 and officers 1
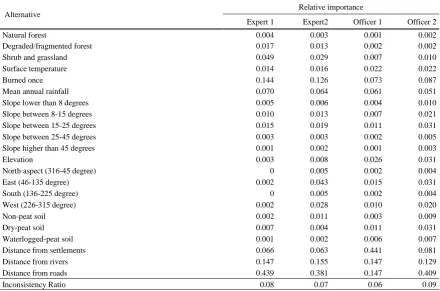
Table 1. Relative importance of each alternative to the increase of fire risk
Alternative Relative importance
(Disampaikan pada Seminar Nasional “Agroforestry sebagai Pemanfaatan Lahan berkelanjutan di Masa Depan”, INAFE, Bandarlampung, 7 Mei 2009)
Fig. 2. Fire risk map after integrating decision makers preferences using
compromise programming
Fig. 3. Forest and land fires risk degree
and 2) passed consistency test which was set to below 0.1 of overall Inconsistency Ratio. Hence, the decision results from these four decision makers were used for the overall analysis (Table 1).
Distances from roads, and rivers were assigned as the highest and second highest alternatives to the increase of fire risk by all decision-makers except for Officer 1 who assigned distance from settlements as the highest alternative. These results explain that human activities are definitely the most influencing factor to the increase of fire risk. After human index, burned once became the next dominant alternative to the increase of fire risk. As was explained earlier, the burned-once is very important factor to measure the potential of fire occurrence. Mean annual rainfall, topographic index, and shrub and grassland were assigned as the dominant factor after burned-once factor. Among these factors, shrub and grassland is more important because it will rapidly cover the bare lands after several years of abandonment. Bare land was not included into analysis because of an assumption that bare land does not contain any fire fuel. Compare to these preceding alternatives, other alternatives were assigned to have low or have little influence to the increase of fire risk.
2. Fire risk map
Four fire risk maps were resulted by incorporating the four decision makers‟ weight values into the spatial data. These four maps were combined into one fire risk map using compromise programming (Fig. 2). Five categorical degrees of fire risk map were generated (Fig.3) after thresholding process which was then evaluated by the number of fire hotspot from 1997 to 2003 that fall into each category. We assumed that the highest fire risk will be the area with the highest number of fire hotspot.
The above results are very important as an initial reference to seek a good management
(Disampaikan pada Seminar Nasional “Agroforestry sebagai Pemanfaatan Lahan berkelanjutan di Masa Depan”, INAFE, Bandarlampung, 7 Mei 2009)
human life, capital, and production caused by fires. Very high fire risk areas do not necessarily
become regular fire occurrence areas if a good management practice was implemented on those areas.
Likewise, very low fire risk areas are not always free from fire hazard due to poor management
practice. However, as a recommendation, a more cautious land use should be implemented in the area
with higher risk of fire. For this, zero burning policy for large plantation company (Tacconi et al.,
2006), local community arrangement of burning for shifting cultivation, and improving forest
management practices such as reduced-impact logging are few examples of management practices that
could be implemented.
A
CKNOWLEDGEMENTThe author would like to acknowledge the helpful advice, comments, and suggestions given by Mustofa Agung Sarjono, Mohammad Sumaryono and Rustam of Mulawarman University and Bambang Hero Saharjo of Bogor University of Agriculture during the preparation of this manuscript. This research was partially supported by JSPS Grant-in-Aid for Scientific Research (No. 19208014) and the Tropical Forests and Climate Change Adaptation (TroFCCA) Project of the Center for International Forestry Research (CIFOR).
L
ITERATURE CITEDCochrane, M.A., (2000): Fire science for rainforests. Nature 421, 913–919
Dennis, R. A., Mayer, J., Applegate, G., Chokkalingam, U., Colfer, C. J. P., Kurniawan, I., Lachowski, H., Maus, P., Permana, R. P., Ruchiat, Y., Stolle, F., Suyanto., and Tomich, T. P. (2005): Fire, people, and pixels: Linking social science and remote sensing to understand underlying causes and impacts of fires in Indonesia. Human Ecology 33, 465-504
Geist, H.J. and Lambin, E.F., (2002): Proximate causes and underlying driving forces of tropical deforestation. BioScience 52 (2), 143–150
Goldammer, J.G., (2006): History of equatorial vegetation fires and fire research in Southeast Asia before the 1997–98 episode: A reconstruction of creeping environmental changes. Mitigation and Adaptation Strategies for Global Change 12, 13–32
Lillesand, T.M., Kiefer, R.W., Chipman, J.W., (2004): Remote sensing and image interpretation. John Wiley & Sons, Inc, 763pp
Phua, M.H., Tsuyuki, S., Lee, J.S., Sasakawa, H., (2007): Detection of burned peat swamp forest in a heterogeneous tropical landscape: A case study of the Klias Peninsula, Sabah, Malaysia. doi:10.1016/j.landurbplan.2007.01.021