http://ejournal.persagi.org/index.php/Gizi_Indon
LENGTH OF PATERNAL EDUCATION IS ASSOCIATED WITH HEIGHT-FOR-AGE OF SCHOOL CHILDREN IN RURAL AREA OF SEPATAN TIMUR-TANGERANG
Lama Pendidikan Ayah Berhubungan dengan Tinggi Badan menurut Umur Anak Sekolah Dasar di Wilayah Pedesaan, Sepatan Timur-Tangerang
Dudung Angkasa,Nadiyah, Laras Sitoayu, Idrus Jus’at
Department of Nutrition, Faculty of Health Sciences, Universitas Esa Unggul, Jakarta E-mail: dudung.angkasa@esaunggul.ac.id
Diterima: 12-02-2018 Direvisi: 06-03-2018 Disetujui terbit: 06-03-2018
ABSTRACT
Paternal educational status plays an important role in long-term nutritional status of children. The objective of this study was to investigate the association between paternal factors and school children nutritional status in rural setting, Indonesia. A cross-sectional study carried out in September up to November 2015 involving 368 primary public school children in Sepatan Timur, Tangerang. Structured questionnaires were administered to parents, containing household characteristics such as length of school year, working status, number of siblings. Children weight and height were measured using a weighing scale and microtoise, respectively. Anthropometric indices, height-for-age (HAZ) and body mass index for-age (BAZ), were produced by using WHO-Antroplus. Children’s food intake and snacking habits were assessed using single 24 hours food recall and food frequency questionnaire, respectively. Others variables were physical activity and infectious disease history. Multiple regression analyses were employed to enquire research questions. Results indicated that children with father’s educational status less than 9 years had a significant 0.607 lower HAZ if compared to those educational status more or equal to 9 years after adjustment for mother’s schooling year, working status, number of household member, children’s history of diarrhea and physical activity status, sex, age and snacking frequency. Conclusion, father’s educational status was associated with height for age among school children in rural area of Sepatan Timur.
Keywords: paternal educational status, school children, nutritional status, rural area
ABSTRAK
Pendidikan orang tua berperan penting dalam menentukan status gizi anak dalam jangka panjang. Penelitian bertujuan menganalisis hubungan faktor orang tua dengan status gizi anak sekolah di wilayah pedesaan. Penelitian menggunakan desain potong lintang dilaksanakan selama September-November 2015 dengan melibatkan 368 anak sekolah dasar negeri di Sepatan Timur, Tangerang. Kuesioner terstruktur diberikan pada orang tua untuk mengetahui lama sekolah, status pekerjaan, dan jumlah anak. Berat dan tinggi badan akan diukur dengan timbangan badan dan microtoise kemudian dihitung indeks antropometri tinggi badan menurut umur (TB/U) dan indeks massa tubuh menurut umur (IMT/U). Konsumsi sampel dinilai dengan food recall 24 jam satu hari dan kuesioner frekuensi makanan. Variabel lain yang diamati ialah aktivitas fisik dan riwayat infeksi. Analisis Regresi berganda digunakan untuk menjawab tujuan. Hasil menunjukkan bahwa sampel dari ayah yang berpendidikan <9 tahun lebih rendah skor TB/U sebesar 0,607 poin dibandingkan sampel dari ayah yang berpendidikan >9 tahun setelah dikontrol lama pendidikan ibu, status pekerjaan, jumlah anak, riwayat diare, aktivitas fisik, jenis kelamin, umur dan frekuensi jajan anak. Penelitian ini menyimpulkan bahwa pendidikan ayah yang rendah berhubungan dengan tinggi badan anak pada anak sekolah di wilayah pedesaan, Sepatan Timur.
INTRODUCTION
alnutrition, a state in which a deficiency, excess or imbalance of energy, protein and other nutrients, among school age children may result impaired immune system, reduction of linear physical growth potential, and poor cognitive function.1 In adulthood,
malnutrition may reduce work productivity and as a higher risk of non-communicable diseases such as cardiovascular disease.2,3 National
Institute of Health Research and Development in 2013 shows that approximately 30.7%, 11.2% and 18.8% of Indonesian children age 5-12 years old were stunted, wasted and overweight, respectively.4 The prevalence of malnutrition
was higher in rural area. Study by Sandjaja et al. reported that stunting among school age children were higher in rural area (37.3%) than urban area (23.8%). By sex distribution, about 40.3% stunting among school age children in rural were male.5 Based on public health cut off,
current stunting prevalence was classified as high prevalence (30-39%).6 Except from
overweight, rural area tend to have higher prevalence of underweight especially among male children. School age is a critical period since it is the last chance for children to catch up the growth next to golden age 0-2 years old. Failure to intervene at this period may increase accumulative adverse effect of malnutrition thus would decrease country’s human development index.7
Malnutrition occurred by several
interrelated factors such as food intake, infection and parenting care pattern. Among those, parental care pattern plays an important and sustainable roles in children growth and development8 since they are responsible in
purchase and prepare food9-11 as well as
introducing eating behaviour.11,12
Current study take place in Banten province, Indonesia. This province included in one of poorest provinces in term of availability of appropriate drinking-water sources, clean and healthy life style, and one of fifth highest province for occurrence of diarrheal infection.4
Although there are several improvement, our previous studies13,14 still observed poor
sanitation and hygiene practices as well as poor parental care among underfive and school age children particularly in study area. There was limited study exploring the parental factors
towards school children nutritional status in rural setting of Tangerang. Available study was done by Rahayu et al.15 among underfive children
during 3 years follow up. They found that parental factors, particularly, fathers educational status associated significantly with children nutritional status. However, their study did not control for infectious disease history and physical activity level of school children. Current work is conducted cross-sectionally among school children in study area and try to control for potential confounding factors
METHODS
A cross-sectional study was conducted in Sepatan Timur Sub-District, District of Tangerang, Banten Province, Indonesia from October to November 2015. Geographically, district of Tangerang has a diverse area area. Based on health office report, total school age children was 8988.
Using a WHO sample size calculator for survey with 95% confidence level, 5% precision,
non-response rate 5% and population
proportion for stunting 37% resulted in minimum sample size was 377. Lists of all children aged between 9 to 12 years are obtained from 12 out of 18 primary public schools. Schools were selected randomly while samples were selected proportionately by considering the number of students from each class at selected schools. Children who did not return inform consent, had physical disability, suffering from severe infectious disease e.g. tuberculosis, were excluded from the study. Informed consent was obtained from all parents.
produced by using software WHO AnthroPlus. Other confounding factors such as history of having infectious diseases at the last month and physical activities at last two weeks also were collected by structured questionnaire. School children food intakes were also collected by single 24 hours food recall and presented as energy (Kcal), carbohydrate (g), protein (g), and fat (g). Lastly, children were asked about their snacking frequency or food pattern at the last two weeks. Food portion size was determined by market survey in study area. Nutrisurvey program was used to produce energy and macronutrients data which subsequently exported to SPSS version 22.0. Multiple regression analyses were employed to answer research questions. Ethical approval was granted by the ethical committee of the Faculty of Health Sciences, Universitas Esa Unggul under the serial number 067/FIKES/II/2015.
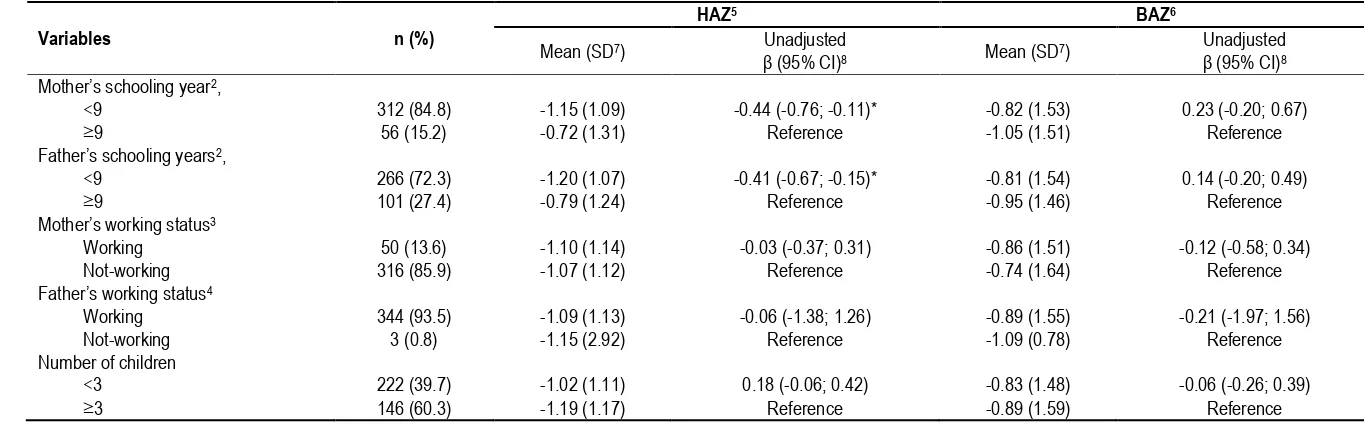
The characteristics of the school children’s
parents are shown in Table 1 and are presented as the n (%), mean ± standard deviation and regression coefficient with 95% confidence interval. Except from mother and father
schooling years, there’s no significant association between parental’ characteristic with
children height-for-age z –score (HAZ). Mother and father with schooling years less than 9 years were significantly associated with 0.44 and 0.41 point reduction, respectively on
children’s HAZ.
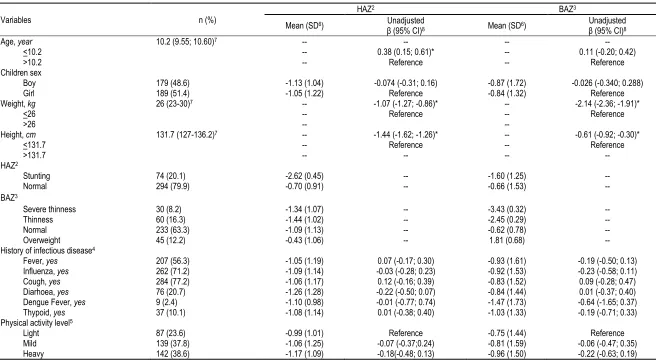
Tabel 2 shows 20.1% of school children were stunting, 24.5% were severe thinness and thinness and 12.2% were overweight. Except from age, weight and height,
there’s no significant association between
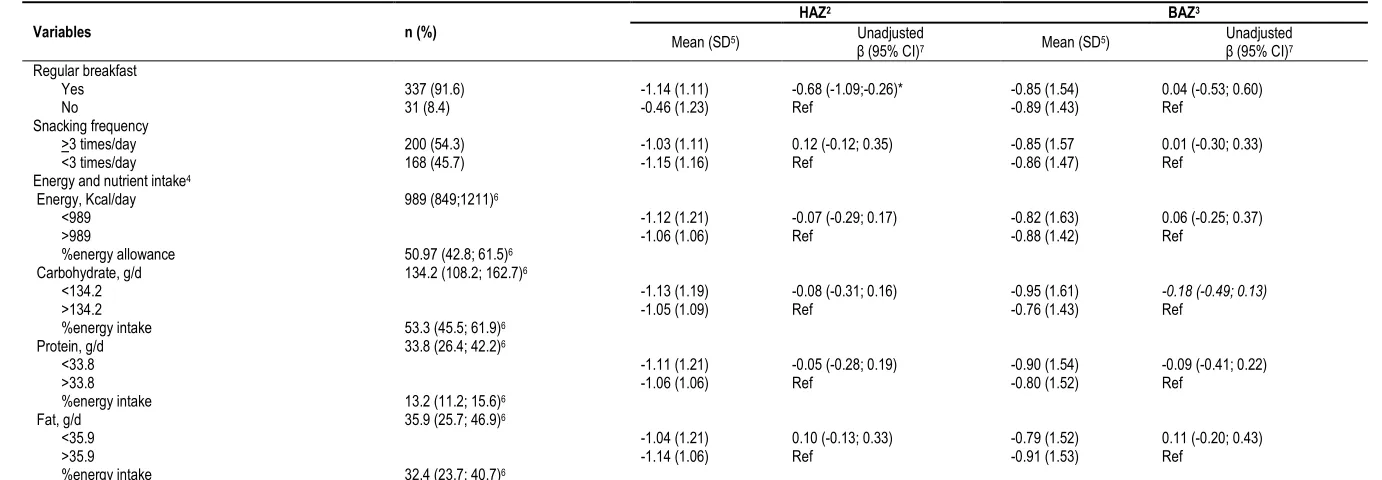
children sex, history of infectious disease, and physical activity level with HAZ and BAZ. Interestingly, we found school children with regular breakfast will significantly reduce height-for-age z score by -0.68 points. Although, most school children had a regular breakfast their’s snacking frequency were more than 3 times a day. Except from fat intake, energy, protein and carbohydrate intake below the median had at
greater reduction for height-for-age z score. Breakfast, snacking habits as well as energy and macro-nutrients intake were not significantly associated with body mass index-for-age z-score (Tabel 3).
Tabel 4 demonstrated type and frequency of breakfast meal which were consumed by school children. Related to carbohydrate-food sources, white rice is the most favorite for breakfast staple food followed by instant noodle, fried rice and bread. Fried-fish is the most favorite protein-food source for breakfast followed by tempeh,tofu and poached egg. We found vegetable soup and stir fried vegetable are the most favorite dish for breakfast.Since less than a half of children (131 of 368 for vegetable soup and 98 of 368 for stir vegetables) reported vegetables consumption during breakfast, it indicated low vegetable intake to start the day. Mineral water, followed by added-sugar tea and condensed-milk are the most favorite drinking for breakfast. Related to snacking food, wheat- and sago- flour based are the most favorite snacking food, followed by vegetables and meat/chicken based products.
In multivariables analysis, we found that father with schooling years <9 and children with regularly taking breakfast were associated significantly with 0.312 and 0.631 lower HAZ if
compared to children whose father’s schooling
years >9 years and children with irregular breakfast, respectively. Neither parental nor children factors are associated with children BAZ after adjustment for other’s schooling year,
working status, household’s number of children, children’s history of diarhea and physical activity
status, sex, age and snacking frequency. Since we speculated that father tend to put higher
attention to son, we tried to interact the father’s
schooling year and children sex. In model 2, except from a consistent negative association
between father’s schooling years with children HAZ, we found insignificant interaction between
father’s schooling years with children sex (Table
Table 1
Parental characteristic of school children in study area1 (N=368)
Variables n (%)
HAZ5 BAZ6
Mean (SD7) Unadjusted
β (95% CI)8 Mean (SD7)
Unadjusted
β (95% CI)8
Mother’s schooling year2,
<9 312 (84.8) -1.15 (1.09) -0.44 (-0.76; -0.11)* -0.82 (1.53) 0.23 (-0.20; 0.67)
≥9 56 (15.2) -0.72 (1.31) Reference -1.05 (1.51) Reference
Father’s schooling years2,
<9 266 (72.3) -1.20 (1.07) -0.41 (-0.67; -0.15)* -0.81 (1.54) 0.14 (-0.20; 0.49)
≥9 101 (27.4) -0.79 (1.24) Reference -0.95 (1.46) Reference
Mother’s working status3
Working 50 (13.6) -1.10 (1.14) -0.03 (-0.37; 0.31) -0.86 (1.51) -0.12 (-0.58; 0.34)
Not-working 316 (85.9) -1.07 (1.12) Reference -0.74 (1.64) Reference
Father’s working status4
Working 344 (93.5) -1.09 (1.13) -0.06 (-1.38; 1.26) -0.89 (1.55) -0.21 (-1.97; 1.56)
Not-working 3 (0.8) -1.15 (2.92) Reference -1.09 (0.78) Reference
Number of children
<3 222 (39.7) -1.02 (1.11) 0.18 (-0.06; 0.42) -0.83 (1.48) -0.06 (-0.26; 0.39)
≥3 146 (60.3) -1.19 (1.17) Reference -0.89 (1.59) Reference
1All value are n (%) otherwise indicated; 2equivalent with junior/middle high school; 3N=366; 4N=347; 5Height-for-age z score; 6body mass index for age z score; 7Standard Deviation;
Table 2
School children’s characteristic based on age, nutritional status, and history of infectious disease at last one month1 (N=368)
Variables n (%)
HAZ2 BAZ3
Mean (SD6) Unadjusted
β (95% CI)8 Mean (SD6)
Unadjusted
β (95% CI)8
Age, year 10.2 (9.55; 10.60)7 -- -- --
--<10.2 -- 0.38 (0.15; 0.61)* -- 0.11 (-0.20; 0.42)
>10.2 -- Reference -- Reference
Children sex
Boy 179 (48.6) -1.13 (1.04) -0.074 (-0.31; 0.16) -0.87 (1.72) -0.026 (-0.340; 0.288)
Girl 189 (51.4) -1.05 (1.22) Reference -0.84 (1.32) Reference
Weight, kg 26 (23-30)7 -- -1.07 (-1.27; -0.86)* -- -2.14 (-2.36; -1.91)*
<26 -- Reference -- Reference
>26 --
--Height, cm 131.7 (127-136.2)7 -- -1.44 (-1.62; -1.26)* -- -0.61 (-0.92; -0.30)*
<131.7 -- Reference -- Reference
>131.7 -- -- --
--HAZ2
Stunting 74 (20.1) -2.62 (0.45) -- -1.60 (1.25)
--Normal 294 (79.9) -0.70 (0.91) -- -0.66 (1.53)
--BAZ3
Severe thinness 30 (8.2) -1.34 (1.07) -- -3.43 (0.32)
--Thinness 60 (16.3) -1.44 (1.02) -- -2.45 (0.29)
--Normal 233 (63.3) -1.09 (1.13) -- -0.62 (0.78)
--Overweight 45 (12.2) -0.43 (1.06) -- 1.81 (0.68)
--History of infectious disease4
Fever, yes 207 (56.3) -1.05 (1.19) 0.07 (-0.17; 0.30) -0.93 (1.61) -0.19 (-0.50; 0.13) Influenza, yes 262 (71.2) -1.09 (1.14) -0.03 (-0.28; 0.23) -0.92 (1.53) -0.23 (-0.58; 0.11) Cough, yes 284 (77.2) -1.06 (1.17) 0.12 (-0.16; 0.39) -0.83 (1.52) 0.09 (-0.28; 0.47) Diarhoea, yes 76 (20.7) -1.26 (1.28) -0.22 (-0.50; 0.07) -0.84 (1.44) 0.01 (-0.37; 0.40) Dengue Fever, yes 9 (2.4) -1.10 (0.98) -0.01 (-0.77; 0.74) -1.47 (1.73) -0.64 (-1.65; 0.37) Thypoid, yes 37 (10.1) -1.08 (1.14) 0.01 (-0.38; 0.40) -1.03 (1.33) -0.19 (-0.71; 0.33) Physical activity level5
Light 87 (23.6) -0.99 (1.01) Reference -0.75 (1.44) Reference
Mild 139 (37.8) -1.06 (1.25) -0.07 (-0.37;0.24) -0.81 (1.59) -0.06 (-0.47; 0.35) Heavy 142 (38.6) -1.17 (1.09) -0.18(-0.48; 0.13) -0.96 (1.50) -0.22 (-0.63; 0.19) 1All value are n (%) otherwise indicated; 2Height-for-age z score; 3body mass index for age z score; 4Type and occurence of infectious disease suffered by respondent at last one month; 5standard physical activity level
questionnaire comprise from common physical and homework activity, transportation, exercise and play game, sitting time, resting time and sleeping time; 6Standard Deviation; 7Median (Interquartile range, Q25th-Q75th); 8Simple
Table 3
Food pattern and nutrient intake of school children1 (N=368)
Variables n (%)
HAZ2 BAZ3
Mean (SD5) Unadjusted
β (95% CI)7 Mean (SD5)
Unadjusted
β (95% CI)7
Regular breakfast
Yes 337 (91.6) -1.14 (1.11) -0.68 (-1.09;-0.26)* -0.85 (1.54) 0.04 (-0.53; 0.60)
No 31 (8.4) -0.46 (1.23) Ref -0.89 (1.43) Ref
Snacking frequency
>3 times/day 200 (54.3) -1.03 (1.11) 0.12 (-0.12; 0.35) -0.85 (1.57 0.01 (-0.30; 0.33) <3 times/day 168 (45.7) -1.15 (1.16) Ref -0.86 (1.47) Ref
Energy and nutrient intake4
Energy, Kcal/day 989 (849;1211)6
<989 -1.12 (1.21) -0.07 (-0.29; 0.17) -0.82 (1.63) 0.06 (-0.25; 0.37)
>989 -1.06 (1.06) Ref -0.88 (1.42) Ref
%energy allowance 50.97 (42.8; 61.5)6
Carbohydrate, g/d 134.2 (108.2; 162.7)6
<134.2 -1.13 (1.19) -0.08 (-0.31; 0.16) -0.95 (1.61) -0.18 (-0.49; 0.13)
>134.2 -1.05 (1.09) Ref -0.76 (1.43) Ref
%energy intake 53.3 (45.5; 61.9)6
Protein, g/d 33.8 (26.4; 42.2)6
<33.8 -1.11 (1.21) -0.05 (-0.28; 0.19) -0.90 (1.54) -0.09 (-0.41; 0.22)
>33.8 -1.06 (1.06) Ref -0.80 (1.52) Ref
%energy intake 13.2 (11.2; 15.6)6
Fat, g/d 35.9 (25.7; 46.9)6
<35.9 -1.04 (1.21) 0.10 (-0.13; 0.33) -0.79 (1.52) 0.11 (-0.20; 0.43)
>35.9 -1.14 (1.06) Ref -0.91 (1.53) Ref
%energy intake 32.4 (23.7; 40.7)6
1All value are n (%) otherwise indicated; 2Height-for-age z score; 3Body mass index for age z score; 4Derived from single 24 hours food recall; 5Standard Deviation; 6Median
Table 4
Type of breakfast meal consumed by school children at last two weeks1 (N=368)
Food Frequency2
Breakfast foods & drink Every school-day 2-5 times/week Once/week
White rice (n=323) 53 (16.4) 268 (83.0) 2 (0.6)
Instant noodle (n=164) 10 (6.1) 111 (67.7) 43 (26.2)
Fried-rice (n=144) 4 (2.8) 111 (77.1) 29 (20.1)
Bread/donut (n=118) 2 (1.7) 76 (64.4) 40 (33.9)
Fried-fish (n=123) 21 (17.1) 72 (58.5) 30 (24.4)
Poached-egg (n=249) 16 (6.4) 193 (77.5) 40 (16.1)
Fried-tempeh (n=193) 18 (9.3) 150 (77.7) 25 (13.0)
Fried-tofu (n=110) 7 (6.4) 83 (75.5) 20 (18.2)
Veg soup (n=131) 22 (16.8) 80 (61.1) 29 (22.1)
Stir veg (n=98) 6 (6.1) 69 (70.4) 23 (23.5)
Mineral water (n=314) 148 (47.1) 163 (51.9) 3 (1.0)
Tea with added-sugar (n=157) 5 (3.2) 129 (82.2) 23 (14.6)
Condensed-milk (n=148) 5 (3.4) 118 (79.7) 25 (16.8)
Instant powdered milk (n=52) 3 (5.8) 32 (61.5) 17 (32.7)
Tea without added sugar (n=35) 2 (5.7) 25 (71.4) 8 (22.9)
Snacking foods
Wheat flour based (n=282) 71 (25.2) 202 (71.6) 9 (3.2)
Sago flour based (n=207) 48 (23.2) 154 (74.4) 4 (2.4)
Cassava based (n=25) 1 (4.0) 20 (80.0) 4 (16.0)
Corn based (n=26) 2 (7.7) 15 (57.7) 9 (34.6)
Nuts based (n=50) 3 (6.0) 37 (74.0) 10 (20.0)
Vegetables based (n=101) 12 (11.9) 71 (70.3) 18 (17.8)
Fruit based (n=72) 5 (6.9) 46 (63.9) 21 (29.2)
Meat/Chicken based (n=105) 16 (15.20 73 (69.5) 16 (15.2)
Milk based (n=65) 7 (10.8) 43 (66.2) 15 (23.1)
Others (n=212) 64 (30.2) 141 (66.5) 7 (3.3)
Table 5
Multivariable regression analysis of the association of parental-children factors with school children’s HAZ and BAZ1 (n=365)
Predictors HAZ2 p-value BAZ3 p-value
% Unadjusted β4 (95% CI) Adjusted β5 (95% CI) Unadjusted β4 (95% CI) Adjusted β5 (95% CI)
Model 1
Parental factors
Mother’s schooling, <9 years 84.8 -0.44 (-0.76; -0.11)* -0.204 (-0.598; 0.189) 0.308 0.23 (-0.20; 0.67) 0.138 (-0.416; 0.692) 0.626
Father’s schooling6, <9 years 72.3 -0.41 (-0.67; -0.15)* -0.312 (-0.622; -0.001) 0.049* 0.14 (-0.20; 0.49) 0.089 (-0.349; 0.526) 0.691
Working mother7, yes 13.6 -0.03 (-0.37; 0.31) 0.001 (-0.341; 0.343) 0.995 -0.12 (-0.58; 0.34) -0.166 (-0.647; 0.315) 0.498
Number of children, <3 60.3 0.18 (-0.06; 0.42) 0.113 (-0.122; 0.347) 0.346 -0.06 (-0.26; 0.39) 0.043 (-0.287; 0.373) 0.799
Children’s factors
Children sex, boys 48.6 -0.074 (-0.31; 0.16) 0.002 (-0.229; 0.233) 0.988 -0.026 (-0.340; 0.288) 0.012 (-0.313; 0.337) 0.942
Children’s age, <10.2 year 50.0 0.38 (0.15; 0.61)* 0.380 (0.147; 0.612) 0.001* 0.11 (-0.20; 0.42) 0.107 (-0.219; 0.434) 0.519
Regular breakfast, yes 91.6 -0.68 (-1.09;-0.26)* -0.631 (-1.047; -0.214) 0.003* 0.04 (-0.53; 0.60) -0.022 (-0.608; 0.565) 0.942 Snacking frequency,>3x/d 54.3 0.12 (-0.12; 0.35) 0.213 (-0.025; 0.451) 0.080 0.01 (-0.30; 0.33) 0.021 (-0.315; 0.356) 0.903 Physical activity
Light 23.6 Reference Reference Reference Reference
Medium 37.8 -0.07 (-0.37;0.24) 0.043 (-0.262; 0.348) 0.782 -0.06 (-0.47; 0.35) -0.058 (-0.488; 0.371) 0.789 Heavy 38.6 -0.18(-0.48; 0.13) -0.085 (-0.390; 0.221) 0.585 -0.22 (-0.63; 0.19) -0.182 (-0.612; 0.248) 0.405 Diarrheal history, yes 20.7 -0.22 (-0.50; 0.07) -0.252 (-0.541; 0.037) 0.087 0.01 (-0.37; 0.40) 0.014 (-0.393; 0.420) 0.947
Model 2
Parental factors
Mother’s schooling, <9 years 84.8 -0.44 (-0.76; -0.11)* -0.185 (-0.578; 0.209) 0.357 0.23 (-0.20; 0.67) 0.157 (-0.399; 0.712) 0.580
Father’s schooling6, <9 years 72.3 -0.41 (-0.67; -0.15)* -0.607 (-1.067; -0.148)* 0.010 0.14 (-0.20; 0.49) -0.178 (-0.827; 0.471) 0.590
Working mother7, yes 13.6 -0.03 (-0.37; 0.31) 0.000 (-0.341; 0.342) 0.999 -0.12 (-0.58; 0.34) -0.167 (-0.648; 0.315) 0.496
Number of children, <3 60.3 0.18 (-0.06; 0.42) 0.113 (-0.121; 0.348) 0.342 -0.06 (-0.26; 0.39) 0.044 (-0.286; 0.375) 0.791
Children’s factors
Children sex, boys 48.6 -0.074 (-0.31; 0.16) -0.224 (0.668; 0.221) 0.323 -0.03 (-0.340; 0.288) -0.276 (-0.903; 0.351) 0.387
Children’s age, <10.2 year 50.0 0.38 (0.15; 0.61)* 0.189 (-0.257; 0.634) 0.405 0.11 (-0.20; 0.42) -0.001 (-0.629; 0.628) 0.998
Regular breakfast, yes 91.6 -0.68 (-1.09;-0.26)* -0.644 (-1.061; -0.227)* 0.003 0.04 (-0.53; 0.60) -0.028 (-0.617; 0.560) 0.925 Snacking frequency,>3x/d 54.3 0.12 (-0.12; 0.35) 0.214 (-0.024; 0.453) 0.078 0.01 (-0.30; 0.33) 0.024 (-0.312; 0.360) 0.887 Physical activity
Light 23.6 Reference Reference Reference Reference
Medium 37.8 -0.07 (-0.37;0.24) 0.045 (-0.260; 0.350) 0.771 -0.06 (-0.47; 0.35) -0.054 (-0.484; 0.376) 0.804 Heavy 38.6 -0.18(-0.48; 0.13) -0.086 (-0.392; 0.219) 0.579 -0.22 (-0.63; 0.19) -0.179 (-0.611; 0.252) 0.414 Diarrheal history, yes 20.7 -0.22 (-0.50; 0.07) -0.229 (-0.519; 0.061) 0.121 0.01 (-0.37; 0.40) 0.035 (-0.374; 0.444) 0.866
Father’s schooling * Children Sex -- -- 0.289 (-0.228; 0.807) 0.272 -- 0.180 (-0.550; 0.910) 0.628
Father’s schooling* Children Age -- -- 0.330 (-0.189; 0.849) 0.212 -- 0.379 (-0.354; 1.111) 0.310
1Enter method; 2Height-for-age z score; 3Body mass index for age z score; 4Simple linear regression; 5adjusted for parental schooling years, mother working status, number of children, children sex, age,
DISCUSSION
In the present study, we found that father’s
schooling years or educational status are significantly associated with school children HAZ. This finding in line with study of Rodriguez-Llanes, J. M., Ranjan-Dash, S., Mukhopadhyay, A., & Guha-Sapir, D16 who
reported that father’s schooling years was a significant predictor for children 6-59 months’ nutritional status (wasting and stunting) in
India’s post-flood rural settings. The higher the
father’s schooling years the lower risk of
stunting among the children after adjusted by
child’s age and per head annual income of
household members. Study by Galgamuwa et al (2017) also confirmed that father’s educational status was associated with children nutritional status in Plantation Community, Sri Lanka. In detail they find that father with complete secondary school is being a protective factor to under-nutrition of preschool children after adjusted by potential confounding17. In contrast
with those, several study found that the mother educational status which associated with children nutritional status. Study by Abuya et al (2012) found that mother’s educational level are associated with children 0-40 months’s nutritional status in urban slum area of Nairobi.18
Srivastava et al, in the same year to Abuya et al, also reported that school children from urban slum area in India were at higher risk for malnutrition if mothers had low schooling years.19
These contrasts might derived from different cultural aspect within the area of studies. Particularly in current study, father in rural area may have more time to contribute in
their children’s care if compare to father in
urban area. Fathers may directly or indirectly influence family eating pattern, access of health
service, and the mother’s care pattern thus influence the children’s nutritional and health status. This argument is supported by Semba et al in 2008 showed In Indonesia, fathers educational status may associate with use of health services.20 They found that households
whose fathers had high educational status tend to have good health care, high coverage of good sanitation practice, use of vitamin A capsule, children immunization, Iodine-fortified salt, and others health services. Study of Rodriguez-Llanes, et al16 and Khattak et al21
also confirmed that highly educated fathers give more care of their children and provide health facilities when they need. Moreover Khattak et al study in India, occupied father may contributed in household income and better food access for the children. Genetically, parents
anthropometric measurement may also
contribute in children’s physical stature of children15,19 but in daily practice parents
influenced the children nutritional status by influencing their dietary intake. Children intake mostly depend on their parents since the parents are responsible in food purchasing and preparation at home.9-11 Study by Chong et al
(2017) found that children fruit intake was associated with parental educational status. The more educated parent the greater children fruit intakes22 since the parent prepare or provide it
at home. To another extent, parents are a good role model for children eating patterns where more educated parents will show a better eating pattern. It was supported by Meriska et al.11 and
Hermina, Afriansyah, & Jahari12 which showed
that children are trying to mimic their parent’s food choice and eating pattern before they mimic others such as friends and food advertisements. However except from parents, Francesco Burchi8 highlighted that other literate
household member such as uncle, grand father etc had a significantly, though limited, effect on child nutritional status, particularly children height. At last, current finding support previous study in the same area by Rahayu et al15. They
found that father’s schooling year was significantly associated with stunting prevalence among underfive children after controlling for potential confounding factors. Our study together with other15-19,21 show the important
role of parents schooling years as determinants of the children nutritional and health status.
In addition or as other interesting findings, our study find that school children with regular breakfast habits were significantly associated with lower height-for-age z score (HAZ) if compared to those with irregular breakfast habits. The result is in contrast with other established studies such as Pereira et al (2011)23 and McCrory & Campbell (2011)24
intakes were lower than its median. It seems that their regular breakfast habits already good but the food portions or nutrient quality was not balance. Hardinsyah et al (2012)25 found that
almost 50% of school children breakfast meal are in low nutrient quality. Good breakfast meal should fulfill 15-30% of the daily energy and nutrient requirement. Study of Putri et al26
reported that imbalance meal may associate with either undernutrition or overnutrition of school children age 10-12 years old. As summary, these findings implied the important role of parent, particularly the father, in translating the nutrition and health messages into practice such as purchasing and preparation of right food for children at home. All findings may recommend the policy makers toward the importance of literacy or education as nutrition sensitive intervention in sustainable improvement of children nutritional and health status.
As limitation, study in school children may lead to specific bias since children could not understand something abstract such as frequency of infectious disease and did not remember the frequency of snacking in the last two weeks. However, research members tried to assist by explaining the questions by their requestor how to fill the questionnaire. For the snacking frequency questionnaire; we conduct market study at school canteens to ensure the food items on the food lists is identified by the samples. In addition, this study did not included the other potential confounding such as parental anthropometric measurements, household hygiene and sanitation practices. For hygiene and sanitation, we assumed that the situation
Parental factors, particularly father’s
schooling years is a significant predictor for school children nutritional status in rural are in Tangerang. Father’s may influence household’s food availability and accessibility thus lead to school children food preferences (eating pattern) and nutritional status.
RECOMMENDATION
Nutrition sensitive intervention should be emphasized on parental factor, particularly paternall educational status in rural area of their parents who participated in this study. Our sincere thanks also go to the public health services’ officers for their continuous support.
REFERENCES Fam Med Prim Care. 2015;4(2):187.
4. National Institute of Health Research and Development: Population Health Basic Health Research - RISKESDAS 2013. Indonesia Jakarta: Ministry of Health Republic of Indonesia Jakarta; 2013
5. Sandjaja S, Budiman B, Harahap H, Ernawati F, Soekatri M, Widodo Y, et al. Food consumption and nutritional and biochemical status of 0· 5–12-year-old Indonesian children: the SEANUTS study. Br J Nutr. 2013;110(S3):S11–20.
7. Kementerian Kesehatan RI I. Rencana Strategis Kementerian Kesehatan tahun 2015-2019. 2015;
8. Burchi F. Whose education affects a
child’s nutritional status? From parents’ to household’s education. Demogr Res.
2012;27:681–704.
9. Nicklas T, Hayes D. Position of the American Dietetic Association: nutrition guidance for healthy children ages 2 to 11
years. J Am Diet Assoc.
2008;108(6):1038–44.
10. BPOM R. Pedoman pangan jajanan anak sekolah untuk pencapaian gizi seimbang: orang tua, guru dan pengelola kantin. Jakarta: Direktorat SPP Badan POM RI; 2013. 29 p.
11. Meriska I, Pramudho K, Murwanto B. Perilaku sarapan pagi anak sekolah dasar. J Kesehat. 2016;5(1).
12. Hermina H, Afriansyah N, Jahari AB. Efek Intervensi Pendidikan Berbasis Sekolah Terhadap Tingkat Pengetahuan Tentang Pencehagan Kegemukan Di Antara Anak-Anak Usia 9-10 Tahun Di Kota Bandung. Penelit Gizi Dan Makanan J Nutr Food Res. 2008;31(2).
13. Anzarkusuma IS, Mulyani EY, Jus’at I, Angkasa D. Status Gizi Berdasarkan Pola
Makan Anak Sekolah Dasar Di
Kecamatan Rajeg Tangerang (Nutritional Status Based On Primary School
Student’s Dietary Intake In Rajeg District
Tangerang City). Indones J Hum Nutr. 2014;1(2):135–48.
14. Angkasa D, Sitoayu L, Putri VR, Mulyadi M. Peduli Sarapan Dan Makanan Sehat, Serta Higiene Dan Sanitasi Lingungan Sekolah Pada Siswa Sekolah Dasar Di Kecamatan Sepatan Timur. J Pengabdi Masy AbdiMas. 2017;3(2). upstream: enhancers of child nutritional
status in post-flood rural settings. PeerJ. 2016;4:e1741.
17. Galgamuwa LS, Iddawela D,
Dharmaratne SD, Galgamuwa G.
Nutritional status and correlated socio-economic factors among preschool and school children in plantation communities, status of school-age children-A scenario of urban slums in India. Arch Public
Role of Parents’ Literacy in Malnutrition of
Children Under the Age of Five Years in a Semi-Urban Community of Pakistan: A Case-Control Study. Cureus. 2017;9(6).
22. Chong KH, Lee ST, Ng SA, Khouw I, Poh BK. Fruit and Vegetable Intake Patterns
and Their Associations with
Sociodemographic Characteristics,
Anthropometric Status and Nutrient Intake Profiles among Malaysian Children Aged 1–6 Years. Nutrients. 2017;9(8):723.
23. Pereira MA, Erickson E, McKee P, Schrankler K, Raatz SK, Lytle LA, et al. Breakfast Frequency and Quality May Affect Glycemia and Appetite in Adults and Children–4. J Nutr. 2010;141(1):163– 8.
24. McCrory MA, Campbell WW. Effects of
Eating Frequency, Snacking, and
Breakfast Skipping on Energy Regulation:
Symposium Overview2. J Nutr.
2010;141(1):144–7.
harian anak usia 6—12 tahun di indonesia. J Gizi Dan Pangan. 2016;7(2).
26. Putri VR, Angkasa D, Nuzrina R. Konsumsi Fast Food, Soft Drink, Aktivitas