Assessment, and Risk Aversion
for Public Decisionmaking
Abstract
This paper estimates risk reductions for each layer of security designed to prevent commercial passenger airliners from being commandeered by terrorists, kept under control for some time, and then crashed into specific targets. Probabilistic methods are used to characterize the uncertainty of rates of deterrence, detection, and disruption, as well as losses. Since homeland security decisionmakers tend to be risk-averse because of the catastrophic or dire nature of the hazard or event, utility theory and Monte Carlo simulation methods are used to propagate uncertainties in calculations of net present value, expected utility, and probabilities of net benefit. We employ a “break-even” cost-benefit analysis to determine the minimum probability of an otherwise successful attack that is required for the benefit of security measures to equal their cost. In this context, we examine specific policy options: including Improvised Physical Secondary Barriers (IPSBs) in the array of aircraft security measures, including the Federal Air Marshal Service (FAMS), and including them both. Attack probabilities need to exceed 260 percent or 2.6 attacks per year to be 90 percent sure that FAMS is cost-effective, whereas IPSBs have more than 90 percent chance of being cost-effective even if attack probabilities are as low as 6 percent per year. A risk-neutral analysis finds a policy option of adding IPSBs but not FAMS to the other measures to be preferred for all attack probabilities. However, a very risk-averse decisionmaker is 48 percent likely to prefer to retain FAMS even if the attack probability is as low as 1 percent per year—a level of risk aversion exhibited by few, if any, government agencies. Overall, it seems that, even in an analysis that biases the consideration toward the opposite conclusion, far too much may currently be spent on security measures to address the problem of airline hijacking, and many spending reductions could likely be made with little or no consequent reduction of security.C 2013 by the Association for Public Policy Analysis and Management.
INTRODUCTION
This paper evaluates security measures designed to prevent commercial passenger airliners from being commandeered by small bands of terrorists, kept under control for some time, and then crashed into specific targets. Concern about this possibil-ity has been sufficient to warrant the deployment of antiaircraft missile batteries at the Beijing and London Olympics. We estimated the risk reduction from exist-ing measures usexist-ing systems reliability techniques that specifically consider rates of
deterrence, detection, and disruption for each layer of security. This requires the quantification of threat probability, risk reduction, losses, and security costs. We employed a “break-even” cost-benefit analysis that determined the minimum prob-ability of an otherwise successful attack that would be required for the benefit of security measures to equal their cost.1
Terrorism is a threat with characteristics that frighten people and make them risk-averse. Among these characteristics are dread (or fear), the involuntary and seemingly random nature and catastrophic potential of the hazard, the sense that there is little preventive control, the seeming certainty that there will be fatalities, and the large number of people exposed (Wilson & Crouch, 1987).
Governments should be risk-neutral because they have a high degree of cost and benefit diversification not available to individuals (Ellingwood, 2006; Sunstein, 2002). Hardaker, Fleming, and Lien (2009, p. 256) have acknowledged that “policy-making is a risky business,” but observed that “regardless of the varied desires and political pressures, we believe that it is the responsibility of analysts forcefully to ad-vocate rational decision methods in public policy-making, especially for those with high risk.” If rational approaches to public policymaking are not applied, politically driven processes “may lead to raising unnecessary fears, wasting scarce resources, or ignoring important problems” (Pat´e-Cornell, 2002, p. 644). Indeed, the U.S. Of-fice of Management and Budget specifically states that the use of expected values (an unbiased estimate) is appropriate for government cost-benefit calculations (Of-fice of Management and Budget [OMB], 1992). This entails using mean or average estimates for risk and cost-benefit calculations, and not worst-case or pessimistic ones.2
Nonetheless, public policy decisionmaking for low probability–high consequence events is often characterized by risk aversion (Cha & Ellingwood, 2012), as many homeland security measures fail a cost-benefit analysis using standard expected value methods of analysis (Stewart & Mueller, 2008, 2011, 2013). This suggests that the relevant policymakers must be considerably risk-averse when they approve such measures (Stewart, Ellingwood, & Mueller, 2011).
Utility theory can be used to factor risk aversion into the decision process, and this paper will infer utility functions that represent the level of risk averseness of the U.S. Department of Homeland Security (DHS) when justifying existing and proposed aviation security policies. Stewart and Mueller (2013) developed a sim-ple systems reliability model for aviation security using single-point estimates of risk reduction and losses, and a risk-neutral decision analysis. This paper extends this work considerably by (1) including the effect of deterrence in estimating risk reduction, (2) developing conditional probabilities for detection rates since secu-rity measures are not perfectly substitutional, (3) characterizing detection rates, risk reduction, and losses as probabilistic variables allowing confidence intervals of policy preferences to be calculated, and (4) using utility theory to quantify lev-els of risk aversion. The key issues are how high do attack probabilities need to be for aviation security measures to be cost-effective? And if attack probabilities are low, what is the degree of risk averseness necessary for a decisionmaker to accept that spending up to $4 billion per year to prevent a 9/11 type attack is justified?
1For a literature review of probabilistic terrorism risk assessment, see Stewart and Mueller (2013). 2Pat´e-Cornell (2002, p. 634) elaborates on this point: “If risk ranking is recognized as a practical necessity
Figure 1. Event Tree of Losses.
RISK-BASED DECISION SUPPORT FRAMEWORK
A standard definition of risk is:
Risk=Threat×Vulnerability×Consequences. (1) This is consistent with the conceptual framework adopted by the DHS (National Research Council [NRC], 2010) and with risk analyses for many applications (Kaplan & Garrick, 1981; Stewart & Melchers, 1997).
An aversion to risk arises mostly from the magnitude of the consequences or large losses from a terrorist event. Utility theory provides a means of evaluating the risk preferences of the interested parties under choice uncertainty. The attribute (x) under consideration is monetized costs of security measures and losses sustained from a terrorist attack. For illustrative purposes, three loss attributes are considered, i = 1, 2, and 3 to represent low, medium, and high consequences, respectively. Airlines or governments may impose stricter security requirements in an attempt to placate a frightened public in the event of a foiled attack. These additional costs will depend on at what stage the plot was foiled. We assume four stages:j=1: deterred, j=2: detected prior to boarding,j=3: foiled in flight, andj=4: aircraft downed by antiaircraft measures. The event tree of events that lead to lossesLi is given in
Figure 1. The expected utilityE[u] from this event tree is
E[u]=Pr (T)
where u(x) is the utility for cost x expressed as a utility function for cost conse-quences; the probability of attack Pr(T) is the likelihood that a successful terrorist attack will take place where the security measures are not in place (i.e., the at-tack will down the airliner given no security measures are in place); Pr(L | T) is the conditional probability of a loss given occurrence of the threat (vulnerability); the reduction in risk (Rj) is the degree to which security measures reduce the
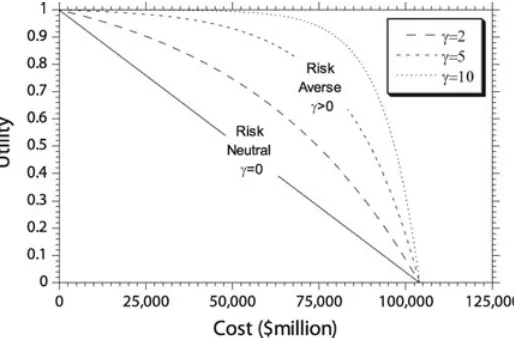
Figure 2. Risk-Neutral and Risk-Averse Utility Functions.
Csecurityis the cost associated with security measures that lead to risk reduction; and Cadd,j is the additional cost caused by a foiled plot resulting in increased security
requirements, and a more risk-averse traveling public and regulators.
The objective of the decisionmaking process is to maximize the expected utility, and so an option is preferable if it has a higher utility. Utility is highest (u=1.0) when costs and losses are zero, and lowest (u=0) when costs are a maximum. A risk-neutral linear utility function is appropriate for decisionmakers in governments or large companies that can afford to sustain a loss on a 50/50 chance (P =0.5) of making an equally substantial profit. However, this would not be true among individuals or corporations making decisions involving monetary values that are large in relation to their working capital (Bickel, 2006). These decisionmakers would only take a gamble if the risk of large loss is small. Such decisionmakers are risk-averse, and their preferences are manifested in a concave utility function. In other words, they are prepared to settle for a guaranteed expected loss (avoid the gamble) rather than accept a risk of an even larger loss. That is, the higher the level of risk averseness, the higher the willingness to pay. Figure 2 shows risk-neutral and risk-averse utility functions. The utility function is
u(x)= 1 1−e−γ
1−e−γ(xmaxxmax−x) γ ≥0 (3)
whereγ is the risk-averse shape factor. Asγ increases, the utility function becomes more concave, and so the level of risk averseness increases.
Layers of Aviation Security
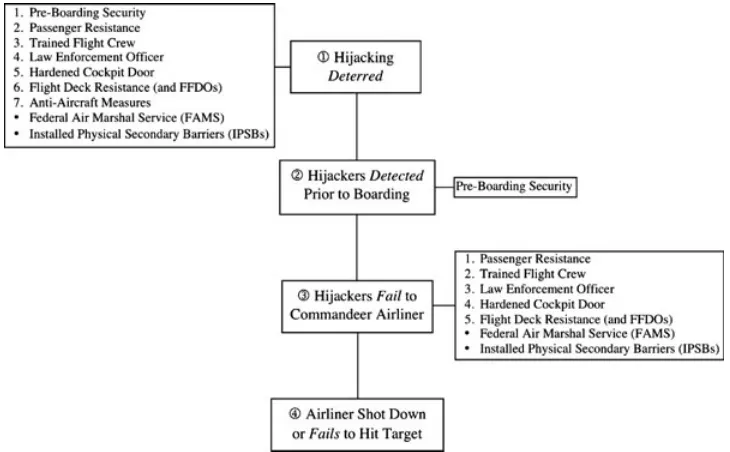
We separated the layers of aviation security into four stages (see Figure 3).3However, although we have a full model of the process, we did not include one impediment to a successful attack: the general incompetence and poor tradecraft of terrorists, particularly in complicated plots (Aaronson, 2013; Kenney, 2010; Mueller, 2013; Mueller & Stewart, 2012).
Source: Air Line Pilots Association International, 2007.
Figure 3. Reliability Block Diagram for Aviation Security Measures.
Stage 1. Terrorists Are Deterred from Attempting an Airliner Hijacking
If security measures deter an attack in the first place, there are unlikely to be any secondary costs, because a deterred attack will not inspire demands for additional security spending. Many reasons might deter a terrorist contemplating a hijacking. In addition to concerns about security measures, a terrorist might be deterred, for example, by the belief that the hijacking will be counterproductive to the cause or by an unwillingness to commit suicide.
Stage 2. Terrorists Attempt a Hijacking, Are Prevented from Boarding
A considerable array of security measures is specifically designed to prevent a ter-rorist from boarding. These includeintelligence,international partnerships,customs and border protection,joint terrorism task forces,the no-fly list,passenger prescreening, behavioral detection officers,travel document checkers,checkpoint/transportation se-curity officers,transportation security inspectors,crew vetting, andrandom employee screening. Any public demand for enhanced security expenditures in response to an attack prevented at this level is likely to be modest.
Stage 3. Terrorists Succeed in Boarding, Are Foiled in the Attempt to Commandeer the Flight Deck
Law enforcement officers (LEOs)are on some flights for reasons other than coun-tering terrorism, such as escorting prisoners or protecting VIPs. However, their numbers are small and their impact on security is likely to be low.
Since 2003, the Federal Aviation Administration (FAA) has required airlines to installhardened cockpit doorsto protect cockpits from intrusion and small-arms fire or fragmentation devices. The FAA also requires that cockpit doors remain locked and cockpit access controlled. There is little doubt that hardened cockpit doors will deter and delay a hijacker’s attempt to enter the cockpit. However, if attackers are somehow able to get into the flight deck, the doors become a security device that could protect them.
Another layer of security is flight deck resistance. With the horrific experience of 9/11 behind them, pilots are very likely to put up a fight against any cockpit penetration, whatever their training or armaments. The Federal Flight Deck Officer (FFDO) program enhances their ability to do so by allowing pilots and crew members to transport and carry firearms to defend the flight deck. It is estimated that 16 to 20 percent of pilots will be FFDOs by 2012 (Elias, 2009), and the program costs only $22 million annually. For its modest cost, and higher coverage than air marshals (discussed below), the Airline Pilots Association International considers the FFDO program to be “an extremely successful and cost-effective layer of aviation security” (Moak, 2011). The Coalition of Airline Pilots Associations recommends doubling the FFDO budget over five years, and Seidenstat (2009) argues that “arming pilots and training crew members to deal with hijackers appear to serve as substitutes for placing marshals on flights and seem to be effective and far less costly” (p. 158).
There are now some 2,500 to 4,000air marshals, up from 33 before 9/11 (Elias, 2009), and by FY2012 the budget for the Federal Air Marshal Service (FAMS) had reached $990 million (Department of Homeland Security [DHS], 2012). In addition, airlines are expected to provide free seats for air marshals. It has been estimated that air marshals ride on less than 5 percent of flights in the United States (Elias, 2009). These are deemed to be high-risk flights, based on intelligence reports. Exactly how that risk has been determined is unclear, however, particularly since air marshals have made no arrests related to terrorism. The presence of air marshals is likely to have a deterrent effect, but this is offset by the low percentage of flights they can cover. In addition, some crew and passengers may be reluctant to be the first to confront a hijacker if they believe an air marshal is on board.4
When the cockpit door is opened for rest periods, toilet breaks, and meals, the protective benefits of a hardened cockpit door is reduced. A 2011 Radio Technical Commission for Aeronautics (RTCA) report examines a hijacking scenario involving “a team of highly trained, armed, athletic individuals” (p. 4) who might be able to take over the flight deck during a door transition in a matter of seconds. Under those circumstances, passengers and crew would scarcely have time to assess the situation, realize the dire threat, communicate with other passengers, and process other information needed for them to summon the courage to fight back. The RTCA report concludes that, under that scenario, “passengers are not considered a pre-dictably reliable option for preventing an attempted violent or sudden breach of the flight deck,” and it completely excludes “the possibility of passenger intervention
4Air marshals might be helpful in other terrorist situations—for example, if a passenger tried to blow up
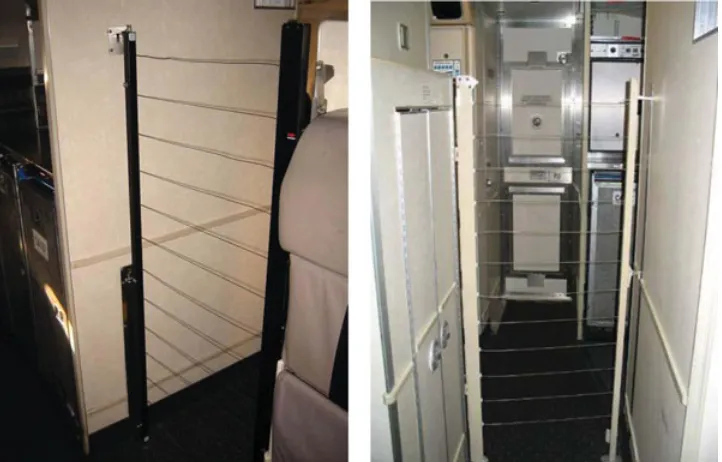
Figure 4. Fully Deployed Installed Physical Secondary Barrier.
as a mitigating measure” from its consideration (RTCA, 2011, p. 29). To a perhaps somewhat lesser degree, the same may hold for air marshals.5
To deal with this contingency, the Air Line Pilots Association International has concluded that “the reinforced flight deck door does not provide a complete solution for securing the flight deck” (Air Line Pilots Association International [ALPA], 2007, p. 2), and in 2004 United Airlines installedImprovised Physical Secondary Barriers (IPSBs)on its entire fleet of passenger aircraft. This is “a lightweight device that is easy to deploy and stow, installed between the passenger cabin and the cockpit door, that blocks access to the flight deck whenever the reinforced door is opened in flight” (ALPA, 2007, p. 3; see Figure 4). The fact that a cabin crew member must be on the scene to deploy the secondary barrier adds another complication for would-be hijackers. The cost of an IPSB for a single aircraft is approximately $30,000 in 2011 dollars. Since there are approximately 6,000 commercial aircraft in the United States, this equates to approximately $200 million, and this cost is annualized over the 20-year design life of an aircraft with a 3 percent discount rate. This equates to a present value cost of $13.5 million per year, or $18.9 million per year for a 7 percent discount rate. We will round this to $20 million per year to be conservative.
Public demands for enhanced security expenditures in response to an attack foiled at this level are likely to be very substantial. There is also likely to be a reduction in the demand for air travel.
Stage 4. Terrorists Succeed in Commandeering the Airliner, Are Kept from Flying It into Their Target
5Although flight attendants receive little or no training in the use of force, many airlines have instituted
The final layer of security concernsantiaircraft defensive measuresput into place after 9/11 (Elias, 2009). If a pilot were able to transmit to air controllers that the plane was undergoing a violent hijacking attempt (or if passengers or cabin crew members were able to use their phones to warn authorities), antiaircraft measures might immediately be scrambled to shoot down or ground the captured airliner before it could reach an intended target. Public demands for enhanced security expenditures in response to an attack foiled at this level are likely to be huge. There is also likely to be a very substantial reduction in the demand for air travel.
EVALUATING THE REDUCTIONS IN RISK
For any security measure, the risk reduction can vary from 0 to 100 percent. Fault trees and logic diagrams, together with systems engineering and reliability approaches, will aid in assessing complex interactions involving threats, vulner-abilities, and consequences (Stewart & Melchers, 1997). Applying this approach, Figure 3 shows a reliability block diagram used to represent the system of deter-ring or foiling a terrorist hijacking on a commercial airplane as discussed above. Existing measures (or “business as usual”) include all layers of security described above, including FAMS but not IPSBs. While many policy options and strategies are available, we will examine three that deal with FAMS (an expensive measure) and IPSBs (an inexpensive one):
1. Include both IPSBs and FAMS in the array of security measures. 2. Include IPSBs but not FAMS in the array of security measures. 3. Exclude both FAMS and IPSBs from the array of security measures.
We recognize that security measures may not be perfectly substitutional (i.e., independent of each other). For example, removing one layer of security may alter the systems model and/or detection rates of other layers of security. Therefore, we assumed a series system where many event probabilities for all layers of security are treated as conditional probabilities. Hence, Pr(foiled by door|no IPSB) denotes that the effectiveness of the hardened cockpit door will be influenced by whether an IPSB is present, since the absence of an IPSB may mean that flight crew are more careful during door transitions. The probability that an attempt to hijack an aircraft is deterred or fails to be successful is a measure of total risk reduction equal to
R=1−
The two security measures under examination (FAMS and IPSBs) affect the stage 1 probability of deterrence Pr(deterred), and the stage 3 probability Pr(fail to com-mandeer aircraft). The latter probability is affected by interactions between the hardened cockpit door, flight deck resistance, and the three policy scenarios for FAMS and IPSBs set out above. The derivations of these probabilities are described in the Appendix.6Equation (4) shows the benefits of multiple layers of security. For example, if each of the four probabilities in equation (4) is 50 percent, the overall
6All appendices are available at the end of this article as it appears in JPAM online. Go to the publisher’s
Table 1.Words of estimative probability and triangular distribution.
Certain 100%
Almost certain 93%
Highly probable 85%
Probable 75%
Chances about even 50%
Probably not 30%
Almost certainly not 7%
Impossible 0%
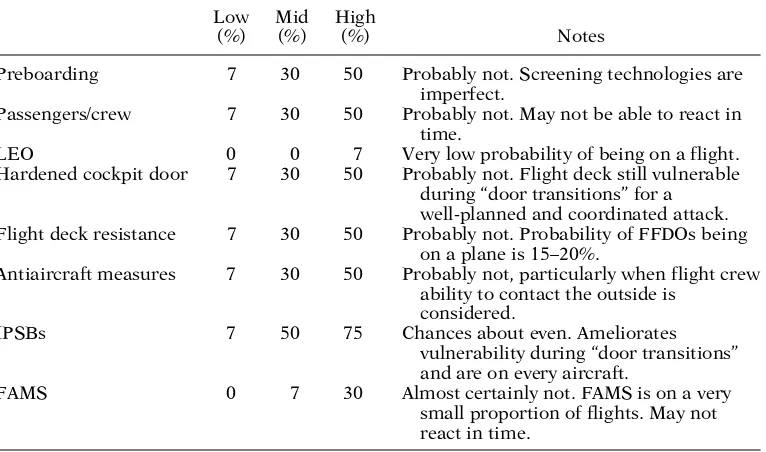
Table 2.Deterrent rates for aviation security measures in stage 1.
Low Mid High
(%) (%) (%) Notes
Preboarding 7 30 50 Probably not. Screening technologies are
imperfect.
Passengers/crew 7 30 50 Probably not. May not be able to react in
time.
LEO 0 0 7 Very low probability of being on a flight.
Hardened cockpit door 7 30 50 Probably not. Flight deck still vulnerable
during “door transitions” for a well-planned and coordinated attack.
Flight deck resistance 7 30 50 Probably not. Probability of FFDOs being
on a plane is 15–20%.
Antiaircraft measures 7 30 50 Probably not, particularly when flight crew
ability to contact the outside is considered.
IPSBs 7 50 75 Chances about even. Ameliorates
vulnerability during “door transitions” and are on every aircraft.
FAMS 0 7 30 Almost certainly not. FAMS is on a very
small proportion of flights. May not react in time.
risk reduction is high,R=93.75 percent. Additional layers of security will increase this risk reduction, but the additional risk reduction of each layer (R) will become progressively smaller.
Note that equation (4) is based on a single threat scenario, whereas security measures are often designed to deal with a range of threats. A more detailed and comprehensive study is required to properly model the complex interactions and interdependencies in aviation security. Nonetheless, equation (4) provides a basis to assess the influence and sensitivity of policy options on risk reduction.
Table 3.Disruption rates for aviation security measures in stage 2.
Low Mid High
(%) (%) (%) Notes
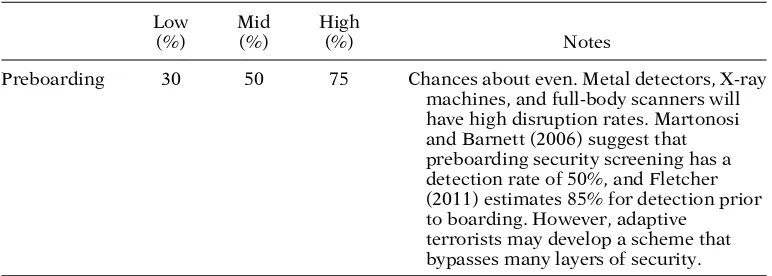
Preboarding 30 50 75 Chances about even. Metal detectors, X-ray
machines, and full-body scanners will have high disruption rates. Martonosi and Barnett (2006) suggest that preboarding security screening has a detection rate of 50%, and Fletcher (2011) estimates 85% for detection prior to boarding. However, adaptive
terrorists may develop a scheme that bypasses many layers of security.
probably not,chances about even, and so forth when assessing the effectiveness of security measures; Table 1 translates these words into probabilities.
We tended to err on the low side in estimating deterrence and disruption rates in Tables 2–4. This biases the analysis toward finding additional levels of security to be cost-effective. A sensitivity analysis conducted later assesses changes in risk reduction and cost-effectiveness if some of these rates are changed.
Monte Carlo simulation was used to calculate the mean and 10th and 90th per-centiles that a hijacking would be unsuccessful (fail to strike its target) or total risk reduction (R); see Table 5. The likelihood of foiling a hijacking will be higher, and the potential for risk reduction for additional security measures will decrease, if the existing measures have higher deterrent or disruption rates or if additional factors not related to specific security measures are helping to deter a terrorist attempt. Table 5 shows that total risk reduction (R) was nearly 99 percent for the full array of existing measures excluding both IPSBs and FAMS. In the simulation where IPSBs were added, risk reduction increased to nearly 100 percent. The best estimate of additional risk reduction due to IPSBs was nearly 1 percent, and its upper bound was 2 percent, something that can be achieved with an expenditure of less than $20 million per year. Adding FAMS reduced risk by a negligible amount (less than 0.1 percent) while costing nearly $1 billion. This observation alone provides strong evidence that FAMS fails to be cost-effective.
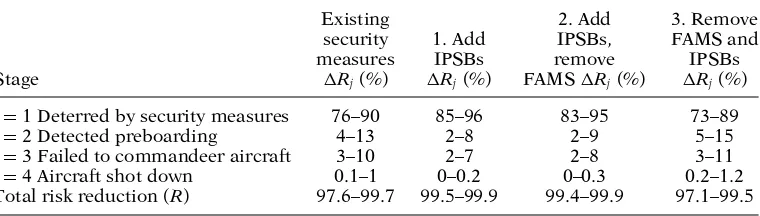
A breakdown of risk reductions for each stage of aviation security (Rj) showed that deterrence was responsible for 76 to 96 percent of risk reduction (see Table 6). Any opportunity for risk reduction by additional measures was rather low.
Direct Costs for Security Measures
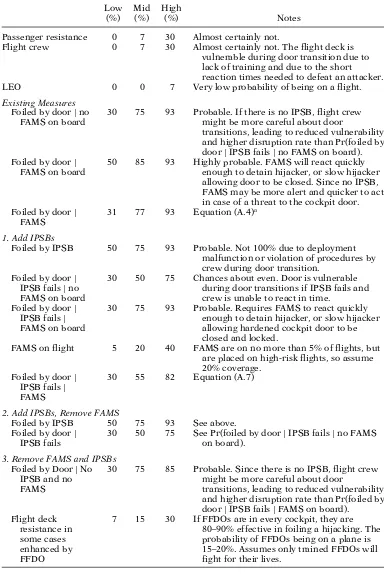
Table 4.Disruption rates for aviation security measures in stages 3 and 4.
Low Mid High
(%) (%) (%) Notes
Passenger resistance 0 7 30 Almost certainly not.
Flight crew 0 7 30 Almost certainly not. The flight deck is
vulnerable during door transition due to lack of training and due to the short reaction times needed to defeat an attacker.
LEO 0 0 7 Very low probability of being on a flight.
Existing Measures
Foiled by door|no
FAMS on board
30 75 93 Probable. If there is no IPSB, flight crew
might be more careful about door
transitions, leading to reduced vulnerability and higher disruption rate than Pr(foiled by
door|IPSB fails|no FAMS on board).
Foiled by door|
FAMS on board
50 85 93 Highly probable. FAMS will react quickly
enough to detain hijacker, or slow hijacker allowing door to be closed. Since no IPSB, FAMS may be more alert and quicker to act in case of a threat to the cockpit door.
Foiled by door|
FAMS
31 77 93 Equation (A.4)a
1. Add IPSBs
Foiled by IPSB 50 75 93 Probable. Not 100% due to deployment
malfunction or violation of procedures by crew during door transition.
Foiled by door|
IPSB fails|no
FAMS on board
30 50 75 Chances about even. Door is vulnerable
during door transitions if IPSB fails and crew is unable to react in time.
Foiled by door|
IPSB fails|
FAMS on board
30 75 93 Probable. Requires FAMS to react quickly
enough to detain hijacker, or slow hijacker allowing hardened cockpit door to be closed and locked.
FAMS on flight 5 20 40 FAMS are on no more than 5% of flights, but
are placed on high-risk flights, so assume 20% coverage.
Foiled by door|
IPSB fails|
FAMS
30 55 82 Equation (A.7)
2. Add IPSBs, Remove FAMS
Foiled by IPSB 50 75 93 See above.
Foiled by door|
IPSB fails
30 50 75 See Pr(foiled by door|IPSB fails|no FAMS
on board).
3. Remove FAMS and IPSBs
Foiled by Door|No
IPSB and no FAMS
30 75 85 Probable. Since there is no IPSB, flight crew
might be more careful about door
transitions, leading to reduced vulnerability and higher disruption rate than Pr(foiled by
door|IPSB fails|FAMS on board).
Flight deck resistance in some cases enhanced by FFDO
7 15 30 If FFDOs are in every cockpit, they are
Table 4.Continued.
Low Mid High
(%) (%) (%) Notes
Antiaircraft measures
7 30 50 Probably not. Authorities may not be able to
deploy antiaircraft measures in time.
aAll appendices are available at the end of this article as it appears in JPAM online. Go to the publisher’s
Web site and use the search engine to locate the article at http://www3.interscience.wiley.com/cgi-bin/ jhome/34787.
Table 5.Risk reduction.
Total risk reduction (R) Increase in risk reduction
10th 90th 10th 90th
percentile Mean percentile percentile Mean percentile
(%) (%) (%) (%) (%) (%)
Existing measures 97.6 98.9 99.7 – – –
1. Include both IPSBs and FAMS 99.5 99.8 99.9 0.2 0.9 2.0
2. Include IPSBs, remove FAMS 99.4 99.7 99.9 0.2 0.8 1.9
3. Remove both FAMS and IPSBs 97.1 98.6 99.5 −0.1 −0.3 −0.6
Table 6.Tenth and 90th bounds of risk reductions for stages of deterrence or disruption.
Existing 2. Add 3. Remove
security 1. Add IPSBs, FAMS and
measures IPSBs remove IPSBs
Stage Rj(%) Rj(%) FAMSRj(%) Rj(%)
j=1 Deterred by security measures 76–90 85–96 83–95 73–89
j=2 Detected preboarding 4–13 2–8 2–9 5–15
j=3 Failed to commandeer aircraft 3–10 2–7 2–8 3–11
j=4 Aircraft shot down 0.1–1 0–0.2 0–0.3 0.2–1.2
Total risk reduction (R) 97.6–99.7 99.5–99.9 99.4–99.9 97.1–99.5
security activities and expenditures, then this amounts to at least $3 to $4 billion per year, and adding in the cost of FAMS ($990 million) gives a total of at least Csecurity =$4 billion for existing measures including FAMS but not IPSBs. Adding IPSBs increases this by $20 million. We assumed that the federal government would compensate airlines for IPSBs.
Security costs (Csecurity) for the policy scenarios are as follows: 1. Include both FAMS and IPSBs: $4.02 billion.
2. Include IPSBs but not FAMS: $3.02 billion (saving $1 billion per year). 3. Include neither FAMS nor IPSBs: $3 billion.
and anxiety can deter many from flying at all. The omission of these opportunity costs biases the calculations toward finding that measures are cost-effective and that decisions are not risk-averse.
Consequences of a Successful Hijacking
The losses when an aircraft is successfully hijacked and flown into a target are considerable, particularly when one includes follow-on or secondary economic costs and social disruption. A 2005 RAND study hypothesized that the downing of an airliner by a shoulder-fired missile would lead to a total loss of more than $15 billion (Chow et al., 2005). The attack on the Pentagon on 9/11 caused up to $10 billion in losses counting physical damage, loss of life, and indirect losses such as social and business disruptions (Mueller & Stewart, 2011a, 2011b).
The September 11, 2001 attack directly resulted in the deaths of nearly 3,000 people. Following the widely applied value of statistical life (VSL) approach, a report for the DHS concluded that the best cost estimate for homeland security analysis is about $6.5 million in 2010 dollars (Robinson et al., 2010). Most VSL studies have focused on relatively common risks (e.g., workplace or motor vehicle accidents), and Robinson et al. (2010) suggested that more involuntary, uncontrollable, and dread risks may be assigned a higher VSL. Such a process would essentially add into the analysis much of the substantial indirect and ancillary costs associated with a terrorist event. Our analysis uses the lower figure of $6.5 million per life saved and then adds the other costs to this figure. However, the basic point, that people often effectively place a higher value on a life lost to terrorism than on one lost to more mundane and less sensational hazards, should be kept in mind.
Using a VSL of $6.5 million leads to a loss of approximately $20 billion arising from 3,000 fatalities. In addition, 9/11 caused approximately $30 billion in physical damage including rescue and clean-up costs (Bram, Orr, & Rapaport, 2002). Indirect costs were even more substantial. Thus, the International Monetary Fund estimated that the 9/11 attacks cost the U.S. economy up to 0.7 percent in lost GDP ($100 billion in 2010 dollars, adjusting for inflation) in that year alone, while others have estimated that associated business costs and loss of tourism cost the U.S. economy $190 billion over three years (Hook, 2008). Blomberg and Rose (2009) estimated that the impact on the U.S. economy of the 9/11 attacks ranged from 0.3 to 1 percent of GDP, or $50 to $150 billion in 2010 to 2011 dollars. An upper bound estimate of the losses of 9/11 might approach $200 billion—or $100 billion for a single aircraft, as most losses arose from the devastating attacks on the World Trade Center by two separate aircraft (Mueller & Stewart, 2011a).
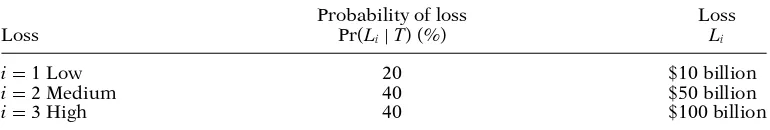
The $10 billion in losses from the 9/11 attack on the Pentagon would be a plausible lower value—henceL1=$10 billion. Moreover,L3=$100 billion in losses, equivalent to the 9/11 losses from a single aircraft, is a plausible upper bound. A medium loss ofL2 =$50 billion is reasonable; see Table 7. These consequences include direct, indirect, and induced losses.
Table 7.Probabilistic and loss data for hypothetical threats and losses.
Probability of loss Loss
Loss Pr(Li|T) (%) Li
i=1 Low 20 $10 billion
i=2 Medium 40 $50 billion
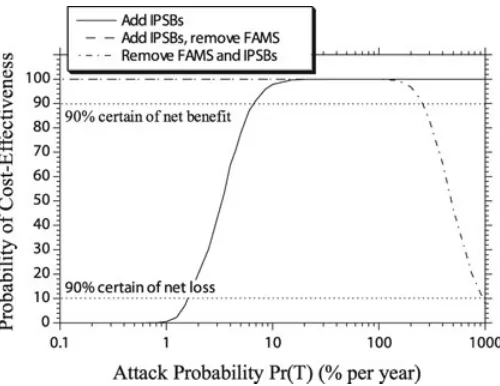
Figure 5. Probability of Cost-Effectiveness (Net Present Value Exceeds Zero).
RESULTS
Monte Carlo simulation was used to calculate the mean and 10th and 90th per-centiles of net present value (NPV or net benefit) and expected utilities because losses and risk reduction are stochastic variables. Since the analysis considered only the costs and benefits for the following year, discounting of costs and bene-fits was not required. However, for a longer time period, results may be sensitive to discount rates used (Boardman et al., 2011) as is the relationship between dis-count rates and risk aversion (Snell, 2011). These issues are beyond the scope of the present paper.
It should be noted that there can be considerable additional costs for successfully disrupting a plot because the experience can heighten public averseness to travel (Cadd). For example, a 1 percent drop in global passenger numbers for one year would reduce airline revenues by $5 billion (International Air Transport Association [IATA], 2011). This might particularly occur if a hijacking attempt were disrupted in an attempt to breach the hardened cockpit door (stage 3). These additional costs would be much higher if an airliner were shot down (stage 4): in this case, they might equal the lower bound of losses from a successful attack (such as the one on the Pentagon) ofCadd,4 =$10 billion. There would be no additional cost for a deterred plot (stage 1), and we assumed modest costs ofCadd,2=$500 million for an attack that is foiled prior to boarding (stage 2).
Net Present Value
If u(x) = x, then equation (2) equates to a present value, and the NPV (or net benefit) is the present value for business as usual (existing measures) minus the present value for a policy scenario. This is a risk-neutral decision analysis. Figure 5 shows the probability that NPV> 0 for the three policy options. A reduction in risk may cause NPV>0 but only if there is a reduction in security cost, and if the increase in expected losses is less than the reduction in costs.
Table 8.Probability that a policy option has higher utility than existing measures.
Attack Include both Include IPSBs, Remove both
probability IPSBs and FAMS remove FAMS FAMS and IPSBs
Pr(T) γ =0 γ =2 γ =5 γ =10 γ=0 γ=2 γ =5 γ =10 γ=0 γ=2 γ=5 γ =10
100% 100% 100% 100% 100% 100% 100% 100% 100% 100% 96% 8% 3%
50% 100% 100% 100% 100% 100% 100% 100% 100% 100% 100% 41% 4%
10% 98% 100% 100% 100% 100% 100% 100% 100% 100% 100% 100% 5%
5% 80% 98% 100% 100% 100% 100% 100% 100% 100% 100% 100% 8%
1% 1% 23% 98% 100% 100% 100% 100% 100% 100% 100% 100% 52%
0.5% 0% 2% 88% 100% 100% 100% 100% 100% 100% 100% 100% 100%
0.1% 0% 0% 7% 100% 100% 100% 100% 100% 100% 100% 100% 100%
0.01% 0% 0% 0% 90% 100% 100% 100% 100% 100% 100% 100% 100%
0.001% 0% 0% 0% 0% 100% 100% 100% 100% 100% 100% 100% 100%
0.0001% 0% 0% 0% 0% 100% 100% 100% 100% 100% 100% 100% 100%
policy option that added IPSBs and removed FAMS produced higher net benefits. In this case, NPV was positive and probability of cost-effectiveness was 100 percent for all attack probabilities no matter how small. This arose because risk reduction was 0.8 percent higher than existing measures (see Table 5), and at substantially reduced cost ($980 million). The break-even analysis showed that attack probability needed to exceed 260 percent or 2.6 attacks per year for 90 percent surety that re-taining FAMS was cost-effective. Such high attack probabilities are scarcely being observed, strongly suggesting that FAMS fails a cost-benefit assessment.
Expected Utility and Risk Aversion
Expected utilities were calculated for the three policy options and existing measures (business as usual) ENO[u] for attack probabilities of 0.0001 to 100 percent per year, andLmax=$104,020 (maximumCsecurity+L3). A security measure was the preferred policy option if its expected utility exceeded ENO[u]. Table 8 shows the probability that a policy option would be preferred for various attack probabilities and levels of risk aversion. A risk-neutral or linear utility function (γ = 0) yielded the same results as an NPV assessment. However, as degree of risk aversion increased (γ >0), there was higher likelihood that adding IPSBs would be the preferred option even as attack probability decreased. Hence, for an extreme degree of risk aversion (γ = 10, see Figure 2), the security measure was 90 percent likely to be efficient for attack probabilities as low as 0.01 percent per year. This is probably understandable given the costs for IPSBs are minor at $20 million per year.
A policy of including IPSBs in the array of security measures while excluding FAMS was always the preferred policy option irrespective of the degree of risk aversion, as a measure that increases risk reduction at lower cost should always be preferred.
In other words, when decisionmakers are risk-averse, they prefer a guaranteed large loss even though the probability of even larger losses is very small. Experience would suggest that few, if any, government agencies, such as the U.S. Nuclear Reg-ulatory Commission or Environmental Protection Agency, exhibit anywhere near this level of risk aversion in their public decisionmaking (Ball & Floyd, 1998; Stew-art, Ellingwood, & Mueller, 2011). However, if the likelihood of a terrorist airliner hijacking is less than 0.5 percent per year, or one attack every 200 years, even a significantly risk-averse decisionmakers would prefer to remove FAMS.
The analysis herein is a comparative analysis, so while the expected utilities would differ for other utility functions, the trends would be very similar to those shown above.
Sensitivity Analysis
Note that the results change for different input variables, but the trends are still the same. When the likelihood of large losses was increased to 50 percent (average loss is $75 billion), the break-even attack probabilities changed from 3 to 2.5 percent and 260 to 370 percent, for including both IPSBs and FAMS and for removing both FAMS and IPSBs, respectively. The probability that a policy option would be preferred based on expected utility changed by no more than 10 percent.
When the additional costs of a foiled attack were ignored (Cadd =0), the break-even attack probabilities increased from 3 to 4 percent and 260 to 550 percent, for adding IPSBs and for removing FAMS and IPSBs, respectively. The probability that a policy option would be preferred based on expected utility (Table 8) changed by less than 5 percent.
When we halved the deterrent rates of existing measures except for FAMS and IPSBs, then the mean additional risk reduction by adding IPSBs more than doubled to 2 percent and the attack probability needed to exceed only 1 percent per year for IPSBs to be cost-effective. Risk reduction was reduced by 1 percent when FAMS and IPSBs were removed, and the break-even attack probability was reduced to 1.7 attacks per year.
As noted, we have erred on the conservative side by selecting low rates of disrup-tion for passengers and flight crew. When these are increased as in Tables 4 to 7, 30, and 50 percent (low, mid, and high), the break-even attack probabilities increase from 3 to 4 percent and 260 to 590 percent, for adding IPSBs and for removing both FAMS and IPSBs, respectively. Or if we assume that flight deck crew (and not just FFDOs) will actively resist any intrusion to the flight deck, then rates of disruption increase to 15, 30, and 50 percent (low, mid, and high). Break-even attack proba-bilities would then need to exceed 490 percent for FAMS to be cost-effective. The sensitivity analyses above show that attack probabilities have to be very high indeed for FAMS to pass a cost-benefit assessment.
CONCLUSIONS
in which it was not clear “what problem is being addressed” (p. 64). Since it does not seem to follow any well-accepted risk assessment methodology, DHS should not claim that its deliberations are “risk-based” when the evidence suggests otherwise.
A key problem in much homeland security analysis is the tendency to take a selective approach to risk assessment, focusing almost exclusively on imagining hazard scenarios (mostly rather extreme ones) and then analyzing the prospective consequences. There is relative neglect of several steps that are crucial for risk assessment to have any real credibility:
r
Establishing and trying to quantify threat likelihood.r
Evaluating risks.r
Setting risk acceptance criteria.r
Establishing how much risk is likely to be reduced as a result of new security measures.This paper shows how these steps can be used in a security risk analysis frame-work. The framework also serves to illustrate some important aspects of risk aver-sion for public deciaver-sionmaking, and the findings are robust to changes in parameter values. We have used well-known and accepted utility theory, and while the methods are not novel, the application to aviation security measures has not been attempted previously. The methods can be applied to other counterterrorism expenditures, such as airport security screening, infrastructure protection, and policing. More-over, if public policymakers make decisions that might not be supported by a quan-titative decision analysis, their degree of risk averseness needs to be quantified, and compared with other public policy decisions. This would make the trade-offs more transparent and highlight the degree to which risk aversion is excessive or justified. In this paper, risk reductions were estimated for each layer of security designed to prevent commercial airliners from being commandeered by terrorists, kept under control for some time, and then crashed into specific targets. The total risk reduction from existing security measures is a high 98 to 99 percent. Policy options to reduce the remaining risk included adding IPSBs to aircraft and removing FAMS. It was found that attack probabilities would need to exceed 260 percent or 2.6 attacks per year to be 90 percent sure that FAMS is cost-effective. A policy option of “business as usual” is optimal for lower attack probabilities because the large cost of FAMS fails to be offset by its benefit. On the other hand, IPSBs have more than 90 percent chance of being cost-effective even if attack probabilities are as low as 6 percent per year.
It was also shown that the level of risk averseness needed to justify current aviation security expenditures is considerable. Even applying estimates that generally bias the case in favor of finding airline security measures to be cost-effective, it seems likely that far too much is being spent to address the problem of airline hijacking. For example, removing FAMS will lower risk reduction negligibly at most while saving a billion dollars a year. Many spending reductions could likely be made with little or no consequent reduction in security. Further research may focus on collecting and analyzing performance data on the effectiveness and the interaction of other specific security measures while also including opportunity costs in the decision analysis. MARK G. STEWART is Australian Professorial Fellow, Professor, and Director, Centre for Infrastructure Performance and Reliability, The University of Newcastle, Newcastle NSW 2308, Australia.
ACKNOWLEDGMENTS
The first author appreciates the financial support of the Australian Research Council.
REFERENCES
Aaronson, T. (2013). The terror factory. Brooklyn, NY: Ig Publishing.
Air Line Pilots Association International [ALPA]. (2007). Secondary flight deck barriers and flight deck access procedures: A call for action (ALPA White Paper). Washington, DC: Author.
Ball, D. J., & Floyd, P. J. (1998). Societal risks (Final Report, commissioned by the Health and Safety Executive, United Kingdom). Retrieved April 24, 2013, from http://www.rpaltd.co. uk/documents/J198-SocietalRisk.pdf.
Bickel, E. (2006). Some determinants of corporate risk aversion. Decision Analysis, 3, 233– 251.
Blomberg, S. B., & Rose, A. Z. (2009). Editor’s introduction to the economic impacts of the september 11, 2001, Terrorist Attacks. Peace Economics, Peace Science, and Public Policy, 15, 1–14.
Boardman, A. E., Greenberg, D. H., Vining, A. R., & Weimer, D. L. (2011). Cost-benefit analysis: Concepts and practice. Boston: Pearson.
Bram, J., Orr, J., & Rapaport, C. (2002). Measuring the effects of the September 11 attack on New York City. FRBNY Economic Policy Review, November, 5–20.
Cha, E. J., & Ellingwood, B. R. (2012). Risk-averse decision-making for civil infrastructure exposed to low-probability, high-consequence hazards. Reliability Engineering and System Safety, 104, 27–35.
Chow, J., Chiesa, J., Dreyer, P., Eisman, M., Karasik, T. W., Kvitky, J., Lingel, S., Ochmanek, D., & Shirley, C. (2005). Protecting commercial aviation against the shoulder-fired missile threat. Santa Monica, CA: RAND Corporation.
Department of Homeland Security [DHS]. (2012). FY 2012 budget in brief. Retrieved April 24, 2013, from http://www.dhs.gov/xlibrary/assets/budget-bib-fy2012.pdf.
Elias, B. (2009). Airport and aviation security: U.S. policy and strategy in the age of global terrorism. Boca Raton, FL: CRC Press.
Ellingwood, B. R. (2006). Mitigating risk from abnormal loads and progressive collapse. Journal of Performance of Constructed Facilities, 20, 315–323.
Fletcher, K. C. (2011). Aviation security: Case for risk-based passenger screening (Master’s
thesis). Retrieved April 24, 2013, from www.hsdl.org/?view&did=699603.
Gkritza, K., Niemeier, D., & Mannering, F. (2006). Airport security screening and changing passenger satisfaction: An exploratory assessment. Journal of Air Transport Management, 12, 213–219.
Grosskopf, K. R. (2006). Evaluating the societal response to antiterrorism measures. Journal of Homeland Security and Emergency Management, 3. Retrieved April 24, 2013, from http://www.degruyter.com/view/j/jhsem.2006.3.2/issue-files/jhsem.2006.3.issue-2.xml. Hardaker, J. B., Fleming, E., & Lien, G. (2009). How should governments make risky policy
decisions? Australian Journal of Public Administration, 68, 256–271.
Hook, S. (2008). Assessing expenditures in individual agencies: The case of the Australian Federal Police. In C. Ungerer, H. Ergas, S. Hook, & M. Stewart (Eds.), Risky business: Measuring the costs and benefits of counter-terrorism spending (pp. 13–18). Canberra: Australian Strategic Policy Institute.
International Air Transport Association [IATA] (2011). Annual report. Retrieved April 24, 2013, from http://www.iata.org/pressroom/Documents/annual-report-2011.pdf.
Kaplan, S., & Garrick, B. J. (1981). On the quantitative definition of risk. Risk Analysis, 1, 11–27.
Kenney, M. (2010). “Dumb” yet deadly: Local knowledge and poor tradecraft among Islamist militants in Britain and Spain. Studies in Conflict and Terrorism, 31, 1–22.
Martonosi, S. E., & Barnett, A. (2006). How effective is security screening of airline passen-gers? Interfaces, 36, 545–552.
Moak, L. (2011). [Letter to House Subcommittee on Transportation Security, President of Air Line Pilots Association International.] Retrieved April 24, 2013, from http://www.alpa.org/ Portals/Alpa/PressRoom/PressReleases/2011/TSAReauthFY2012-2013_7-12-11.pdf. Mueller, J. (2013). Terrorism since 9/11: The American cases. Retrieved April 24, 2013, from
http://politicalscience.osu.edu/faculty/jmueller/since.html.
Mueller, J., & Stewart, M. G. (2011a). Terror, security, and money: Balancing the risks, benefits, and costs of homeland security. New York: Oxford University Press.
Mueller, J., & Stewart, M. G. (2011b). The price is not right: The U.S. spends too much money to fight terrorism. Playboy, 58, 149–150.
Mueller, J., & Stewart, M. G. (2012). The terrorism delusion: America’s overwrought response to September 11. International Security, 37, 81–110.
National Research Council [NRC] (2010). Review of the Department of Homeland Security’s approach to risk analysis. Washington, DC: National Research Council of the National Academies, National Academies Press.
Office of Management and Budget [OMB] (1992). Guidelines and discount rates for benefit-cost analysis of federal program (Circular No. A-94). Washington, DC: Author.
Pat´e-Cornell, E. (2002). Risk and uncertainty analysis in government safety decisions. Risk Analysis, 22, 633–646.
Robinson, L. A., Hammitt, J. K., Aldy, J. E., Krupnick, A., & Baxter, J. (2010). Valuing the risk of death from terrorist attacks. Journal of Homeland Security and Emergency Management, 7, Article 14.
RTCA (2011). Aircraft secondary barriers and alternative flight deck security procedures (RCA Report No. DO-329). Washington, DC: Radio Technical Commission for Aeronautics. Seidenstat, P. (2009). Federal Air Marshals: The last line of defense. In P. Seidenstat & F. X.
Splane (Eds.), Protecting airline passengers in the age of terrorism (pp. 149–159). Santa Barbara, CA: Greenwood Publishing Group.
Snell, M. (2011). Cost-benefit analysis: A practical guide. London: Thomas Telford.
Stewart, M. G., & Melchers, R. E. (1997). Probabilistic risk assessment of engineering systems. London: Chapman & Hall.
Stewart, M. G., & Mueller, J. (2008). A risk and cost-benefit assessment of U.S. aviation security measures. Journal of Transportation Security, 1, 143–159.
Stewart, M. G., & Mueller, J. (2011). Cost-benefit analysis of advanced imaging technology full body scanners for airline passenger security screening. Journal of Homeland Security and Emergency Management, 8, Article 30.
Stewart, M. G., & Mueller, J. (2013). Terrorism risks and cost-benefit analysis of avia-tion security. Risk analysis. Advance online publicaavia-tion. Retrieved April 24, 2013, from http://onlinelibrary.wiley.com/doi/10.1111/j.1539-6924.2012.01905.x/full.
Stewart, M. G., Ellingwood, B. R., & Mueller, J. (2011). Homeland security: A case study in risk aversion for public decision-making. International Journal of Risk Assessment and Management, 15, 367–386.
Sunstein, C. R. (2002). The cost-benefit state: The future of regulatory protection. Chicago: ABA Publishing.
APPENDIX
Pr (foiled in flight)=1−
⎧ ⎨
⎩
[1−Pr (foiled by passengers)] ×[1−Pr (foiled by flight crew)] ×[1−Pr (foiled by LEO)]
⎫ ⎬
⎭
(A.1)
Note: LEO=law enforcement officer.
Existing Security Measures
[1−Pr (deterred by pre− boarding security measures)] ×[1−Pr (deterred by passenger and flight crew resistance)] ×[1−Pr (deterred by hardened cockpit door)]
×[1−Pr (deterred by FAMS)] ×[1−Pr (deterred by LEO)]
×[1−Pr (deterred by flight deck resistance)] ×[1−Pr (deterred by anti−aircraft measures)]
⎫
Pr (failed to commandeer airliner)
=1−
×[1−Pr (foiled by flight deck resistance)]
⎫ ⎬
⎭
(A.3)
Pr(foiled by flight deck resistance) is the probability that pilots and Federal Flight Deck Officers (FFDOs) will successfully resist an intrusion into the flight deck either by the use of personal firearms or, if not armed, by other means at their disposal. Pr(foiled by door | FAMS) is the sum of the disruption rate without Federal Air Marshal Service (FAMS) and the incremental increase in disruption rates due to having FAMS on the flight. Hence,
1. Include both IPSBs and FAMS
Pr (deterred|IPSB )=[1−Pr (deterred))]×[1−Pr (deterred by IPSB)] (A.5)
Pr (failed to commandeer airliner)
=1−
×[1−Pr (foiled by flight deck resistance)]
⎫
Pr(foiled by IPSB) is the probability that the IPSB is deployed and will function as intended and delay a hijacker sufficiently to allow the cockpit door to be closed.
Prfoiled by doorIPSB fails|FAMS
2. Include IPSBs, remove FAMS
Pr (deterred|IPSB, no FAMS )=1−Pr (deterred|IPSB )!1−Pr (deterred by FAMS) (A.8) Pr (failed to commandeer airliner)
=1−
×[1−Pr (foiled by flight deck resistance)]
×[1−Prfoiled by doorIPSB failsno FAMS on board]
3. Remove both FAMS and IPSBs
Pr (deterred|no FAMS )=1−Pr (deterred)!1−Pr (deterred by FAMS) (A.10)
Pr (failed to commandeer airliner)
=1−
×[1−Pr (foiled by flight deck resistance)]
![Figure 1. The expected utility E[u] from this event tree is](https://thumb-ap.123doks.com/thumbv2/123dok/3122839.1727999/3.504.112.383.52.164/figure-expected-utility-e-u-event-tree.webp)