International Social Sciences
Academic Conference (ISSAC)
23-24 AUGUST 2017
International Social Sciences
Academic Conference (ISSAC)
23-24 AUGUST 2017
PROCEEDINGS
International Social Sciences Academic Conference 2017
Published by MNNF Publisher
Copyright © 2017 by MNNF Publisher
All rights reserved. No part of this publication may be reproduced, stored in a retrieval
system, or transmitted in any form or any means, electronic, mechanical,
photocopying, recording or otherwise, without prior permission, in writing, from the
publisher.
The views and opinions expressed therein and those of the individual authors and the
publication of statements in the Proceeding do not imply endorsements by the
publisher or the editorial staff.
Perpustakaan Negara Malaysia
Contents
The Effect of Product Features of Solah Kit in Creating
Religious Satisfaction and Its Compatibility to Sunnah
Practice
Aini Hayati Musa, Siti Sara Ibrahim, Farrah Nadia Baharuddin, Alia Nadira
Rosle, Rafidah Mohd Azli
Cultivating Islamic Marketing Approach
– Customer’s
Buying Decision towards Takaful Services
Aini Hayati Musa, Siti Hajar Md Jani, Nabilah Abdul Shukur, Noor Hasvenda
Abd Rahim, Mumtaz Ahmad, Tengku Sharifeleani Ratul Maknu, Intan Syafinaz
Mat Shafie
Assessing the Relationship between Favouritism and Job
Performance in Family-Owned Business
Syaimaa Amira Mohamad Yusof, Fadilah Puteh
Words and Meanings in Thai Traditional Folk Songs and
Cultural Communication across the Regions in the Thai
Context
Wassamill Watcharakaweesilp
Favoritism
and
Job
Performance
in
Family-Owned
Business: Effect of Leadership Style
Syaimaa Amira Mohamad Yusof, Fadilah Puteh
1
5
10
15
24
29
34
39
45
The Analysis of Market Reaction To Bank Indonesia Policy in
Credit Sector
Abednego Priyatama, Prihantoro
Assessing Credit Risk and Bank Performance: The Case of
Malaysia
Alia Nadira Rosle, Nur Izzah Jamil, Aini Hayati Musa
“
Kalam Suruhan Surah Al-Baqarah
(KALAM)”
Android
Application: 21
stCentury M-Learning Medium in Islamic
Sciences
Nuril Ham Al Hafizah Zahari, Sharifah Norshah Bani Syed Bidin, Syadiah Nor
Wan Syamsuddin
Enforcing
Patient-
Doctor’s
Communication
– Patient’s
Satisfaction towards Healthcare Services
Mumtaz Ahmad, Aini Hayati Musa
Enforcing Building Consumer Brand Preference through
Corporate Social Responsibility Activities in the Hospitality
Industry
P
1
Proceeding: International Social Sciences Academic Conference (ISSAC 2017) 23-24 August 2017 Jakarta, Indonesia
The Effect of Product Features of Solah Kit in
Creating Religious Satisfaction and Its Compatibility
to Sunnah Practice
Aini Hayati Musa
1, Siti Sara Ibrahim
2, Farrah Nadia Baharuddin
2, Alia Nadira Rosle
3,
Rafidah Mohd Azli
41Faculty of Business Management, Universiti Teknologi MARA, 72000, Malaysia 2Faculty of Business Management, Universiti Teknologi MARA, 71300, Malaysia
3Department of Computer and Mathematical Sciences, Universiti Teknologi MARA, 71300, Malaysia 4Academy of Contemporary Islamic Studies, Universiti Teknologi MARA, 72000, Malaysia
Abstract—Understanding new product features are strategically important to create as well as to meet customer demand. It is also can act as a competitive advantage for the organization and the uniqueness of the product can set it apart from its competitors. The market success of a product is solely depend on clearly understanding customer needs and wants and providing a product at a competitive price. Due to this reasons, this paper is attempt to study on the effect
of product features of “Solah Kit” in creating religious satisfaction
and its compatibility to Sunnah practice. Easy-Solah Kit has a great potential to be commercialize in the market. The evaluations of
product features of “Solah Kit” were based on its material, design, product complementary and adhere to airline standard. The study involved with forty (40) travelers as respondents and the data were obtained by using a questionnaire. The respondents were randomly chosen in Negeri Sembilan, Selangor and Kuala Lumpur.The result has shown that the religious satisfactory has a positive relationship with the other independent variables namely material, design, and product complementary and adhere to airline standard.
Keywords— Easy Solah Kit, Religious Satisfactory, Affect, Compatibility to Sunnah Practices
I. INTRODUCTION
HE five daily prayers are compulsory for Muslims. However, they are permitted to merge and shorten the prayers while traveling according to the length of the journey and other Islamic legal rules and requirements. The previous research has shown that 46.7% of Muslim travelers especially women were facing a bad experience and felt disappointed with the condition of praying clothes provided in public mussola (Alia et al, 2016). The condition of the said praying clothes was prone to bad smell and mold at certain area. Responding to this issue, the study is strategically to study on the effect of product features of solah kit in creating religious satisfaction and its compatibility of Sunnah practice. Thus,
understanding customer needs and wants toward solah kit are critically important in providing competitive advantage and unlock the uniqueness of the product as compared to its competitors
Moreover, with the total population of 1.6 billions of Muslims around the world and the numbers will be increasing to 2.2 billions in year 2030 (PewResearch Center, 2010) and Islam is the second largest of religion in the world, we are strongly believed that the “Easy-Solah Kit” has a great potential to be commercialize in the market. Thus, there is a room for promoting tourist destinations to tailor products and services that satisfy Muslim travelers that may increase the number of inbound travelers and will improve economic growth of one countries.
.
II. LITERATURE REVIEW
2.1 Tourism and Islam
Numerous studies have been examined the relationship between tourism and destination in marketing research that explained why people travel and select on specific destination. The literature highlighted that travellers chose their destination due to pull and push motivations (Jamrozy and Uysal, 1994; Hanqin and Lam, 1999; Jang and Cai, 2002; Bogari et al., 2004; Yoon and Uysal, 2005; Jang and Wu, 2006; Kim et al., 2006; Correia et al., 2007). The theory explained that travellers are pushed by their intrinsic desires or emotional factors to travel as well as pulled by external factors in form of the attributes of various destinations.
One of the important factors in the decision-making process in selecting travel destinations is religion (Collins and Tisdell, 2002). This is to ensure that the Islamic religious
P
2
Proceeding: International Social Sciences Academic Conference (ISSAC 2017) 23-24 August 2017 Jakarta, Indonesia
attributes, namely, availability of halal food, religion-friendliness hotel and prayer room, are available in those destinations. As such, Muslim travelers are adhere to follow Islamic teachings which will directly as well as indirectly influence on their decisions toward travel and leisure plans (Zamani-Farahani and Henderson, 2010).
There are two types of Muslim traveler’s activities. First and foremost, the pilgrimage-tourism activities that known as performing Hajj.The second type of Muslim tourism activities is encouraged the Muslim travelers to get in touch with tourism activities, namely, historical, social and cultural activities in order to gain knowledge, to associate with others, to spread Islam and to enjoy and appreciate of Allah’s creations (Timothy & Olsen, 2006).
2.2 Product Features, Material and design
A product is actually anything that can be offered to customers for attention, use, consumption that might satisfy a want or need (Kotler and Armstrong, 2015). It comes with core customer value and the core benefit to be offered to an actual product such as features, design, a quality level, packaging as well as brand name.
The strength of a product to be successful in the market is by getting the ideas from customer perspective. The ideas to produce product features or attributes should come from customer needs and wants. Each customer has different needs and preferences toward product features. The previous research mentioned that the designing products were based on customer requirement by considering multiple features (Green and Kriger, 1985; Kano et al, 1984; Nagamachi; 2002; Sullivan, 1986).
The quality of the product is associated with product features, function, specification as well as performance (Crosby, 1979). The quality of the product refers to the physical description or technical aspect of the product (Kambhu, 1982). It also refers to the attributes of a product namely the amount of the secondly important attributes of a product as per compared to the most important attribute (White, 1972).
Design is one of the elements of a product. Enterprise will use product design strategy as guidance in developing new product development (Crawford, 1994). The product design strategy also act as an innovation resources in accomplish the goals of an organization (Olson, 1994). The three basic strategies under design strategy goals are cost oriented design, image oriented design as well as focus oriented design (Porter, 1980).
2.3 Product Complementary, Sunnah and Airline Standard
Product line comes with wide assortments of brand models, colors, styles in order to create an infinite numbers of customized choices that give a sense of differentiation toward the product (Martin, 1998). The travelers are allowed to bring a quart-size bag of liquids, gels, aerosols, pastes and creams in carry-on bag through the checkpoint. The items are limited to
travel-sized containers which are equivalent to 100 ml or 3.4 ounces or less per item. The maximum measurement on carry-on bag are 9 inches x 14 inches x 22 inches (22 cm x 35 cm x 56 cm), including handles and wheels (Transportation Security Administration, 2016).
III. RESEARCHMETHODOLOGY
3.1 Research Design
A study has been conducted through a distribution of questionnaire to a 40 respondents that randomly chosen which has been believed as a Muslim travelers. A question on how Easy-Solah Kit shall meet their religious satisfactory has been asked which looking at the effect of material, airline standard, design, complementary as well as compatibility to Sunnah practices. An SPSS analysis has been done and looking at frequencies as well as descriptive analysis with an objective to look at a relationship of variables and which element been the most affect requirement adhere by the respondent when looking for “Easy-Solah Kit”. This is done due to ensure that the product is meeting a market demand so that the product can be commercialized in future.
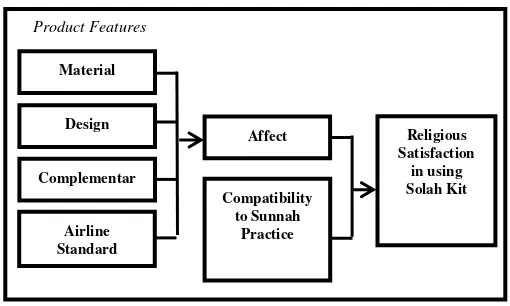
3.2 Theoretical Framework
Fig 1: Proposed Framework
Based on the theoretical framework, the study suggested to find a relationship of religious satisfactory of using Solah-Kit by looking at the independent variables of affect and compatibility analysis. Refer to past study, affect has been divided to a few variables which are; material, design, complementary and airline standard.
IV. FINDINGS
Below results explained on the demographic studies of the respondent as well as descriptive studies of the variable, the reliability of the data and the relationship between variables. Thus, the study finds out what is expected by the respondent which will be an indicator for a future production of Solah kit to meet market demand for a commercialization purpose.
4.1 Frequencies
Frequencies analysis from a table 1 (Appendices) on the
Material
Design
Complementar y Airline Standard Product Features
Affect
Compatibility to Sunnah
Practice
Religious Satisfaction
P
3
Proceeding: International Social Sciences Academic Conference (ISSAC 2017) 23-24 August 2017 Jakarta, Indonesia
demographic study shows that most of the respondent is come from the age of less than 30 years old and the rest is come from the age of 30 to 49 years old. While most of them go travel with family with a frequency of at least yearly of travelling and all of them are user of public mussollah.
4.2 Descriptive
Refer to the table 2 in appendices of descriptive analysis, a study shows the mean, mode, median or standard deviation of the variables. The study is now looking on the value which explain what is the most contributing factor that be considered in chosen SOLAH-KIT as their preferences. From the table below, the study found out that most of the respondents were strongly agreed that the SOLAH-KIT is meeting their religious satisfactory with the maximum value of 5. Furthermore, looking at the affect of the SOLAH-KIT specification considered by the respondent which meet their religious satisfaction, the result conclude the element chosen by respondent for each of the variable which are:-
[1]Material - Most of the respondent strongly agreed if the material of SOLAH-KIT is made for water-proof
[2]Airline Standard - Most of the respondent strongly agreed that SOLAH-KIT should meet airline standard of light-in-weight
[3]Design - Most of the respondent strongly agreed that the design of SOLAH-KIT should come with a few patterns. [4]Complementary - Most of the respondent is looking for a
complementary of the items in the list which has been indicated accordingly from the most to least based on the mean value which are: - Torch Light, Telekung, Compass, Water for Ablution, Purified Sand for Tayammum, Siwak Stick, Manual for Jama’ and Qasar Prayer, Panty Liner, Tasbih, Minyak Attar and Floss.
[5]Compatibility of Sunnah - Most of the respondent strongly agreed that SOLAH-KIT should fir their Qiblah identification as well as for ablution purposes.
4.3 Reliability
Reliability analysis is established by testing for both consistency and stability. Consistency indicates how well the items measuring a concept hang together as a set. Thus the study shows a result of Cronbach alpha which indicate how well the items in a set are positively correlated to one another. Below graph shows the value of Cronbach alpha for each of the set variables.
Because all the variables were measured with multi-item scales, the consistency of the respondent’s answers to the scale items has to be tested for each measure. The table provides an
overview of Cronbach’s alpha for the six variables. This table shows that the alphas were all well above 0.70 except for the material.
In general, reliabilities on the range of 0.70 is acceptable while those over 0.80 (compatibility of Sunnah and religious satisfaction) is considered good. Thus the internal consistency reliability of the measures used in this study can be considered to be acceptable for all the variables except the material which indicate below 0.60 value of alpha and need to delete some item to increase the alpha value. A summary of the figures can be seen on table 3 at appendices.
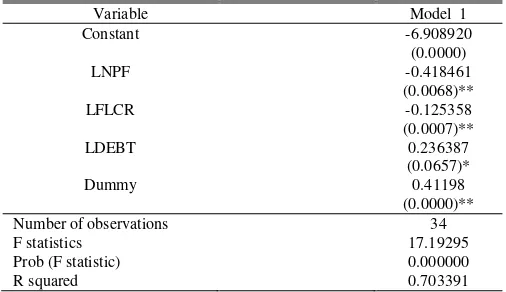
4.4 Regression
In regression study, the coefficient of determination (R Square), provides an information about the goodness of fit of the regression model as R2 is the % of variance in the dependent variable that is explained by the variation in the independent variable. The table below shows the study found that the R2 is 0.705 which accepted to near to 1 so that it explained that the regression model fits the data well. Means, almost 71% of the variance in religious satisfaction to the affect of SOLAH KIT.
4.5 Correlations
In correlation analysis (table 5 in appendices), the study found that the religious satisfactory (DV) has a positive relationship with the other Independent Variables (Material, Airline Standard, Design, Complementary and Sunnah). This is explained SOLAH –KIT should consider an independent variables identified since the findings shows that in order to satisfy the religious issues in SOLAH-KIT, it should consider the item of material, airline standard, design, complementary and compatibility of Sunnah practices.
V.CONCLUSION
P
4
Proceeding: International Social Sciences Academic Conference (ISSAC 2017) 23-24 August 2017 Jakarta, Indonesia
REFERENCES
Alia Nadira Rosle, Aini Hayati Musa, Farrah Nadia Baharuddin, Tengku Sharifeleani Ratul Maknu, Siti Sara Ibrahim (2016). Easy Solah Kit: When Innovation Lead Commercialization, Growing Creative and Innovative Solutions, Series 1, MNNF Publisher.
Bogari NB, Crowther G, Marr N. 2004. Moti-vation for domestic tourism: a case study of the Kingdom of Saudi Arabia. Tourism Analysis 8(2): 137– 141.
Collins D, Tisdell C. 2002. Gender and differences in travel life cycles. Journal of Travel Research 41(2): 133–143.. Duke, C.R. (1994)
‘Understanding customer abilities in product concept tests’, Journal of Product & Brand Management, 3(1), pp. 48–57. doi: 10.1108/10610429410053086.
Green, P.E. and Krieger, A.M. ( 1985 ), " Models and heuristics for product line selection ",Marketing Science , Vol. 4 No. 1, pp. 1 - 19 .
Hanqin ZQ, Lam T. 1999. An analysis of Mainland Chinese visitors' motivations to visit Hong Kong. Tourism Management 20(5): 587–594. Jamrozy U, Uysal M. 1994. Travel motivation variations of overseas
German visitors. Journal of International Consumer Marketing 6(3, 4): 135–160.
Jang S, Cai LA. 2002. Travel motivations and destination choice: a study of British outbound market. Journal of Travel & Tourism Marketing 13(3): 111–133.
Jang S, Wu C-ME. 2006. Seniors' travel motivation and the influential factors: an examination of Taiwanese seniors. Tourism Management
27(2): 306–316. Kambhu, J. (1982, “Optimal product quality under
asymmetric information and moral hazard, ” The Bell Journal of
Economics, Vol. 13, pp. 483‐92.
Kano, N., Seraku, N., Takahash, F. and Tsuji, S. ( 1984 ), " Attractive quality and must be quality ",Journal of the Society for Quality Control , Vol. 14 No. 2, pp. 39 - 48 .
Kim K, Giri J, Jeonghee N. 2006. Travel decisions of students at a US university: segmenting the international market. Journal of Vacation Marketing 12(4): 345–357.
Nagamachi, M. ( 2002 ), " Kansei engineering as a powerful consumer-oriented technology for product development ",Applied Ergonomics , Vol. 33, pp. 289 – 294.
Olson, E.M. (1994), "Interdependence, conflict, and conflict resolution: design's relationships with R&D, marketing, and manufacturing", Design Management Journal, Fall, pp. 60-6.
Sullivan, L. ( 1986 ), " Quality function deployment ",Quality Progress ,
Vol. 19 No. 6, pp. 39 -50. White, L.J. (1972, “Quality variation when
prices are regulated, ” The Bell Journal of Economics, Vol. 3, Autumn, pp. 425‐36.
Yoon Y, Uysal M. 2005. An examination of the effects of motivation and satisfaction on destination loyalty: a structural model. Tourism Management 26(1): 45–56.
P
5
Proceeding: International Social Sciences Academic Conference (ISSAC 2017) 23-24 August 2017 Jakarta, Indonesia
Cultivating Islamic Marketing Approach
–
Customer
’s
Buying Decision towards Takaful
Services
Aini Hayati Musa
1, Siti Hajar Md Jani
1, Nabilah Abdul Shukur
1, Noor Hasvenda Abd Rahim
1,
Mumtaz Ahmad
1, Tengku Sharifeleani Ratul Maknu
2, Intan Syafinaz Mat Shafie
31Faculty of Business Management, Universiti Teknologi MARA, 72000, Malaysia 2Faculty of Business Management, Universiti Teknologi MARA, 71300, Malaysia 3Faculty of Business Management, Universiti Teknologi MARA, 42300, Malaysia
Abstract—Nowadays Takaful is very important for every people. The need to have adequate protection in the future as well as supporting the rapid growth of Islamic businesses in Malaysia. Takaful services are expected to provide changes in sustaining personal and family stability to meet the unpredictable changes of the world. The elimination of risk can improve the quality of life and at
the same time adapt with changes in society’s psychographic needs,
As such, this paper aims to investigate the awareness level which
influence customer’s buying decision in choosing Takaful services.
In addition, it will also explore the relationship between independent variables which is level of awareness. Using a questionnaire survey, a total of 86 questionnaires were collected back from the respondent in Selangor. The finding based on correlation analysis revealed that all the independent variables have a moderate relationship with dependent variables.
Keywords— Takaful, Level of Awareness, Willingness to pay, Buying decision
I. INTRODUCTION
HE rapid growing concept and approaches to Islamic marketing is gaining fast momentum within the industry. In due course, Malaysia is seen to be committed in developing takaful marketing initiatives as evidenced by the complete range of globally recognized halal services in takaful industry.
There are currently 1.8 billion of Muslims in the world, which makes 24.1% of the global population. In addition, the global halal industry is estimated to be worth around USD2.3 trillion (excluding Islamic finance). This number is believed to be growing at an estimated annual rate of 20% and furthermore, the industry is valued at about USD560 billion a year (Pew Research Center, 2015).
This numbers represent the new opportunities and enormous potential of global market interest both in Muslim
and non-Muslim countries. In due course, both academics and practitioners of marketing, sees the potential of “Halal” marketing concept as a new way to grab the market. Subsequently, government of a progressive Islamic country could also position “halal” as one of its economic competitive advantages to flourish on the global arena.
The halal marketing has now stretched well beyond the food sector as what it is traditionally known for, by moving up to other sectors such as service industry. This is the new platform recognized by many as the way forward to further widening the economic potentials for halal industry.
Marketing for takaful service deals greatly on the effort to match the business in accordance to Shariah law and at the same time, fulfilling both the interest of the customer and service provider. The idea of synchronizations between these aspects requires critical evaluations in understanding the perception of the current delivery of Islamic marketing approach.
In this paper, we will discuss the customer’s due weightage to which perception of customer in halal service concept that will reflects their current acceptance to Takaful service holistically.
Since the Takaful business started in 1984, the percentage of the people who live in Malaysia that pay for Takaful products is quite low compared with the conventional insurance. There were many activities have been done for instances the promotion of Takaful products via the sources of media but the growth still have slow pacing in achieving to growth compared with their conventional insurance competitor ( Naail & Norsham, 2014). Besides that, Swartz and Coetzer (2010) stated the lack of knowledge and awareness among the people is among the greatest challenges to development and growth of Takaful industry. These obviously seen, most of the
P
6
Proceeding: International Social Sciences Academic Conference (ISSAC 2017) 23-24 August 2017 Jakarta, Indonesia
people have difficulty to understanding specific terminologies of Takaful. For instances, they sometime do not familiar with the term of gharar (uncertainty) or maysir (gambling). This situation as mentioned by Sarwar, Aamir and Qureshi, Hamza Ahmad (2013), role of insurance agent is become an issue and can become as a barrier to health insurance enrolment or awareness. The people are interested to purchase health insurance but are not properly informed about its functions. The most common issue among agents was difficulty to approach insurance agents, inadequacy of knowledge on the part of insurance agents and unsatisfactory behaviour of insurance agents.
Health insurance is one of method to finance healthcare and indirectly will reduce the burden among the citizen to pay for the healthcare cost. Furthermore, according to Frost and Sullivan, (2012) the statistic shown that in Malaysia the total expenditure on healthcare sector is expected to grow with an increment forecasted from USD 2.25 billion on 2012 to USD 3.65 billion in 2018. This has shown that Malaysian will incur much higher expenses on healthcare later and the citizens will be responsible for this burden later.
In addition, there are a few factors regarding the barriers in subscription of health insurance which including formalities bottleneck, agent related problem, coverage issues, awareness and negative feedback, (Pooja Kansraa & Gaurav Pathania, 2012). Other than that, poor people didn’t subscribe due to their less income and saving. This group of people not afford to pay cost of medical bill and because of that financial risk occur influencing them unwilling to pay the health insurance, (Maumita Ghosh, 2013). As a result, many barriers influence the level of awareness and willingness to pay Takaful health insurance. Therefore, this study is mainly to investigate the level of Takaful insurance and its level of subscription by which integrating the influence of customers willingness and affordability.
This research was conducted at Hospital Sungai Buloh, Selangor which is known as public hospital that deliver healthcare services. To determine whether the public sector staff was acquired their own insurance or not, the researcher was conducted an informal interview with the Human Resource staff in order to gain an information. The researcher was being informed that this organization did not provide their staff with the medical cards. Since, they could acquire the healthcare services at the staff clinic that has been provided for all staff in this Hospital. Hence, the researcher can conclude this matter was becoming one of the factors that influencing their awareness about the importance of insurance.
The researcher also has been explained that basically most of the staff that subscribes policy will be exposed with insurance during an events that related (if the insurance provider invited) or CUEPACS day which they usually they invited the insurance provider that offering conventional plan to open booth together with CUEPACS. Thus, with this restriction and shortcoming of information and publicity for
Takaful Insurance to the staff has becoming factor of problems. The staffs were only being exposed more on the conventional insurance. So, the researcher we seeing the problem and interested to determine whether they are aware about the existing of Takaful Insurance in the industry.
II.LITERATUREREVIEW
2.1 Awareness on Takaful Product
Public awareness is important to increase the market size for Takaful Insurance in Malaysia (Hidayat S.E., 2014). The study of The Ownership of Takaful Insurance in Malaysia which has found that 86.2 percent the respondents from the three government departments that were selected in Kuala Lumpur and Putrajaya area are aware about the Takaful Insurance (Hamid M.A., Husni S., Palil M.R., 2013). As cited by Ayuba and Mayuki, (2015), it stated that awareness of Takaful insurance is needed in Muslim group since they still could not differentiate between the Takaful Insurance and Conventional Insurance. Therefore this matter has becoming the factor that will influence the consumer to buy the Takaful insurance which mean the Muslim should have an awareness which is knowledge regarding the Takaful Insurance. In Malaysian market, Takaful Insurance are having high potential market that still not being explore to the fullest by the Muslim community, as being stated by National Bank Malaysia the penetration rate for Takaful Insurance on September 2010 was 10.9% only. (Hamid M.A. ,Husni S. ,Palil M.R.,2013). This is shown that market condition of Takaful Insurance could give an impact towards the Muslim awareness regarding the Takaful Insurance.
2.2 Unawareness on the Takaful Insurance
According to Kamil N.M and Mat Nor N. (2014), the factor influence based on independent variables such as knowledge of religiosity, perception, product features, promotion to customers, product benefits, quality of services provided by Takaful operators. Nevertheless, the level of awareness of halal, exposure and knowledge regarding Takaful insurance among Muslim also the factors influence the subscription of Takaful insurance.
P
7
Proceeding: International Social Sciences Academic Conference (ISSAC 2017) 23-24 August 2017 Jakarta, Indonesia
towards insurance is essential in facilitating the success of insurance services.
According to Abduh et.al. (2012), measured the performance and efficiency levels of the insurance industry in Malaysia between the year 2008 to 2010, highlighting both the conventional insurance and Takaful. Employing ratio analysis and data envelopment analysis, the authors concluded that the insurance industry in Malaysia is more efficient than the Takaful industry even though the difference in the efficiency levels in both industries is quite small. Besides that, compared the conventional system of life insurance and the Takaful model, owing to several arguments raised by the scenario of life insurance policy practiced under the conventional system, it reported that both conventional and Islamic designs tend to have different models (Billah, 2002).
2.3 Willingness to Pay
Takaful is an insurance system which is based on Shariah compliance. Takaful holds a different concept from conventional insurance which is rejected by the Shariah due to elements of uncertainty (gharar), gambling (maysir) and interest (riba). However, subscribe Takaful health insurance is the importance decision and very highly recommended among Muslim people. It is supported by Ayinde (2012) reported that Malaysians are willing to adopt Takaful insurance services depending on significant factors including compatibility and awareness. Even though Takaful is generally related to Islamic, these insurance products have attracted for non-Muslim communities (Swartz and Coetzer, 2010). However, the interest shown by non-Muslims and the support of Muslims is insufficient to promote the knowledge and willingness of the people to attract them for pay Takaful insurance. The lack of knowledge and awareness are the greatest challenges to the development and growth of the Takaful insurance industry.
According to Razak et.al. (2013), have found the factors that influence Malaysians pay for Takaful insurance based on perception, product, features, promotion, benefit and service quality. Other than that, the researcher also states that service quality was the most significant factor on why they are willing to pay Takaful insurance. A similar study by Rahim and Amin (2011) researched on the relationship among attitude, subjective norm and amount of Takaful information on the Islamic insurance participation. The researchers concluded that all three factors of attitude, subjective norm and amount of Takaful information on the Islamic insurance participation were includes as the influential factor of willingness to pay
In term of agents also give impact on the people for pay Takaful insurance. According to Salleh et al. (2013) the understanding of the concept of Takaful insurance among Takaful agents must be strengthening in order to become as influential factor of willingness to pay Takaful insurance. This is because when agents have fully knowledge and understand on the concept Takaful insurance, it will help to convince the people for attract to pay Takaful insurance. The agents of Takaful played important roles in promotion of the benefits of Takaful. The people knew the benefits of Takaful through
consultation given by Takaful agents who influence them to buy Takaful products.
Furthermore, in a separate study, Abdul-Hamid and Othman (2009) also investigate Takaful but from a Takaful literacy’s angle amongst 232 bank customers in Kuala Lumpur (the capital city of Malaysia). The study found that most of the respondents had difficulty in understanding the specific terminologies of Takaful. For example, only just 32 percent of the respondents are be familiar with the terms gharar (or uncertainty) and maysir (or gambling or speculating). The findings of this study are important to provide a direction to Takaful operators on how to develop their marketing plans because reasonably information is the basic element for influencing the people are willing to buy Takaful product.
The study by Kamil and Mat Nor (2014) found that most of the respondent had mentioned that Takaful and religion is very much close to each other. This is because Islam has this Makasid of Shari’ah. So, one of the objective in this Makasid is to protect peoples’ wealth. In that sense, the people who buying Takaful not only for herself or himself but also for their generations. An example is when buying a Takaful product, it’s covered whole of families if anything happen to you. In case of any emergency, if someone has to be hospitalized, she or he will be protected. The most important thing in Takaful is helping each other, is a mutual corporation or benefit.
III. RESEARCHMETHODOLOGY
3.1 Research Design
A study has been conducted through a distribution of questionnaire to a 86 respondents that randomly chosen among clinical staff in Hospital Sungai Buluh, Selangor. Sampling frame was acquired from the human resource department. Total population was 104 muslims that servicing as a support clinical department. From Krejie and Morgan, only 86 respondents were required to fulfill the study. A set of question on their level of takaful awareness and willingness to pay has been circulated. The SPSS analysis has been done and looking at descriptive and correlation analysis with an objective to look at their awareness level and the relationship with the variables when they are looking for Takaful.
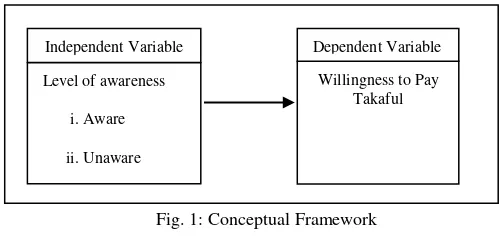
Fig. 1: Conceptual Framework
IV. FINDINGS
Below results explained on the demographic studies of the respondent as well as descriptive studies of the variable, the
Willingness to Pay Takaful Independent Variable Dependent Variable
Level of awareness
i.Aware
P
8
Proceeding: International Social Sciences Academic Conference (ISSAC 2017) 23-24 August 2017 Jakarta, Indonesia
reliability of the data and the relationship between variables.
4.1 Validity and Reliability analysis
The pilot test was conducted to determine the reliability of the items in the questionnaire. The analysis was made by distributed 20 questionnaires to the Muslim working people. The analysis result was show the value of Cronbach’s Alpha are achieved with .753. The dependent variable is reliable with the Cronbach’s Alpha value .818
4.2 Demography
From the above table 4.0 analysed data for demographic section has shown that the higher age for the respondents that answering this questionnaire are 18 – 25 years old with N = 29 , percentage = 33.7%. For the lowest rate of age are from the range 46 – 55 years old N = 7, percentage = 8.1%. The remaining number of respondent was 50 respondents are 26 – 45 years old. The gender analysis, there is 35 male respondents with 40.7 % and 51 respondents with 59.3 % are female respondents. For the marital status analysis 38 respondents are with single status, 47 respondents with married status and 1 respondent with divorced status. All of the respondents are working in the public sector. For the annual income analysis, the result has shown that most of the respondents are having RM 10 001 – RM 20 000 annual income with 55 respondents. The lowest income respondents are below than RM 10 000 annually with 2 respondents. The result of insurance policy holder are 48 respondents with 55.8% acquired an insurance policy and 38 respondents with 44.2 % are not acquired insurance policy.
4.3 Descriptive
Descriptive analysis was used to analyse the data of mean and standard deviation for each variables in this research. According to Sheridan (2013), the result of data analysis for descriptive analysis was helpful to generate overall results for the questionnaires. The study was conducted to find the relationship between Awareness and Willingness to Pay for Takaful Insurance. This study was conducted at Hospital Sungai Buloh which is the occupational sector was government sector. The result for mean and standard deviation for Independent variable was as table 4.2. As being stated in chapter 3, the researcher would like to determine the highest mean for the variables. From the table the highest mean score was (M = 4.12, SD = .676) which has shown most of the respondents are agree with the question number 1. However, for the lowest mean was (M = 3.44, SD = .876) which indicate that most of respondent was uncertain or unsure about the question number 3. For the overall mean and standard deviation for this dimension of section was (M = 3.7613, SD = .33439) that has shown most of respondent was feeling indifferent about their answers.
Table 4.3 show the result of mean and standard deviation for the Willingness to Pay for Takaful Insurance. There is 14 items in this section C. the highest mean score was (M = 4.03, SD = .694) which most of the respondents are agree with this question number 3. The lowest mean was (M = 3.35, SD =
.967) which most of respondent was unsure about the possibility of answer for this question 12. Overall mean for this section was (M = 3.7326, SD = .38068) which indicate that most of the respondent was uncertain about their answers.
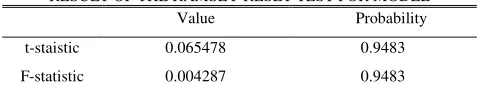
4.4Normality Test
The normality test were fone and there are skewness and kurtosis analysis, this analysis are considered as normaly distribute if the result are zero (Hair, Hult, Ringle, and Sarstedt, 2014). Skewness are being measure using scale +1 and -1 by Hair, Hult, Ringle, and Sarstedt, (2014) and +2 and – 2 are measure scale from Cameron, (2004).
4.4 Correlation
Correlation was being analysed between the Awareness and Willingness to Pay for Takaful Insurance among those respondents in order to find the relationship between these two variables. From the analysis, the result was .317(84) = 26.628, p= .003 it has shown that the pearson’s correlation was has low positive relationship between both of variables. The range between .30 to .50 was considered as low positive correlation (Sekaran and Bougie, 2009). The variables also were significant value was p = .003 for both variables which mean that the variables was have significant correlation and the independent variable are influencing the dependent variable. As that, the summary of correlational analysis result are .317 (84) = 26.628, p = .003. From this result, the r value were able to answering the hypothesis that has being as in the chapter 1 which is “There is a significant relationship between Takaful awareness towards the willingness of Muslim to buy the Takaful insurance.” The hypothesis is accepted with the result of r = .317 that was low positively correlates. This result also was supported with research of Abdulsater.M., (2014) that has hypothesis acceptance with result moderately for the level of awareness on the Islamic Insurance.
V.CONCLUSION
Through this research, the first objective was achieved and the level of awareness regarding the Takaful Insurance was in the moderate level which has been analyzed using the pearson’s correlation. However, the second objective is not achieved in this research since there are no variables that can measure the influence of awareness on Takaful Insurance.
Through this research the researcher has two suggestions to increase the awareness of the staff on the Takaful Insurance. To increase their awareness on the Takaful Insurance the researcher were suggested the strong campaign should be made at Hospital Sungai Buloh to make the staff aware about the Takaful Insurance. The campaign and suitable strategies will influence the consumer awareness on Takaful Insurance (Maiyaki and Ayuba, 2015). The staff should being exposed with the differences of Takaful and Conventional Insurance. Hence they could differentiate and make a better decision in buying the policy for their self.
P
9
Proceeding: International Social Sciences Academic Conference (ISSAC 2017) 23-24 August 2017 Jakarta, Indonesia
takaful insurer itself should cooperate together in order to make the people aware about the Takaful Insurance (Hamid, Husni and Palil, 2013). By joining together to make awareness
it could give a positive impact and will able to increase their awareness on the Takaful Insurance.
REFERENCES
Abdullah, A.N. (2007), Perception and Awareness Among Food Manufactures, Universiti Putra Malaysia Press, Kuala Lumpur.
Adas, A.B. (2006), “The making of entrepreneurial Islam and the Islamic spirit of capitalism”, Journal for Cultural Research, Vol. 10 No. 2, pp.
129
Bergeaud-Blackler, F. (2006), “Social definitions of halal quality: the case of Maghrebi Muslims in France”, in Harvey, M., McMeekin, A. and Warde, A. (Eds), Qualities of Food Alternative Theories and Empirical Approaches, Manchester University Press, Manchester, pp. 94-107. Golnaz, R., Zainulabidin, M., Mad Nasir, S. and Eddie Chiew, F.C. (2010),
“Non-Muslim perception awareness of halal principle and related food
products in Malaysia”, International Food Research Journal, Vol. 17, pp.
667-674.
Jonathan A.J. Wilson, (2012) "The new wave of transformational Islamic marketing: Reflections and definitions", Journal of Islamic Marketing, Vol. 3 Issue: 1, pp.5-11
Parasuraman, A., Zeithaml, V. and Berry, L.L. (1985), “A conceptual model of service quality and its implications for future research”, Journal of
Marketing, Vol. 49, pp. 120-36.
Parasuraman, A., Zeithaml, V. and Berry, L.L. (1988), “SERVQUAL: a multiple-item scale for measuring consumer perceptions of service
quality”, Journal of Retailing, Vol. 64 No. 1, pp. 12-40.
Selamat 1, Z. and Abdul-Kadir, H. (2012), “Attitude and patronage factors of bank customers in Malaysia: Muslim and Non-Muslim views”, Journal of Islamic Economics, Banking and Finance, Vol. 8 No. 4, pp. 87-100. Sula, M.S. and Kartajaya, H. (2006), Shariah Marketing, Mizan, Bandung.
Tahir, I.M. and Abu Bakar, N.M. (2009), “Islamic banking operations:
preparing the fit for internationalization”, Journal of Islamic Economics,
Banking and Finance, Vol. 5 No. 3, pp. 49-62.
Wilson, J.A.J. (2012), “The new wave of transformational Islamic marketing: reflections and definitions”, Journal of Islamic Marketing, Vol. 3, No. 1, pp. 5-11.
Zullig, K.J., Ward, M.R. and Horn, T. (2006), “The association between
P
10
Proceeding: International Social Sciences Academic Conference (ISSAC 2017) 23-24 August 2017 Jakarta, Indonesia
Assessing the Relationship between Favouritism and
Job Performance in Family-Owned Business
Syaimaa Amira Mohamad Yusof and Fadilah Puteh
Faculty of Administrative Science and Policy Studies University Teknologi MARA, Selangor, MALAYSIA
Abstract—Favouritism has strong connotation with family-owned businesses. This study aims to investigate the relationship between components of favouritism and employee job performance in family-owned business. Data was gathered through questionnaire involving 350 employees. The findings revealed that the level of employee job performance with the existence of favouritism on gender and social ties was at moderate level. Findings obtained also indicated that there was a negative relationship between favouritism on gender and social ties with job performance.
Keywords— Favouritism, Job Performance, Family-owned Business, Gender, Social Ties
I. INTRODUCTION
s a social interface mechanism, the practise of favouritism is broadly current especially in political and social world and can be seen as natural phenomenon that occurs universally (Ozler & Buyukarslan, 2011). The conventional of the scholars concluded that the tendency of the favouritism is consider higher in the large companies compared to small companies (Araslı and Tümer, 2008). According to Ponzo and Scoppa (2011), favouritism claimed as a common thing happen in teams, and it helps to minimize or remove the cost of an organization on searching for a new employee. Besides, favouritism depicts that a candidate is given a special treatment based on the several elements or factors that indirectly relay to a person’s ability in performing a job. It can be based on the family connections, philosophy of personal beliefs on gender or even social ties and background (Woods, 2011). A study by Brandts and Sola (2010) found out that employers favour employees they personally know and having relationship with and these employees favour the employer in their decisions. Commonly, favouritism promotes bias and discrimination to some groups of people especially the minority group (Woods, 2011).
Furthermore there is a high incidence of favouritism in family-owned business, according to Ponzo et al., (2010), the authors stated that favouritism on social ties can be considered as a common practices in the family-owned business. It was found that family businesses are typically smaller and that this
could be the main reason for why nepotism is more frequent used in the businesses rather than non-family businesses (Gustafsson & Norgen, 2014). Besides, in the Chinese family-owned business, they also favoured men more than female because the male successor will carry on the family name (Amran & Ahmad, 2010).
According to Kapadia (2013), there are about 80% of employees have reported that their respect for their supervisor are reduced due to favouritism as well as reduce in their work performance. More than 70% employees posit that favouritism make the relationship between colleagues become strained and promote hatred towards the recipients of favouritism. It also said that favouritism can harm the overall performance of the employees (Kapadia, 2013). Thus, the aim of study is to investigate the relationship between favouritism on gender and favouritism on social ties and its effect towards the job performance of employees working at family-owned business in Shah Alam.
II.LITERATUREREVIEW
Overview Family-owned Business
The family-owned business in Malaysia had proven strong because more than half of these people recorded growth in the business sales (PwC Group, 2016). Although there are many challenges faced by the family business including the concerns of external factors surrounding like government regulations, market conditions, exchange rates and also internal factors particularly staff recruitment, family business now more focus on strengthening their professionalism by bringing professionals in the business to run the business and to prepare the next generation to be an effective owners. The PwC Group (2016) reported that, there are over 64% of Malaysian family businesses recorded growth in their sales and 66% anticipates stable growth over the next five years. Respectively, 60% and 58% staff recruitment seems to be the key challenge in family business and almost 46% which is half of them sees the need to maintain professionalise in the business.
P
11
Proceeding: International Social Sciences Academic Conference (ISSAC 2017) 23-24 August 2017 Jakarta, Indonesia
Favouritism
Favouritism is a natural incidence that exists universally (Ozler & Buyukarslan, 2011). Favouritism can be defined as a form of mistreatment but it can be distinguished from other practises of corruption such as bribery because it does not typically involve a direct give-and-take of favours in material manner. Besides, to compare the practice of favouritism to bribery, favouritism creates a hidden, deeper, indirect, and vague return of obligation by the doers (Loewe et al., 2008). Leaders who practice favouritism in the organization have no chance to build or create a culture of trust (Whipple, 2012). Favouritism also can be defined as those employees who compete with a privileged individual but their chances of being promoted or rewarded are low.
Favouritism on Gender
According to Wallen (2015), favouritism on gender can lead to gender bias, a form of prejudice and discrimination. The positional bias is part of the favouritism on gender because most of the organization would prefer women to fit in the secretary or receptionist position and this kind of gender bias is very rampant in most organization. Favouritism on gender occur depend on how strong the similarity it is among the gender of the candidates and the label of gender as requested of the new job. Therefore, very high concerns have raised regarding on women's opportunity to find employments by using informal network or social ties (Marsden & Gorman, 2001). Since 2012, women in Sweden age 15 to 74, contributed to 63 % women while 68% men has been employed (Naringsliv, 2012).
Favouritism on Social Ties
Besides, based on several results from various studies has revealed that one of the most important unconventional ways to find an employment are by using social networks and personal relations as the mechanism to get selected for employment (Behtoui 2008; Mouw 2003; Meliciani & Radicchia 2010; Pellizzari, 2010). According to Bramoullé and Goyal (2016), they came out with one constructed model where favouritism plays a role as the factor of trading favours such as agreements or employment between the members that have the same mutual interest. Those people who practice favouritism will benefit the people of their social group but eventually suffer burden by hiring less skilful employees that produce low productivity.
Job Performance
The early definition of job performance is by Motowidlo, Borman, & Schmidt (1997), they defined job performance as the behaviour of employees that produce value which carried out at course of set period of time. Besides, according to Bullock (2013), job performance can be refer as a property of behaviour or what people actually do at work. A study by Isaed (2016) found out that the predictor of favouritism resulted in negative and significant related to the criterion of job performance of employees. The study also shows that job performance is influenced by favouritism negatively. Besides,
another study by Bute (2011) stated that favouritism influences job performance negatively whereby the performance efficiency reveals growth of dissatisfaction among the employees. It is not just affect their performance but also reduce their satisfaction.
III. RESEARCHMETHODOLOGY
The research measures for this study to test its validity were adapted from past researchers namely Abdalla (1998) and Boman & Motowidlo (1993), and some of the items were construct by researcher based on the published literature. Besides, this study is a quantitative approach via questionnaires in order to address the problem. A total 350 questionnaires were distributed to several selected family-owned business in Shah Alam and researcher succeeded in getting all 350 returned questionnaires. The collection of questionnaires consist of several methods such as self-managed by sending questionnaires hard copies manually to the respondents and through online survey by email and social media.
IV. DATAANALYSIS
The early step of data analysis of this study discovered that there is no missing value, the total population (N=350) were analysed as following:
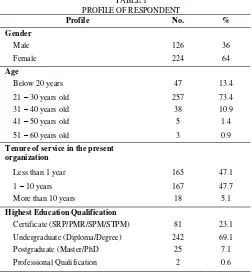
Respondent Profile
TABLE 1 PROFILE OF RESPONDENT
Profile No. %
Gender
Male 126 36
Female 224 64
Age
Below 20 years 47 13.4
21 – 30 years old 257 73.4
31 – 40 years old 38 10.9
41 – 50 years old 5 1.4
51 – 60 years old 3 0.9
Tenure of service in the present organization
Less than 1 year 165 47.1
1 – 10 years 167 47.7
More than 10 years 18 5.1
Highest Education Qualification
Certificate (SRP/PMR/SPM/STPM) 81 23.1 Undergraduate (Diploma/Degree) 242 69.1
Postgraduate (Master/PhD 25 7.1
Professional Qualification 2 0.6
P
12
Proceeding: International Social Sciences Academic Conference (ISSAC 2017) 23-24 August 2017 Jakarta, Indonesia
(64%) rather than men 64 respondents (36%) and mostly of the respondents are aged ranges from 21 to 30 years old. Besides, majority of the respondents (47.7%) are having up to 1 to 10 years tenure of service in the present organization and most of them are Diploma and Degree holder (69.1%).
In order to measure the sampling adequacy of the study, researcher used the Kaiser-Meyer-Olkin whereby the result obtained as shown in table 2 below, the KMO and Bartlett’s test present a significant result and it can be considered as a valid data because the KMO measure of sampling adequacy is >0.6 and the result from Bartlett’s test of Sphericity is significant at p<0.05 which represent the correlation matrix is different significantly from an identity matrix, where the correlations between these variables are all zero.
TABLE 2:
FACTOR ANALYSIS KMO AND BARTLETT’S TEST
KMO and Bartlett's Test
Kaiser-Meyer-Olkin Measure of Sampling Adequacy.
.854
Bartlett's Test of Sphericity Approx. Chi-Square 3311.211
df 465
Sig. .000
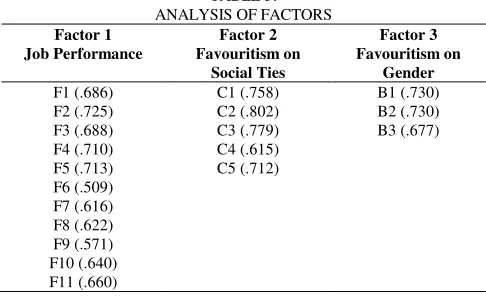
The Table 3 below present an analysis of factors that consist of three (3) cluster of factors. Firstly, job performance (factor 1), favouritism on social ties (factor 2) and favouritism on gender (factor 3).
Table 3:
TABLE 3: ANALYSIS OF FACTORS
Factor 1 Job Performance Factor 2 Favouritism on Social Ties Factor 3 Favouritism on Gender F1 (.686) F2 (.725) F3 (.688) F4 (.710) F5 (.713) F6 (.509) F7 (.616) F8 (.622) F9 (.571) F10 (.640) F11 (.660) C1 (.758) C2 (.802) C3 (.779) C4 (.615) C5 (.712) B1 (.730) B2 (.730) B3 (.677)
Besides, the reliability test of this research as shown in table 4 below, depict that favouritism on Gender (Good, 0.7), Favouritism on Social Ties (Excellent, 0.8) and Job Performance (Excellent, 0.87).
TABLE 4:
RELIABILITY RESULT OF ALL VARIABLES Variables Cronbach’s
Alpha
Num. of items
Reliability Measurement
Favouritism on Gender 0.704 3 Good Favouritism on Social
Ties
0.831 5 Excellent
Job Performance 0.872 11 Excellent
Based on Table 5 below, all variables are normally distributed since the values of Skewness and Kurtosis of this study are between the range of -2 and 2 and all values of Kurtosis are all range between -3 and 3. The value of Skewness and Kurtosis of all variables show that Favouritism on Gender (0.102, -0.163), Favouritism on Social Ties (-0.123, -0.154) and Job Performance (-0.274, -0.746). Thus, it can be claimed that all variables consider to be normally distributed (Sekaran, 2006).
TABLE 5:
NORMALITY TEST (SKEWNESS AND KURTOSIS)
Variables Skewness Value
Kurtosis Value
Normality Assumed
Favouritism on Gender 0.102 -0.163 Yes
Favouritism on Social Ties
-0.123 -0.154 Yes
Job Performance -0.274 -0.746 Yes
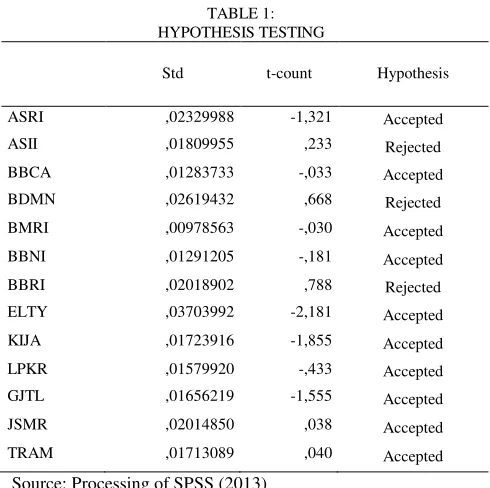
In order to examine the relationship between favouritism on gender, favouritism on social ties with job performance, based on the Table 6 below, the result shows that the correlations are having a negative moderate correlation to each other. Firstly, the correlation between favouritism on gender and job performance is (r = -0.220, p<.05) which resulted in negative moderate correlation where it can be assumed that the higher favouritism on gender in the workplace, the lower the job performance of employees in family-owned business. Secondly, the correlation between favouritism on social ties and job performance is (r = -0.320, p<.05) which assumed to have negative weak correlation meaning that the higher favouritism on social ties in workplace lead to slightly declining of job performance.
TABLE 6:
CORRELATION IVS AND DV
Furthermore, in this study, a multiple linear regression analysis was used in order to develop a model for predicting the effect of favouritism on gender and favouritism on social ties with job performance in the family-owned business organizations. As suggested by Cohen (1988) the R-squared values for variables are assessed according to 0.26 (substantial), 0.13 (moderate) and 0.02 (weak). The Table 7 below shows there are correlations between favouritism on gender, favouritism on social ties and job performance since p<0.05 where it can be assumed that the IVs are negatively correlated with DV.
Variable Sig (2-tailed) 1 2
1 Favouritism on Gender 0.000
2 Favouritism on Social Ties
0.000 0.300**
P
13
Proceeding: International Social Sciences Academic Conference (ISSAC 2017) 23-24 August 2017 Jakarta, Indonesia
TABLE 7:
CORRELATIONS REGRESSION
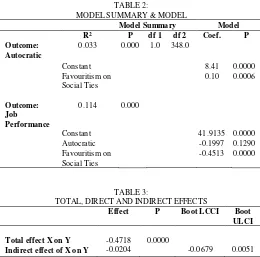
The Table 8 below present the result of coefficient of determination R-square= 0.119, which means 12% information about job performance is captured using this the model. As suggested by Cohen (1988), the level of R-squared of this model is considered as weak, in which indicate that, this study is very sensitive because affecting the respondents’ feelings and emotions, showing that people are not being open to share their true feelings in response to the study.
TABLE 8: MODEL SUMMARY
Model Summaryb
Model R R Square
Adjusted R Square
Std. Error of
the Estimate Durbin-Watson
1 .345a .119 .114 6.46535 1.467
a. Predictors: (Constant), FavSocial, FavGender b. Dependent Variable: JobPerformance
Based on the Table 9 below, both favouritism on gender and favouritism on social ties are statistically significant predict the job performance as p<0.05. Thus, this regression model can be assumed to be fit and significant from the data.
TABLE 9:
ANOVAa
Model
Sum of Squares df
Mean
Square F Sig. 1 Regression 16.236 2 8.118 23.499 .000b
Residual 119.875 347 .345
Total 136.111 349
a. Dependent Variable: JobPerf1
b. Predictors: (Constant), FavGen1, FavSoc1
TABLE 10: RESIDUALS STATISTICS
Based on the above Table 10, it can be assumed there is no multivariate outliers as refer to Mahal’s df = 2, Critical Value = 13.82 whereby the value of Critical Value is within the minimum and maximum value of Mahal Distance. Besides, the
result also present the Cook’s Distance is not exceed 1 meaning there is no outliers.
V.DISCUSSION
Based on the result obtained, it shows that favouritism on gender and job performance are moderately negative correlation to each other (r = -0.220, p<.05) which can be assumed that the higher favouritism on gender in the workplace, the lower the job performance of employees in family-owned business. According to Wallen (2015), Favouritism on gender can lead to gender bias, a form of prejudice and discrimination. It influences job performance negatively whereby the performance efficiency reveals growth of dissatisfaction among the employees. It is not just affect their performance but also reduce their satisfaction (Bute, 2011; Arasli & Tumer, 2008).
Secondly, the correlation between favouritism on social ties and job performance is (r = -0.320, p<.05) which assumed to have weak negative correlation meaning that the higher favouritism on social ties in workplace lead to slightly declining of job performance. According to Bramoullé and Goyal (2016), leaders who practice favouritism will benefit the people of their social group but suffer burden by hiring less capable people that produce low productivity. This support the result obtained due to less productive employees. Furthermore, finding of this study also concur with finding obtained in Breuer et al. (2010), Brandts & Sola (2010), Johansson (2012), Mahmood et. al. (2012), and Ponzo and Scoppa (2010).
The result of result coefficient of determination R-squared = 0.119, indicates that the finding captured only 12% information about job performance using this model. As suggested by Cohen (1988), the level of R-squared considered as weak, meaning that this study is very sensitive because affecting the respondents’ feelings and emotions, showing that people are not being open to share their true feelings to respond to the study.
Besides, based on the result attained, the IVs and DV are added statistically significant to the prediction of model as p<0.05 which assumed that these variables are significant to predict job performance. Based on the Beta values, favouritism on social ties (B= -0.279) having higher influence rather than favouritism on gender (B= -0.041) towards job performance. The negative correlation indicate that the increasing of favouritism on social ties and favouritism on gender lead to declining of job performance.
VI. LIMITATIONSOFSTUDY
As this study used a quantitative research design, the lack of probability sampling is an obvious limitation. This is because it prevents researcher to make generalisations about the overall population which means the result gained was not reliable to represent other area. Based on the data collected, a survey of 350 respondents has been conducted at central of Selangor state, in Shah Alam. The survey target group was employees working at family-owned business organizations. It Residuals Statisticsa
P
14
Proceeding: International Social Sciences Academic Conference (ISSAC 2017) 23-24 August 2017 Jakarta, Indonesia
particularly focus on the middle and lower management employees as the respondents to investigate their experienced of favouritism in their current organization.
Another limitation during data collection process was an additional time required by the organization to complete the questionnaire. Some of the organizations required almost two weeks to complete the questionnaire, but with limited of time, researcher have to distribute more than as planned to fulfil the numbers of sample for the data analyzation. Not just that, researcher also faced challenge whenever the organization took longer time to complete the questionnaire but return the questionnaire unanswered.
VII.CONCLUSIONANDSUGGESTIONFORFUTURE RESEARCH
As conclusion, the findings of study indicates that the level of favouritism on gender and favouritism on social ties respectively low and moderately influence the job performance of employees working at family-owned business organizations. The level of job performance of employees considered to be moderate which means even though favouritism on gender and social ties exist in the organization, they still can manage their work through continuously improvement and learning from their mistakes. As mentioned by Chen (2013), leader can gain benefit from playing favouritism through the competition among the employees, indicates that employee tend to be motivated to improve their work quality and productivity to stands out and be favoured by the leaders.
Regardless of the level of favouritism on gender and social ties influence the job performance, there is a negative correlation between favouritism on gender and social ties towards job performance. The negative relations show that one variable increase lead to declining of another variable. In this study, the increasing of favouritism on gender and social ties lead to declining of job performance of employees in family-owned business. As mentioned before by Wallen (2015), favouritism on gender lead to bias, a form of prejudice and discrimination. It influences job performance negatively and leaders who practice favouritism will benefit the people of their social group but suffer burden by hiring less capable people that produce low productivity (Bramoullé and Goyal, 2016).
As to response to the limitations of the study, suggestions for future scope is to expand the sample size and the area of study which is not only focus on Shah Alam area, but also should be conducted to other areas including the southern and northern regions of Selangor in order to gain more reliable and better result. Besides, the target group should be enlarge, the study should involve the employees working at Small-Medium Enterprises (SMEs) companies and invite other sectors to be part of the study. Item used in this study can also be apply to public sector, private sector, GLCs and multi-sectional organizations in order to gained high reliability and better result.
REFERENCES
Amran, N. A., & Ahmad, A. C. (2010). “Family Succession and Firm
Performance Among Malaysian Companies". International Journal of Business and Social Science.
Arasli, H., Bavik, A., & Ekiz, E. H. (2006). The Effects of Nepotism on Human Resource Management. International Journal of Sociology and Social Policy, 295-308.
Behtoui, A. (2008). Informal Recruitment Methods and Disadvantages of Immigrants In The Swedish Labour Market. Journal of Ethnic and Migration Studies, 411-430.
Bramoulle, Y., & Goyal, S. (2016). Favouritism. Journal of Development Economics, 16-27.
Brandts, J., & Sola, C. (2010). Personal Relations and Their Effect on Behavior in An rganizational Setting: An Experimental Study. Journal of Economic Behavior and Organizational Setting, 246-253.
Breuer, K., Nieken, P., & Sliwka, D. (2010). Social ties and subjective performance. IZA Discussion Paper.
Bute, M. (2011). The Effect of Nepotism and Favoritism on Employee Behaviors and Human Resources Practices: A Research on Turkish
Public Banks. . TODAĐE’s Review of Public Administration, 185-208. Bullock, R. (1 May, 2013). Scontrino Powell. Retrieved from Job
Performance (What It is, What It's Not): http://www.scontrino-powell.com/2013/job-performance-what-it-is-what-its-not/
Chen, Z. (2013). A Theory of Favouritism. 44.
Cohen, J. (1988). Statistical power analysis for the behavioral sciences. Field, A. P. (2009). Discovering Statistic Using SPSS. London, England:
SAGE.
Gustafsson, C., & Norgen, H. (2014). Nepotism perceived by managers. 58. Isaed, L. M. (2016). The Effect of Nepotism/ Favoritism on Flight Attendant's
Emotional Exhaustion and Job Performance: The Moderating Role of Psychological Capital. 111.
Johansson, A. (2012). Referral Hiring in A Recruitment Situation: The Importance of Favoritism, Fairness and Gender. Bachelor's Thesis in Psychology.
Kapadia, S. (24 December, 2013). Federal News Radio. Retrieved from Favoritism Strains Workplace Morale, Harms Agency Performance: http://federalnewsradio.com/management/2013/12/favoritism-strains-workplace-morale-harms-agency-performance/
Loewe, M., Blume, J., & Speer, J. (2008). How favouritism affects the business climate:empirical evidence from Jordan. Middle East Journa, 259-276.
Mahmood, Z., Muhammad, B., & Bashir, Z. (2012). Review of Classical Management Theories. International Journal of Social Sciences and Education, 11.
Marsden, V. P., & Gorman, H. E. (2001). Social networks, job changes, and recruitment. In Berg. I., & Kalleberg. A (Eds.), Sourcebook of labor markets: Evolving structures and processes, 267-502.
Motowidlo, S. J., Borman, W. C., & Schmit, M. J