131
ESTIMATION OF S WAVES ATTENUATION IN THE CENTRAL
NORTH ISLAND, NEW ZEALAND USING THE
NON-PARAMETRIC GENERALIZED INVERSE TECHNIQUE (GIT).
Syuhada
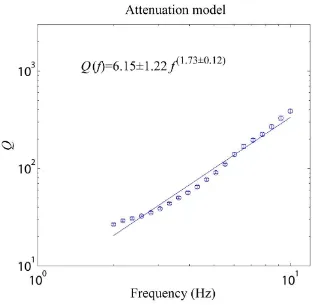
ABSTRACT We used regional earthquakes records (Ml = 2–3.8) with the distance range of 5–55 km in order to estimate the quality factor Q
of S-waves in the Central North Island, New Zealand. The non-parametric GIT method with bootstrap inversion was applied to separate the attenuation function from site and source effects. We obtained attenuation function for a set of 20 frequencies ranging between 2 and 10 Hz. The values of Q extracted from the attenuation functions provided values of strong frequency-dependent relation, Qs(f)= 6.15±1.22f
1.73±0.12
. The low Q with strong frequency dependence obtained is consistent to that obtained for other volcanic regions.
Key words: attenuation function, quality factor, volcanic regions, S-waves
ABSTRAK Kami menggunakan seismogram dari gempa lokal (Ml = 2–3.8) dengan jarak
hiposenter 5–55 km untuk memperkirakan faktor kualitas Q dari gelombang S di Central North Island, Selandia Baru. Metoda bootstrap inversi non-parametric GIT diterapkan untuk mendapatkan fungsi atenuasi pada 20 titik frekuensi yang terletak antara 2 sampai 10 Hz. Besaran Q yang dihitung dari fungsi atenuasi memberikan relasi Qs(f)=6.15±1.22f1.73±0.12.
Hasil ini konsisten dengan penelitian tentang atenuasi yang dilakukan untuk daerah gunung api lainnya.
Kata kunci: fungsi attenuasi, faktor kualitas, daerah vulkanik, gelombang S
Naskah masuk : 11 Oktober 2010 Naskah diterima : 14 Desember 2010
Syuhada
Research Center for Physics-P2F LIPI Kawasan Puspiptek Serpong
Email : [email protected]
INTRODUCTION
In the analysis of seismic waves, attenuation studies are of great interest. Seismic attenuation can be described as the amplitude decay of seismic waves with time and distance due to anelastic and elastic processes as the waves propagate through the Earth. Attenuation effects are usually expressed by the dimensionless quantity Q (quality factor). The two main mechanisms thought to be responsible for this amplitude variation are scattering and intrinsic attenuation. Intrinsic attenuation converts the seismic energy into heat, while scattering causes redirection of the energy of the wave (e.g. Stein and Wysession, 2003). In volcanic regions, both intrinsic and scattering attenuation are important but it is difficult to distinguish the mechanism of predominant attenuation (Arevalo et al., 2003).
Seismic attenuation measurements have been conducted on several volcanoes and gave significant contributions to both geological and geophysical studies in volcanic regions. For example, the seismic attenuation structure at Rabaul volcano, Papua New Guinea, has been studied using regional earthquake data and the spectral ratio method to estimate the quality factors of P and S waves (Gudmundsson et al., 2004). Gudmundsson et al. discovered that near-surface rocks inside the caldera are relatively more attenuative than those outside the caldera, with values ranging from 15–20 in the caldera indicating the influence of fractured rocks and the presence of geothermal fluids.
132
attenuation beneath this region using S wave attenuation.
Study Area
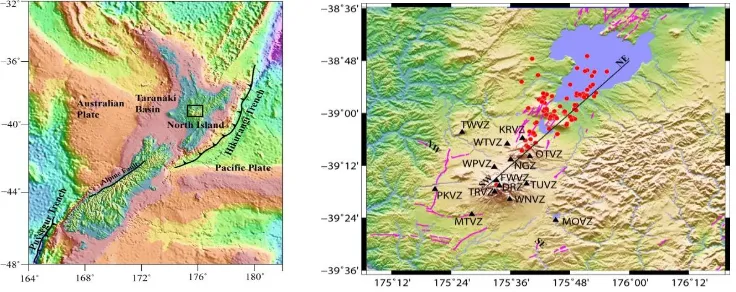
New Zealand is located at the boundary between the Pacific and the Australian Plates. To the southwest of New Zealand, the oceanic crust of the Australian Plate is subducting beneath continental crust of the Pacific Plate at the Puysegur Trench (Lamarche and Lebrun, 2000). Along the Hikurangi margin of the North Island, the thin dense Pacific Plate subducts obliquely beneath the thicker lighter continental crust of the Australian Plate with a relative convergence rate of 43 mm/year (Beavan et al., 2002) (Figure 1). These two subduction margins are connected by a northeast transpressional slip movement along the Alpine Fault, which crosses New Zealand (Sutherland et al., 2006).
Oblique subduction in the northern part of New Zealand results in a region of rapid extension with extremely active volcanism and high geothermal activity (Wilson et al., 1995). The
Central North Island is characterized by the young active volcanic and high heat flow region extending from Mt. Ruapehu to White Island (e.g. Wilson et al., 1995, Eberhart-Phillips and Reyners, 2009; Stern, 2009). The Central North Island is a region under active extension with an extension rate of up to 15 mm yr−1 at the Bay of Plenty, and decreasing to less than 5 mm yr−1 near the southern part of the region (Eberhart-Phillips and Reyners, 2009; Stern, 2009).
Recent attenuation tomography studies show a relatively low QP(< 150) beneath the central part of this region at depths of 50–85 km, suggesting that there is a strong connection between volcanism and low attenuation in the shallow mantle and crust (Eberhart-Phillips et al., 2008). Eberhart-Phillips et al. (2008) suggested that the strong relation observed between low attenuation of P-waves, low VP and high VP/VS is mainly governed by high temperature in this part of shallow crust related to partial melt in dikes and veins (e.g. Reyners et al., 2006).
133 Figure 2. The vertical cross section of the earthquakes shown on the Fig. 1.
METHOD
In this study, we analyzed waveforms obtained from 90 earthquakes with magnitude ranging from Ml=2–3.8. The hypocentral distances of the earthquakes vary between 5 and 55 km and mostly have source depth of 5–10 km. The earthquakes distribution and the stations used in this paper are shown in Fig.1 and Fig.2. The stations are equipped with short-period and broadband seismographs recording the vertical, the north–south, and the east–west components of seismograms. The seismograms used in the analysis are all sampled at 100 samples per second with the instrument responses flat between at 1–40 Hz and 0.08–40 Hz for the short-period and broadband seismometers, respectively. In this study, only events with magnitudes of Ml ≥2 with signal to noise ratio larger than 2 are retained for the inversion.
134
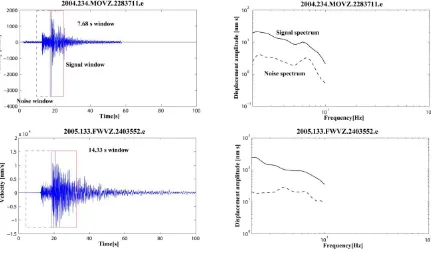
Figure 3. Left panel: Example records of the E–W component; signal and noise windows denoted by the red and blue dashed boxes respectively, used to compute the displacement spectra. Right panel: Examples of the smoothed displacement spectra obtained from the selected windows of the seismogram on the left panel.
We compute amplitude decay function with distance using the non-parametric generalized inversion (GIT) method (e.g. Castro et al., 1990). In this method, the frequency- and distance-dependence of the observed spectra are modeled as:
) ij R (f).A(f, i M ) ij R (f, ij
D (1)
Here Dij(f,Rij) is the observed spectrum of
earthquake j at station i, Mi(f) is a scalar, which depends on the size of the earthquake j
containing both source and the average site effects (Castro et al., 1990, 2008a,b), A(f,Rij)
is the attenuation function and Rij is the hypocentral distance of event j to site i. We discretize the hypocentral distance ranges into 2 km bin width.
By taking the logarithm, equation 1 can be made into a linear system of equations and expressed in matrix form, as follows:
0
0
b
m
a
W
G
G
a m(2)
a
G is a matrix representing the parameter s related to the attenuation function (
a
),whereas Gm is a matrix related to the model
space
m
containing source and site terms.b
is the data vector of observed spectra. W is amatrix containing weighting factors w1 chosen so
that a1 = 0 at R = 0 (reference distance) and w2 to
135 (see, e.g. Castro et al., 1990). The solution can
then be obtained using least square inversion (LSQ) or singular value decomposition. The accuracy and stability of the inversion results are assessed through 200 bootstrap sample inversion for each analyzed frequency using the same procedure as reported by, for example, Oth et al.
(2008).
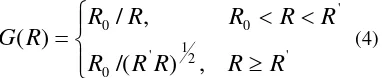
For attenuation function obtained using equation 2, the quality factor-frequency dependence can be calculated by fitting A(f,Rij) with the velocity model beneath the central of north island as obtained by Bannister et al. (2004). We define our geometrical spreading function following Castro et al. (2008b): flattening effect on the amplitude decay function of the secondary arrivals of reflected waves and a change in geometrical spreading function (Castro et al., 1996). Here,
R
is the hypocentral distance andR
' is the hypocentral distance at which the flattening effect on the amplitude decay function begins. In this study, we useR
'=25 km (Fig 4.).0
R
is the reference distance, here chosen to be0
R
= 5 km; we normalize our geometrical spreading function at this distance because mostrecords have hypocentral distances larger than 5 km. Then, Qs values are computed for each
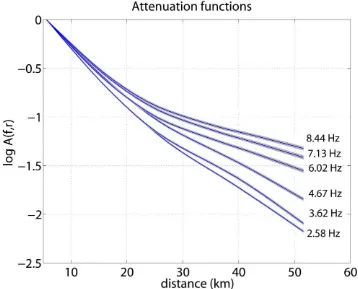
We performed the non-parametric GIT approach to obtain attenuation functions for the regional paths of S-waves in the Central North Island, New Zealand. Figure 4 shows regional attenuation functions obtained at different selected frequencies. At low frequencies (2.58 to 4.67 Hz), the functions decrease monotonically with hypocentral distance, but a flattening effect starts to appear at around 6.02 Hz, particularly for hypocentral distances greater than 25 km. The flattening effect becomes stronger with increasing frequency.
136
Figure 4. Spectral amplitude decay curves with distances obtained using the non- parametric GIT method at six selected frequencies. The solid line represents the mean of 200 bootstrap samples and the gray shaded area represents the mean ±2σ. The spectral amplitude decays faster at low frequencies than at high frequencies. The flattening effect also gets stronger with increasing frequency.
b.The Q model
We used the attenuation functions obtained for 20 frequencies to calculate Q using equation 3. In general, the low values of Q (Fig. 5) with high frequency-dependency coefficient obtained for S-waves beneath the Central North Island agree with those found in other volcanic regions. For
137 Figure 5. Estimates of Q models for S-waves obtained from seismograms in the Central North
Island. The error bars denote 2σ confidence interval.
The mechanism governing frequency-dependent seismic attenuation is still unclear, although its existence has been accepted for several decades (e.g. Aki, 1980a; Kinoshita, 1994). Aki and Chouet (1975) suggested that frequency-dependent attenuation of coda waves is due to variations in backscattering processes with depth causing strong changes in Q. The frequency dependence of Q also has an important role to play in geophysical interpretation in terms of its association with tectonic activity. Numerous studies show that low Q0 and high
arecharacteristic of active tectonic regions, while stable cratons are typically characterized by higher Q0 and lower
(Aki, 1980b; Castro etal., 2008b,c).
138
We consider strong frequency dependence (i.e.
>1 (Mayeda et al., 1992)) to indicate scattering and weaker frequency dependence with
=0.2 to 0.3 to be caused by intrinsic attenuation (Karato and Spetzler, 1990).However, this simple single layer model (using a whole hypocentral distance for Q estimation) does not distinguish the contributions of the partial melt. Therefore, further analysis is needed to determine the influence of the upper and lower crust on attenuation beneath the region.
CONCLUSION
The low values of QSexhibiting strong frequency dependence obtained within the Central North Island are comparable to those found in other volcanic regions. The frequency dependence of
QS beneath this region suggests that scattering may dominate over intrinsic attenuation, reflecting heterogeneities within the volcanic area. Further investigation is necessary in order to substantiate the contribution of the upper and lower crust beneath this region on attenuation.
ACKNOWLEDGMENTS
I would like to thank Prof. Martha Savage and Dr. John Townend for their thoughtful discussions which provided much-needed guidance throughout this study. Many thanks go to Dr. Raul Ramon Castro who explained to me the non-paramateric GIT method. Finally, thank you to the New Zealand GeoNet project and it sponsors EQC, GNS Science and FRST for providing me with data used in this study.
REFERENCES
Aki, K., 1980a. Attenuation of Shear Waves In The Lithosphere for Frequencies from 0.05 to 25 Hz. Phys Earth Planet In: 21.
Aki, K., 1980b. Scattering and Attenuation of Shear Waves in the lithosphere. J. Geophys. Res., 85:6496–6504.
Aki, K. and Chouet, B., 1975. Origin of Coda Waves: Source, Attenuation and Scattering Effects. J. Geophys. Res., Island Volcano(Antarctica). J. Volcanol. Geoth. Res., 128:89–113.
Bannister, S., Bryan, C. J., and Bibby, H. M., 2004. Shear Wave Velocity Variation Acrossthe Taupo Volcanic Zone, New Zealand, From Receiver Function Inversion. Geophys. J. Int., 159:291–310. Beavan, J., Tregoning, P., Bevis, M., Kato, T.,
and Maeertens, C., 2002. Motion and Rigidity of the Pacific Plate and Implications for Plate Boundary Deformation. J. Geoph. Res., 107:2261.
Castro, R. R., Anderson, J. G., and Singh, S. K., 1990. Site Response, Attenuation and Source Spectra of S Waves Along The Guerrero, Mexico, Subduction Zone. Bull. Seism.Soc. Am., 80:1481–1503.
Castro, R. R., Pacor, F., Sala, A., and Petrungaro, C., 1996. S Wave Attenuation And Site Effects in The Region of Friuli, Italy. Bull. Seism. Soc. Am., 101:22355–22369. Castro, R. R., Condori, C., Romero, O., Jacques, C., and Suter, M., 2008a. Seismic Attenuation in Northeastern Sonora, Mexico. Bull. Seism. Soc. Am., 98:722– 732.
Castro, R. R., Gallipoli, M. R., and Mucciarelli, M., 2008b. Crustal Q in southern Italy Determined from Regional Earthquakes. Tectonophysics, 457:96–101.
139 Eberhart-Phillips, D. and Reyners, M., 2009.
Three-dimensional Distribution of seismic anisotropy in the Hikurangi subduction zone beneath the central North Island, New Zealand. J. Geophys. Res., 114:B06301.
Eberhart-Phillips, D., Reyners, M., Chadwick, M., and Stuart, G., 2008. Three-dimensional Attenuation Structure of The Hikurangi Subduction Zone in The Central North Island, New Zealand. Geophys. J. Int., 174:418–434.
Giampiccolo, E., D’Amico, S., Patane, D., and
Gresta, S., 2007. Attenuation of Source Parameters of Shallow Microearthquakes at Mt. Etna Volcano, Italy. Bull. Seism. Soc. Am., 97:184–197.
Gudmundsson, O., Finlayson, D.M., Itikarai, I., Nishimura, Y., and Johnson,W. R., 2004. Seismic Attenuation at Rabaul Volcano, Papua New Guinea. J. Volcanol. Geoth. Res., 130:77–92.
Harrison, A. J. and White, R. S., 2004. Crustal Structure of The Taupo Volcanic Zone, New Zealand: Stretching and Igneous Intrusion. Geophys. Res. Lett., 31:L13615.
Karato, S. and Spetzler, H. A., 1990. Defect Microdynamics in Minerals and solid-state Mechanisms of Seismic Wave Attenuation and Velocity Dispersion in The Mantle. Reviews of Geophysics, 28:399–421.
Kinoshita, S., 1994. Frequency-dependent Attenuation of Shear Waves in The Crust of The Southern Kanto area, Japan. Bull. Seism. Soc. Am., 84:1387–1396.
Konno, K. and Omachi, T., 1998. Ground-motion Characteristics Estimated from Spectral Ratio Between Horizontal and Vertical Components of Microtremors. Bull. Seism. Soc. Am., 88:1228–1241.
Lamarche, G. and Lebrun, J. F., 2000. Transition from Strike-Slip Faulting to Oblique Subduction: Active Tectonics at The Puysegur Margin, South New Zealand. Tectonophysics, 316:67–89.
Mayeda, K., Koynagi, S., Hoshiba, M., Aki, K., and Zeng, Y., 1992. A Comparative Study of Scattering, Intrinsic and Coda q l for Hawaii, Long Valley, and Central California between 1.5 and 15 hz. J. Geoph. Res., 97:6643–6659.
Oth, A., Bindi, D., Parolai, S., and Wenzel, F., 2008. S-wave Attenuation Characteristics Beneath The Vrancea Region in Romania: New Insights from The Inversion of Ground Motion Spectra. Bull. Seism. Soc. Am., 98:2482–2497. Global Seafloor Topography from Satellite Altimetry and Ship Depth Soundings. Science, 277:195–196. Stern, T. A., 2009. Reconciling Short- and
Long-Term Measures Of Extension In Continental Back Arcs: Heat Flux, Crustal Structure and Rotations Within Central North Island, New Zealand. 321:73–87. Stein, S. and Wysession,M., 2003. An
Introduction to Seismology, Earthquakes and Earth Structure. Blackwell Publishing, Oxford.
140
Styles, K. E., 2009. Shear Wave Attenuation Structure and Anisotropy in the Hikurangi Subduction Zone, Central North Island, New Zealand. PhD thesis, School of Earth and Environment, The University of Leeds, England.
Sutherland, R., Berryman, K., and Norris, R., 2006. Quaternary Slip Rates and Geomorphology of the Alpine Fault: Implications for Kinematics and Seismic
Hazard in Southwest New Zealand. Geological Society of America Bulletin, 118:464–474.