See discussions, stats, and author profiles for this publication at: https://www.researchgate.net/publication/271212229
The Use of Carbon Dioxide Released from
Coconut Shell Combustion to Produce NaCO3
Article · March 2014 DOI: 10.7454/mss.v18i3.3717
CITATION
1
READS
303
4 authors:
Some of the authors of this publication are also working on these related projects:
COPYROLYSIS OF SUGARCANE BAGSSSE AND RUBBERSEED OIL FOR PRODUCTION OF LIQUID FUEL USING SYNTHETIC ZEOLITES PREPARED FROM RICE HUSK SILICAView project
Converting cellulose (nano) of waste agricultural productsView project Simon Sembiring
Lampung University
28 PUBLICATIONS 89 CITATIONS
SEE PROFILE
Wasinton Simanjuntak
Lampung University
34 PUBLICATIONS 94 CITATIONS
SEE PROFILE
Wan Abbas Zakaria
Lampung University
3 PUBLICATIONS 3 CITATIONS
SEE PROFILE
Kamisah Pandiangan
Lampung University
10 PUBLICATIONS 23 CITATIONS
SEE PROFILE
All content following this page was uploaded by Simon Sembiring on 23 January 2015.
The Use of Carbon Dioxide Released from Coconut Shell Combustion to
Produce Na
2CO
3Wasinton Simanjuntak
1, Simon Sembiring
2*, Wan Abbas Zakaria
3, and Kamisah D. Pandiangan
21. Department of Chemistry, Faculty of Mathematics and Natural Science, Universitas Lampung, Lampung 35145, Indonesia
2. Department of Physics, Faculty of Mathematics and Natural Sciences, Universitas Lampung, Lampung 35145, Indonesia
3. Department of Agrobusiness, Faculty of Agriculture, Universitas Lampung, Lampung 35145, Indonesia
*E-mail: [email protected]
Abstract
In this investigation, sodium carbonate (Na2CO3) was produced by reacting the CO2 released from coconut shell
combustion with NaOH solution with molar concentrations of 6.5, 7.0, 7.5, and 8.0 M. The main purpose of the study was to assess the potential of the proposed method for mitigation of the CO2 gas released into the atmosphere by the
coconut shell industry. The Na2CO3 powder produced was oven-dried at 110 oC and subsequently characterized using
FTIR, XRD, and SEM/EDS techniques. Thermal analysis was also carried out using DTA/TGA to investigate the thermal mechanisms of sodium carbonate formation. The experimental results show that the concentration of NaOH influences the mass of sodium carbonate produced, with the highest mass of 190.6 g obtained using 7.0 M NaOH solution. The FTIR analyses show the existence of O-H, C-O, C=O, and CO3-2, confirming the formation of Na2CO3.
The C-S functional group was also detected most likely due to the presence of the sulfur that naturally exists in the coconut shell. The formation of Na2CO3 is also supported by the presence of C, Na, and O on the EDS results and the
presence of the thermonatrite (Na2CO3.H2O) phase, as seen by the XRD. The XRD analysis of the sintered sample at
450 oC indicates the transformation of thermonatrite into sodium carbonate and sodium oxide, which is in accordance with the results of DTA/TGA analysis. Based on the results obtained, it is concluded that the proposed method can be applied to mitigation of CO2 gas released by the coconut shell industry.
Abstrak
Pemanfaatan Gas CO2 Hasil Pembakaran Tempurung Kelapa untuk Produksi Natrium Karbonat. Penelitian ini
dilakukan untuk mempelajari pemanfaatan gas CO2 hasil pembakaran tempurung kelapa menjadi natrium karbonat
(Na2CO3) dengan mereaksikan gas CO2 dengan larutan NaOH dengan konsentrasi 6.5, 7.0, 7.5 dan 8.0 M. Tujuan utama
penelitian adalah mengkaji potensi metode diusulkan sebagai cara mitigasi gas CO2 yang dihasilkan dari industri arang
tempurung kelapa. Padatan natrium karbonat yang dihasilkan selanjutnya dikeringkan dalam oven pada suhu 110 oC, lalu dikarakterisasi dengan FTIR, XRD, dan SEM/EDS. Analisis termal menggunakan metode DTA/TGA dilakukan untuk mempelajari karakteristik termal pembentukan Na2CO3. Hasil penelitian menunjukkan bahwa konsentrasi NaOH
mempengaruhi massa natrium karbonat yang dihasilkan, hasil tertinggi sebesar 190,6 g diperoleh dari penggunaan NaOH dengan konsentrasi 7,0 M. Karakterisasi dengan FTIR menunjukkan dengan jelas pembentukan natrium karbonat, yang ditandai dengan pita serapan gugus fungsi yang berkaitan dengan natrium karbonat, yakni gugus O-H, C-O, C=O, dan CO3-2. Hasil FTIR juga menunjukkan adanya gugus fungsi C-S, yang kemungkinan besar karena adanya
sulfur yang terdapat dalam tempurung kelapa secara alami. Pembentukan Na2CO3 juga didukung hasil karakterisasi
dengan EDS yang menunjukkan sampel terdiri dari unsur C, Na, dan O, dan deteksi fase termonatrit (Na2CO3.H2O )
dengan XRD. Karakterisasi sampel yang disintering pada suhu 450 oC dengan XRD menunjukkan perubahan termonatrit menjadi Na2CO3 dan Na2O, yang juga didukung oleh hasil karakterisasi dengan DTA/TGA. Berdasarkan
hasil yang diperoleh disimpulkan bahwa metode yang diusulkan pada penelitian ini berpotensi untuk diaplikasikan sebagai metode mitigasi gas CO2 yang dihasilkan oleh industri arang tempurung kelapa.
Simanjuntak, et al.
Makara J. Sci. September 2014 | Vol. 18 | No. 3
66
1.
Introduction
Currently, one of the most alarming global environ-mental problems is the increase of the greenhouse effect resulting from increased production of greenhouse gases. One of these is carbon dioxide (CO2) emission, which
has been predicted to continuously increase at a rate of more than 3.3% per year [1]. Atmospheric CO2 levels
can be largely attributed to the combustion of fossil fuels, cement production, the coconut shell charcoal industry, and land use changes. In Indonesia, the coconut shell charcoal industry is considered one of the main contributors to atmospheric CO2, since this type of
industry is mainly run by farmers using a traditional
Sodium carbonate/soda ash (Na2CO3) is one of the most
important raw materials used in vast arrays of chemical industries such as detergent, glass, soap, fertilizers, and pulp and paper industries. In large-scale industry, production of soda ash was carried out using Le Blanc and Solvay processes [2], although some other methods have been developed such as a carbonation process [3], sesquicarbonate process [4], and monohydrate process [5]. However, the Solvay process remains the most common production method. In the Solvay process, the main raw materials used are brine as a source of sodium chloride, limestone as a source of calcium carbonate, and ammonia. The process involves a series of steps and reactions as presented below.
solution of sodium chloride (NaCl) and ammonia (NH3)
to produce sodium bicarbonate (NaHCO3), according to
the following equation:
NaCl + CO2 + NH3 + H2O → NaHCO3(s) + NH4Cl (2)
The sodium bicarbonate (NaHCO3) precipitate from
Reaction (2) is then converted to sodium carbonate as the final product by calcinations at 160–230 oC, producing water and carbon dioxide as by-products: 2NaHCO3 → Na2CO3 + H2O + CO2 (3)
The carbon dioxide from Reaction 3 is recovered and reused in Reaction 2, and ammonium chloride from Reaction 2 is reacted with CaO produced from Reaction
1 to recover the ammonia for reuse, according the following chemical equation:
2NH4Cl + CaO → 2NH3 + CaCl2 + H2O (4)
Reaction between CO2 gas and NaOH solution, as in the
Solvay process, has been applied to absorb CO2 gas, a
method known as the wet scrubbing technique. This technique is defined as a method for removal of a gaseous component through contact with a liquid. In this technique, the sorbate is physically dissolved into the sorbent solution, and the reaction between them leads to production of a nongaseous product. Application of this method to CO2 gas has been reported
by several investigators [6-10]. It has also been concluded claimed that the production of Na2CO3 could
be managed by adjusting the NaOH concentration
combustion into NaOH solution, with the main purposes of investigating the effect of NaOH concentrations on coconut shell and NaOH pellets (Merck, kGaA, Damstadt, Germany) for preparation of the NaOH solution. The CO2 gas was produced from coconut shell by burning it
in a specially designed reactor of 20 L capacity, which allowed the gas to flow into the NaOH solution. Typically, 2 kg of dried coconut shell were placed into the reactor, and the shell was lit to commence combustion. Produced smoke was passed into a chamber filled with NaOH solution of concentrations of 6.5, 7.0, 7.5, and 8.0 M. Each experiment was conducted for two hours, during which the Na2CO3 was produced as precipitate.
The solid was soaked with ethanol to wash out organic impurities and was then subjected to calcination at 110
οC for six h and ground with a mortar and pestle to
obtain powder with the size of 250 mesh.
scanning electron microscopy (SEM) (Philips-XL) coupled with energy dispersive spectrometry (EDS). The x-ray diffraction pattern was recorded with an automated Shimadzu XD-610 X-ray diffractometer equipped with a scintillation counter. The conditions for XRD analysis are as follows: source CuK(λ = 1.5418Å),
40 kV and 30 mA. Patterns were recorded over goniometer (2) from 5–70º with a step size of 0.02º and counting time per step of 1 s. Thermal analysis was carried out using Differential Thermal Analysis (DTA/TGA Merk Seiko Instrument Inc.). The thermogram was produced by scanning the sample at a temperature range of 50 ºC to 1000 ºC.
3.
Results and Discussion
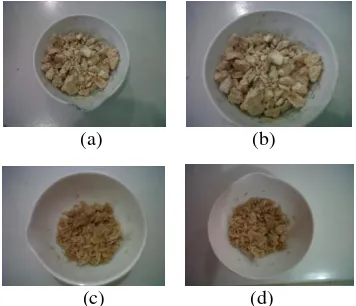
Typical visuals of raw Na2CO3 produced using different
concentrations of NaOH solution are presented in Figure 1. As can be seen, the Na2CO3 powder is marked
by a brownish color, indicating that the products are contaminated by some organics produced during the combustion process and trapped by the Na2CO3. For this
reason, the raw products were purified by washing with ethanol until the white solid was obtained. The purified samples were then oven-dried at 110 oC for eight hours to remove the absorbed water. The dried sample was then weighed to determine the yield, and the results are presented in Table 1. The typical results of purified
Figure 1. Visual Appearance of Na2CO3 Powder Produced at Different Concentrations of NaOH. (a) 6.5 M, significant effects of NaOH concentration on the amount of Na2CO3 produced, with the optimum yield
obtained using the 7.0 M NaOH solution. The experimental result using 6.5 M NaOH suggests that this solution is not concentrated enough to overcome the dissolution of formed Na2CO3 produced, due to its
relatively high solubility in water. On the other hand, less product was obtained using the NaOH solution of 7.5 and 8.0 M, most likely due to oversaturated NaOH that hindered the penetration of CO2 gas into solution.
To confirm that the products were Na2CO3, the samples
were characterized using several techniques.
Figure 3 present the infrared spectra of Na2CO3
produced at different concentrations of NaOH. As can be seen, the spectra are practically similar in terms of the absorption bands detected and are marked by the existence of various absorption bands associated with CO3-2, C-O, and C=O functional groups, confirming the
formation of Na2CO3 [12-14].
The absorption bands located at 866 and 1446 cm-1 are assigned to the stretching vibration of CO3-2. The
presence of this functional group is further supported by the detection of weak peaks located at 1069 and 1684/cm, attributed to deformed gaseous CO2 that attached to
NaCO3 solid [15] and C=O [12], respectively. The wide
Figure 2. Typical Examples of Sodium Carbonate Pellets after Calcined at 110 οC
Simanjuntak, et al.
Makara J. Sci. September 2014 | Vol. 18 | No. 3
68
peaks located at 2987 and 3273/cm are commonly assigned to the stretching vibrations of C-H and O-H. The presence of the O-H vibration shows the contribution of water [16-17]. The peaks at around 540 and 725/cm are assigned to the vibration band of C-S, probably originating from the combustion process and adsorbed by Na2CO3 [18].
The overall results obtained show that the highest yield was obtained using 7 M NaOH solution. This particular sample was subjected to sintering treatment at 450 C for further characterization. Characterization of the original sample and the sample after being sintered at 450 C using XRD produced the patterns of Na2CO3, as
presented in Figures 4 (a) and (b).
The phases were identified with the PDF diffraction lines using the search-match method [19], showing that the major phases are Na2CO3.H2O/thermonatrite
(PDF-080448), Na2CO3/sodium carbonate (PDF-18-1208), and
Na2O/sodium oxide (PDF-06-0500). The thermonatrite
phase confirms the formation of Na2CO3 as a result of
reaction of NaOH with CO2 produced from the
combustion process, while the sodium carbonate and sodium oxide phases most likely originated from thermonatrite crystallization during the thermal treatment. As can be seen, the sample without sintering (Figure 4a) is practically composed of thermonatrite. On the other hand, the sample sintered at a temperature of 450 C (Figure 4b) is marked by the existence of sodium carbonate as the prominent phase, together with a small amount of sodium oxide. This finding suggests that at the applied sintering temperature, thermonatrite decomposed to sodium carbonate, followed by decomposition of some of the sodium carbonate into sodium oxide, which is in agreement with observations by others [20, 21]. The mean crystallite sizes (L) of
Figure 4. The x-ray Diffraction Patterns of the Original Sample (a) and the Sintered Sample (b) T= Thermonatrite (Na2CO3.H2O), SC= Sodium Carbonate (Na2CO3), and SO= Sodium Oxide (Na2O)
Na2CO3 and Na2O were calculated from the high peaks
for each phase, using the Scherrer equation [22]: L = k/cos θ (6) Where k is the shape factor (0.94), is the x-ray wavelength, is the line broadening at full width at half
maximum (FWHM) in radians, and θ is the Bragg angle.
The corresponding crystallite sizes calculated from the Scherrer equation are 5 µm for Na2CO3 and 7 µm for
Na2O in the sample sintered at 450 C.
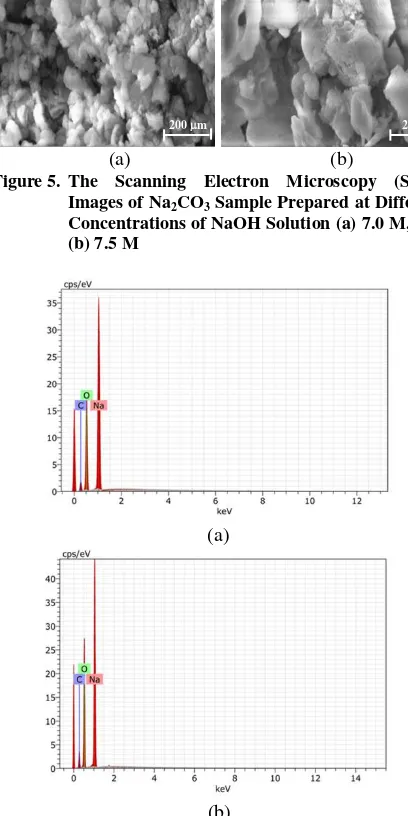
The scanning electron microscopy micrographs of the Na2CO3 samples are presented in Figure 5, and the
corresponding EDS spectra are presented in Figure 6.
(a) (b)
Figure 5. The Scanning Electron Microscopy (SEM) Images of Na2CO3 Sample Prepared at Different Concentrations of NaOH Solution (a) 7.0 M, and (b) 7.5 M
(a)
(b)
Figure 6. The EDS Spectra of Na2CO3 Prepared at Different Concentrations of NaOH (a) 7.0 M and (b) 7.5 M
The micrograph of the sample produced at 7.0 M of NaOH is characterized by larger grains compared to the sample produced using 7.5 M of NaOH (Figure 5). This difference is most likely due to a higher quantity of the Na2CO3 produced, which resulted in more intensive
aggregation. Despite this difference in the crystallinity of the samples, the EDS patterns of both samples are practically similar, marked by the presence of Na, C, and O (Figure 6), suggesting that the samples are of similar compounds. The percent weights of each element composition of the samples as seen by the EDS are compiled in Table 2. By comparing the percent weights of the elements in the Na2CO3 produced to
those in Na2CO3, according to the stoichiometric values
of Na (43.4%), C (11.3%), and O (45.3%), it can be seen that some difference should be acknowledged. This difference is most likely due to the formation of Na2O,
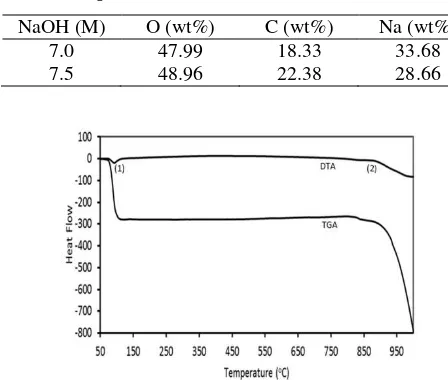
In this study, thermal characteristics of the sample were determined by analyzing with DTA/TGA. The DTA/TGA thermograms of the Na2CO3 sample
produced at 7.0 M NaOH solution are shown in Figure 7. The TGA result (Figure 7) indicates the existence of two temperature zones, indicating the pattern of weight loss of the sample. At a temperature range from 50 to
Figure 7. Analysis Thermal of Na2CO3
indicates very evident decomposition and crystallization of Na2CO3, which is shown by the existence of an
endothermic peak at 980 C (sign 2). This endothermic peak is associated with the transformation of Na2CO3
from coconut shell combustion with NaOH solution. The formation of Na2CO3 was confirmed by the results of
several characterization techniques applied, particularly FTIR, EDS, and XRD. This finding demonstrated that CO2 from coconut shell combustion could be used as a
potential alternative raw material for the production of sodium carbonate and a reduction of CO2 released into
the atmosphere.
Acknowledgements
The authors are grateful to the Directorate General of Higher Education, Republic of Indonesia, for research funding provided through Hibah Unggulan Universitas Lampung, Research Grant Program No: 010/SP2H/ DP2MIII/2013.
References
[1] J.G. Canadell, Proceedings of the National Academy of Sciences, 104 (2007) 18866.
[2] C. Thieme, Ullmann’s Encyclopedia of Industrial Chemistry, 24 (1993) 299.
[3] G.N. Saygili, Hydrometallurgy, 68 (2003) 43. [4] T. Eggeman, In: Kirk-Othmer Encyclopedia of
International Mineral Processing Symposium, Izmir, Turkey, 2 (1986) 647.
[7] J. Olsson, A. Jemqvist, G. Aly, Inter. Thermophys. 18 (1997) 779.
[8] K.S. Lackner, P. Grimes, H.J. Ziock, 24th Annual Technical Conference on Coal Utilization: Clearwater, FL. 1999.
[9] R. Baciocchi, G. Storti, M. Mazzotti, Chem. Eng. Proc. 45 (2006) 1047.
[10] F. Zeman, Environ. Sci. Tech. 41 (2007) 7558. [11] J.K. Storaloff, D.W. Keith, G.V. Lowry, Environ.
Sci. Tech. 42 (2008) 2728.
Simanjuntak, et al.
Makara J. Sci. September 2014 | Vol. 18 | No. 3
70
[13] M.J. Haris, E.K.H. Salje, Phys. Cond. Matt. 4 (1992) 4399.
[14] K. Chandran, M. Kamruddin, P.K. Ajikumar, A. Gopalan, V. Ganesan, Nuclear Mater. 374 (2007) 158.
[15] F. Adam, J.H. Chua, Coll. Interf. Sci. 280 (2004) 55.
[16] M. Kharaziha, M.H. Fathi, Ceram. Int. 34 (2009) 2449.
[17] F. Liu, X.F. Guo, G.C. Yang, Mater. Sci. 36 (2001) 579.
[18] R.R. Coelho, I. Hovel, A.L. de Souza, Am. Chem. Soc. 51 (2006) 21.
[19] Powder Diffraction File (Type PDF-2), Diffraction Data for XRD Identification, International Centre for Diffraction Data, PA, USA, 1997.
[20] A. Cents, D. Brilman, G. Versteeg, Chem. Eng. Sci. 60 (2005) 5830.
[21] D. Zhu, C.S. Ray, W. Zhou, D.E. Day, Mater. Sci. 39 (2004) 7351.
[22] B.D. Cullity, S.R. Stock, Elements of X-ray Diffraction, 3rd ed. Prentice-Hall Inc., Englewood Cliffs, NJ., 2001, p.167.
[23] N. Yildiz, A. Calimli, Turki J. Chem. 26 (2002) 393.