Contents list available at IJRED website
Int. Journal of Renewable Energy Development (IJRED)
Journal homepage: http://ejournal.undip.ac.id/index.php/ijred
Effect of Hydraulic Retention Time on Biogas Production from
Cow Dung in A Semi Continuous Anaerobic Digester
Agus Haryanto
*, Sugeng Triyono, Nugroho Hargo Wicaksono
Department of Agricultural Engineering, Faculty of Agriculture, the University of Lampung, Indonesia
ABSTRACT. The efficiency of biogas production in semi-continuous anaerobic digester is influenced by several factors, among other is loading rate. This research aimed at determining the effect of hydraulic retention time (HRT) on the biogas yield. Experiment was conducted using lab scale self-designed anaerobic digester of 36-L capacity with substrate of a mixture of fresh cow dung and water at a ratio of 1:1. Experiment was run with substrate initial amount of 25 L and five treatment variations of HRT, namely 1.31 gVS/L/d (P1), 2.47 gVS/L/d (P2), 3.82 gVS/L/d (P3), 5.35 gVS/L/d (P4) and 6.67 gVS/L/d (P5). Digester performance including pH, temperature, and biogas yield was measured every day. After stable condition was achieved, biogas composition was analyzed using a gas chromatograph. A 10-day moving average analysis of biogas production was performed to compare biogas yield of each treatment. Results showed that digesters run quite well with average pH of 6.8-7.0 and average daily temperature 28.7-29.1. The best biogas productivity (77.32 L/kg VSremoval) was found in P1 treatment (organic loading rate of 1.31 g/L/d) with biogas yield of 7.23 L/d. With methane content of 57.23% treatment P1 also produce the highest methane yield. Biogas production showed a stable rate after the day of 44. Modified Gompertz kinetic equation is suitable to model daily biogas yield as a function of digestion time.
Keywords: biogas, yield, cow dung, loading rate, semi-continuous digester, Gompertz kinetic model.
Article History: Received March 24th 2018; Received in revised form June 2nd 2018; Accepted June 16th 2018; Available online
How to Cite This Article: Haryanto, A., Triyono, S., and Wicaksono, N.H. (2018) Effect of Loading Rate on Biogas Production from Cow Dung in A Semi Continuous Anaerobic Digester. Int. Journal of Renewable Energy Development, 7(2), 93-100.
https://doi.org/10.14710/ijred.7.2.93-100
*
Corresponding author: [email protected]
1. Introduction
Along with economic growth, the energy need of Indonesia also increases. During period of 2000-2015, the final energy consumption in Indonesia (including biomass) grew from 777.9 million to 1,040.7 million of barrel oil equivalent with an average annual growth of 2.65% (MEMR, 2016). The growth is projected to increase into 4,3% under base scenario or into 5,1% under high scenario (Sugiyono et al., 2016). Primary energy supply in Indonesia was dominated by fossil fuels with a total of 75.35% including oil (31.49%), coal (24.28%), gas (19.04%) (MEMR, 2016).
On the other side, Indonesia is bestowed with enormous sources of biomass that can be explored as renewable energy. Biomass resource has a potential of 32,654 MWe, but only 1,626 MW (off grid) and 91.1 MW (on grid) have been developed so far. Important biomass sources include a great number of solid and liquid wastes from agricultural, agro-industry, and livestock activities. Livestock in Indonesia is increasingly growing and by 2016 the number was: dairy cattle (534,000), beef cattle (16,093,000), buffalo (1,386,000), goat (19,608,000), sheep (18,066,000), pig (8,114,000), horse (438,000), duck (45,321,960), native chiken (298,673,000), layer chiken
(162,051,000), and broiler chicken (1,592,669,000) (Ditjenak, 2016). Dung or feces excreted from livestocks can be utilized to produce biogas through anaerobic digestion process.
Anaerobic digestion is a promising way to convert agriculture waste into energy (biogas) especially in developing countries. Regarding socio-economic features of villagers in less developed countries, the biogas is the right option in meeting both energy and environmental problems (Kabir et al., 2013).
Biogas not only alleviates energy shortage in rural areas but also effectively reduces the environmental risk associated with agricultural waste management (Song et al., 2014). Various appliances can be fuelled by biogas with cooking offering an application suitable for deployment in developing countries. Other applications include the use of biogas as fuel for heating, lighting or power generation. In addition, slurry digestate can be utilized as good compost.
Small scale biogas installations systems allow energy generation on site, thereby eliminating the energy need for intensive transportation (Naik et al., 2014). Small-scale biogas plants with no agitation and heating devices are most feasible because of convenience in management
and maintenance (Song et al., 2014). In addition, the operation and maintenance of household bio-digesters are easier, and their environmental and economic performances are superior compared to those of medium and large scale. Household biogas digesters are suitable for undeveloped regions where the rural residents live far apart from each other (Song et al., 2014). Under correct and proper construction of the feeding process, small scale biogas digester is able to supply sufficient energy to the people but also provide digestate that can be used efficiently as fertilizer on the farm, replacing chemical nitrogen and phosphorus (Luo et al., 2016). Recently Haryanto et al. (2017) reported that a family scale biogas digester with five cows potentially provides annual economic benefit of 111.6 USD and reduce greenhouse gas emission by 2674.8 kg CO2 equivalent. Family size
biogas technologies play a significant role to fulfil energy need in some countries such as China (Chen et al., 2014), India (Singh & Sooch, 2004), Nepal (Barnhart, 2014), Bangladesh (Khan et al., 2014), and Vietnam (Nguyen, 2011).
Anaerobic digesters can be classified in mainly three types based on the feeding strategy, namely batch, semi-continuous and semi-continuous modes. In semi-semi-continuous system, the digester is periodically loaded with substrate according to a specific rate (Aboudi et al., 2015). Most family scale biogas digesters developed in Indonesia use cowdung as substrate with semi continuous loading mode. This is caused by a fact that cowdung is excreted intermittently in such a limited amount. The quantity of manure excreted by an adult cow is 5.8% (wet basis) of its weight (ASAE, 2003). Normally, adult cows will defecate up to 16 times and urinate up to nine times a day (Aland et al., 2002). Therefore, the cowdung has to be collected first prior to its introduction into the biogas digester.
Biogas digester performance is affected by many factors, among others are microbial population, acidity (pH), carbon-to-nitrogen mass ratio (C/N ratio), operating temperature, substrate particle size, organic loading rate, hydraulic retention time, total solids content, and reactor configuration (batch or continuous, single or two stage) (Naik et al., 2014). The process tends to fail if one or more of the environmental factors changes suddenly. Loading rate is a very important factor because it affects the stability of the anaerobic digestion and the biogas production rates. Because volatile solids represent the portion of organic-material of solids that can be digested, then organic loading rate (OLR) indicates the amount of volatile solids to be fed into the digester each day (Babaee & Shayegan, 2011). Optimum organic loading rate is required to maximize biogas production; otherwise the productivity will be low. The purpose of this study was to investigate the effect of loading rate on the biogas yield produced from cow dung using semi continuous digester. The suitability of modified Gompertz kinetic equation is also discussed. Implication of the results is important in designing family scale cowdung biogas digesters.
2. Materials and Methods
2.1. Digester configuration
Biogas production was carried out using lab scale self-designed 36-L semi continuous anaerobic digester. Five
digesters each of 25 litres working volume were set up for this experiment. The digester vessels were made of two 5-gallon transparent plastic drinking water containers as depicted in Figure 1. The two containers were cut at their bottom and then combined by using fiber resin and let it to dry for 24 hours.
Fig. 1 Lab scale self-designed 36-L semi continuous digester
2.2. Feedstock
Substrate used to produce biogas was fresh cowdung collected from the Department of Animal Husbandry, the University of Lampung. In order to have a maximum biogas yield, fresh cow dung was diluted with tap water at a ratio of 1:1 (Abubakar & Ismail, 2012; Ituen et al., 2007). Fresh cow dung was analyzed for its moisture content, total solid (TS), volatile solid (VS), ash, carbon (C), and nitrogen (N) content. Same analysis for TS and VS was also performed for spent slurry. Table 1 presents results of the analysis.
2.3. Treatment
Initially, 25 L of the diluted cowdung was loaded into the digester. The digester was refilled at five different loading rates as presented in Table 2. The table also provides the respected organic loading rate (OLR) and hydraulic residence time (HRT).
Table 1
Characteristic of fresh cow dung.
Characteristic Average Value
Water content (% wb) 80.12 Total solid, TS (% wb) 19.88
Ash (%TS) 30.58
Volatile solid, VS (% TS) 69.42
C 39.87
N 1.42
C/N ratio 28.1
Table 2
Loading rate variations and their corresponding OLR and HRT
Treatment P1 P2 P3 P4 P5
TS (%) 9.19 9.10 9.21 9.10 9.16 VS (%TS) 71.38 70.44 69.07 73.45 72.53 Loading Rate
(L/day)
0.5 1.0 1.5 2.0 2.5
2.3. Analysis and Calculation
The moisture content of samples was obtained by sun drying followed by oven-drying (Memmert type UM 500) at 105°C for 24 hours. Volatile solid was determined by burning the sample in a muffle furnace (Barnstead International model FB1310M-33) at 550°C for at least two hours. Sample was also sent to Soil Science Lab. to determine the C and N content.
Important processing parameters include pH, temperature (digester and ambient), and biogas production (P). The pH was measured daily for fresh (inlet) and spent (outlet) substrate using portable digital pH-meter (PHMETER, PH_009(I)). Digester efficiency was evaluated from VS removal (VSr), that is part of VS removed during anaerobic digestion process and is calculated based on Koch (2015):
VSr (%) =
100
afternoon) using digital thermocouple (Digi Sense, Cole Parmer, model No. 93410-00) equipped with K-type wire. Biogas production was measured daily using water displacement method. Observation was recorded for 55 days, by which time the digestion process was expected to already stable and the digesters were operating in practically steady conditions. After stable condition was achieved, biogas composition was analyzed using gas chromatography (Shimadzu GC 2014) with thermal conductivity detector (TCD) and 4 m length of shin-carbon column. Helium gas was used as carrier gas with flow rate 40 ml/min. Biogas yield (Y) was calculated from biogas production (P) at stable condition by using:Y = P/VSr (L/gVSr) (2)
3. Results and Discussion
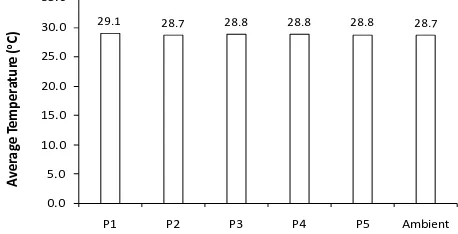
3.1. Process temperature and pH
Figure 2 showed average daily temperatures of the working temperature, anaerobic digestion process is classified into psychrophilic (10–20 oC), mesophilic (20–
40 oC), and thermophilic (40–60 oC) (Salam et al., 2015;
de Mes et al., 2003). Digester temperatures, however, were slightly higher than the ambient. This was caused by a fact that some processes during anaerobic digestion are classified as endothermic, and the others are exothermic. But overall, anaerobic digestion process is very slightly exothermic reaction that producing heat (de Mes et al., 2003). However, the digesters or reactors were quite small with no such insulation that the heat produced during digestion process was easily transferred to the environment. As a consequence, the temperature of the digesters was just little higher than or in balance with environment or ambient temperature. Daily digester temperatures were affected by ambient
temperature. As seen in Figure 3, daily digester and ambient temperatures were presented separately for morning, noon, and afternoon. The digester temperatures were low during morning time and then increased during noon and afternoon. The same pattern was observed for ambient air.
29.1 28.7 28.8 28.8 28.8 28.7
0.0 treatment and ambient air temperature.
Figure 4 showed daily pH values of the five different treatments for 55 days observation. It can be seen that the average pH values were slightly differ, between 6.8– 7.0 with the maximum values between 7.5–7.8 and the minimum values of 5.8–6.4.
Biogas is produced during biological process involving a group of bacteria working in an anaerobic condition. The interaction of several factors affects the performance of biogas process. Temperature and pH are among the important factors. The bacteria optimally work at a certain pH range. Methanogenic bacteria work effectively at the pH range of 6.5 to 8. Hydrolysis and acidogenis stages optimally go on at a pH range between 5.5 and 6.5 (Sibiya et al., 2014). Anaerobic degradation processes meet the requirement for both activities and cell growth of anaerobic microorganisms at the acidity of 5.5–8.5 (Abbasi et al., 2012).
Stafford (1982) reported the effects of pH upon methane production from anaerobic digestion of dairy cattle manure maintained at pH levels of 7.6, 7.0, 6.0, 5.5, and 5.0. Active digestion was achieved at all pH levels except for pH 5.0. Biogas and methane production was highest at pH of 7.0. In our experiment, the pH value of fresh substrate was in the range of 6.5 – 7.7. The pH was observed changing overtime but the value was close to the initial. This implied that the system was well buffered. Although there were some decreases in the pH, but overall, the values were still in the good range for biogas process. The values also indicated that biogas process was in good condition for all treatments.
3.2. VS removal
7.13 6.47 6.9 6.82 6.34 27 6.75 7.04 7.64 7.16 6.05 30.8 6.79 6.54 6.59 6.51 6.98 30.1 6.82 7.31 6.64 7.06 6.9 30.3 6.65 6.51 7.09 6.92 7.12 31.5 7.09 7.22 6.8 6.99 7.06 32.1 6.66 6.67 7.8 7.31 6.83 32.6 6.92 6.78 7.13 7.49 7.57 31.7 7.63 6.91 6.95 6.98 7.55 30 7.25 7.77 7.59 7.55 7.57 31.2 7.52 6.95 7.86 7.72 7.33 33.5 7.2 7.38 7.39 7.75 7.68 28.5 7.15 7.65 7.9 7.39 7.94 30.2 7.75 7.1 7.53 7.19 7.87 30.5 6.89 7.66 7.51 7.43 7.11 32.2 6.86 7.4 7.71 7.78 7.01 26.8 7.32 6.8 7.3 7.13 7.8 31.7 7.31 6.94 7.08 7.45 7.74 29.6 7.22 6.83 7.09 7.22 7.71 29 6.8 7.33 6.87 7.16 7.08 30.4 6.7 6.94 7.48 7.97 7.08 29.3 7.76 7.78 7.32 7.78 7.08 27.1 7.05 7.24 7.69 7.3 7.36 28.2 7.01 7.22 6.87 7.73 7.2 29 6.86 7.38 7.91 7.35 7.65 31.5 7.34 7.8 7.74 7.91 7.25 30.6
Fig. 4 Daily pH values of the anaerobic digestion process (small figure in the centre is average pH value during 53-day measurements)
Figure 5 showed the relationship of organic loading rate and VS removal. Elevating loading rate has resulted in slightly increase of VS removal. But at an organic loading rate of higher than 5.35 g VS/L/d, there was a tendency of VS removal to decrease. The digester efficiency (in term of VS removal) was almost same in the range of 42.1% to 46.4%. Babaee & Shayegan (2011) reported that at an OLR range of 1.4-2.75 gVS/L.d, VS removal decrease with increasing OLR. On the other hand, Gomez (2010) reported at an OLR range of 3.4-5.0 gVS/L.d, an increase in organic matter biodegradation was observed with increasing the OLR.
3.3. Biogas Yield
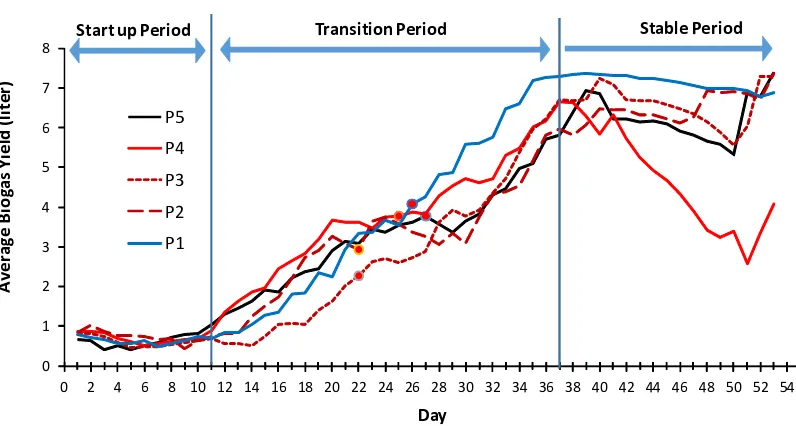
By using a 10-day moving average, the daily biogas yield is presented in Figure 6. In Figure 6, we can differentiate three regions, namely acclimatization or
start up, transition, and stable periods. The figure shows that acclimatization period goes on for 11 days.
0.0 20.0 40.0 60.0 80.0 100.0 120.0
0.0 1.0 2.0 3.0 4.0 5.0 6.0 7.0
V
S
re
m
o
va
l
Organic Loading Rate (g VS/L.d) VS removal (%) VS removal (gram)
Fig. 5 Effect of loading rate on VS removal
0 1 2 3 4 5 6 7 8
0 2 4 6 8 10 12 14 16 18 20 22 24 26 28 30 32 34 36 38 40 42 44 46 48 50 52 54
A
ve
ra
ge
B
io
ga
s
Y
ie
ld
(l
it
e
r)
Day P5
P4
P3
P2
P1
Transition Period Stable Period
Start up Period
During this period, biogas production is low and almost constant at an average lest than one litre a day. Pandey et al. (2013) noted that start up period takes place 1–3 weeks. Main problem during this period is creating a balanced population, characterized by low biogas yield.
The transition period started at day 11 and finished at around day 37 at which the stable period starts. It is revealed that during transition period the biogas yield gradually increases from around 0.6-0.9 to around 5-7 L/d. After stable period was achieved, biogas yield was stable at around 6 to 7 L/d. Again, treatment P1 with OLR of 1.33 g VS/L/d showed the best and gave the highest biogas yield with average of 7.23 L/d. In addition to biogas production measurement, the biogas was burnt to simply check if the biogas contains enough methane. It was observed that for the first three weeks the biogas could not be combusted, implying that the methane content was still low. In the figure, we indicated the day at which the biogas was able to be burnt and produce blue flame, namely day 22 for P2 and P3, day 25 (P4), day 26 (P5), and day 27 (P1).
Figure 7 shows cumulative biogas production resulted from different treatments. The figure reveals that treatment P1 with OLR of 1.33 g VS/L/d give the highest cumulative biogas production 194.4 L during 53 days of consecutive measurement. Based on these date, we have calculated the biogas yield and biogas productivity. The results are presented in Figure 7. Both biogas yield and
Fig. 7 Cumulative biogas production.
It is obvious that loading rate influences not only the biogas yield but also biogas productivity. Previously we have showed that the increase in loading rate has resulted in the increase of VS removal (Figure 4). In contrast, Figure 8 shows that by increasing loading rate the biogas yield as well as biogas productivity decreased. This can be understood because the higher the loading rate (meaning the shorter HRT) the process becomes uncomplete so that the biogas production is also low.
This also implies that the decomposition process was not completed yet. Figure 8 also further strengthens the conclusion that treatment P1 with organic loading rate of 1.31 g VSL/d is the best for biogas production with biogas productivity of 77.32 L/kg VS removal. Jha et al. (2012) reported higher productivity (358 LCH4/kgVS removal).
This means that there is a challenge to improve the biogas productivity, for instance by applying agitation or other mechanical treatments.
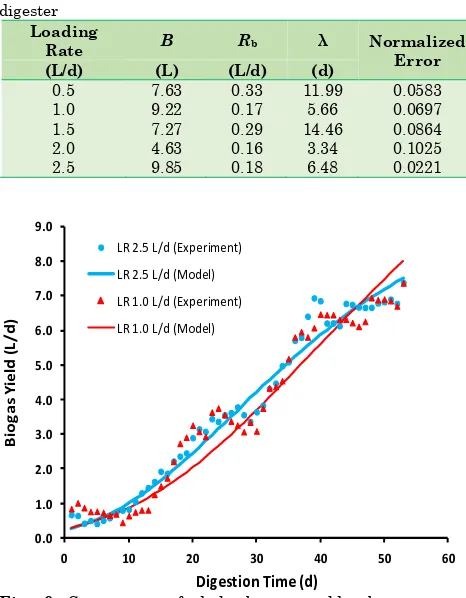
From Figure 7 it is revealed that relationship of daily biogas yield and digestion time resembles a sigmoidal curve. One of kinetic model that is suitable to describe this is modified Gompertz kinetic equation. This model describes a sigmoidal growth curve contained three unknown mathematical parameters (Syaichurrozi et al., 2013) and is recently used by many researchers to describe a cumulative biogas yield from a batch system as a function of digestion time, for example Budiyono et al. (2010), Yusuf et al., 2011), and Syaichurrozi et al., 2013). For the case of our work (with a semi continuous digester), modified Gompertz kinetic equation is presented as: function of the MS Excel ToolPak (Yusuf et al., 2011).
yield as a function of digestion time. Based on this model, the highest value daily biogas production potential (B) of 9.85 L is achieved at a loading rate of 2.5 L/d with maximum production rate of 0.18 L/d and lag time of 6.44 days. Figure 9 presents the suitability of modified Gompertz kinetic equation for daily biogas yield produced from semi continuous digester of two loading rates, namely 1.0 L/d and 2.5 L/d.
Table 3
Gompertz kinetic parameters of semi continuous cowdung digester
Loading
Rate B Rb λ Normalized
Error
(L/d) (L) (L/d) (d)
0.5 7.63 0.33 11.99 0.0583 1.0 9.22 0.17 5.66 0.0697 1.5 7.27 0.29 14.46 0.0864 2.0 4.63 0.16 3.34 0.1025 2.5 9.85 0.18 6.48 0.0221
0.0 1.0 2.0 3.0 4.0 5.0 6.0 7.0 8.0 9.0
0 10 20 30 40 50 60
Bi
o
g
a
s
Y
ield
(L
/
d
)
Digestion Time (d)
LR 2.5 L/d (Experiment)
LR 2.5 L/d (Model)
LR 1.0 L/d (Experiment)
LR 1.0 L/d (Model)
Fig. 9 Comparison of daily biogas yield: observation vs. prediction using Gompertz kinetic model.
3.4. Biogas Composition
Biogas is generally used as fuel. Therefore, its value is determined by combustible components, i.e. methane. Good quality biogas mainly consists of methane at around 55-70% followed by carbon dioxide around 30-45%. Table 4 presents the composition of biogas. It was revealed that the biogas comprised of fairly high methane content (41.73 to 57.23 %) so that it was well burnt and can be used for fuel. The table shows that methane content decreases by increasing loading rate with the highest value (57.23%) is given by biogas collected from digester with OLR of 1.33 g VS/L/d). Increasing loading rate means shortening HRT that leading to incomplete decomposition of organic matter.
Table 4
Biogas composition.
Composition P1 P2 P3 P4 P5
CH4 57.23 50.53 49.82 51.80 41.73 CO2 31.13 32.91 40.43 35.82 39.04 N2 11.54 16.56 9.75 12.38 19.23
3.5. Reflection to Family Digester
Our previous work reported that family scale cowdung biogas digester with a capacity of 3.5 to 6.0 m3 was fed
with loading rate of 80 to 150 L/d that resulted in hydraulic retention time of 32 to 40 days. As presented in Table 5, we have calculated that the digesters have organic loading rate between 1.2 to 1.62 g VS/L.d which is very closed with our best condition. This means that the family digesters in the field were fed with a very good loading rate. This also implies that digesters were installed with good design so that the size complies with feedstock availability.
Table 5
Characteristic of family scale cow dung biogas digester
Digester
A B C D
Digester type Plastic tube
Plastic tube
Fixed dome
Fixed dome Digester capacity (L) 3500 4700 6000 6000 Working volume (L) 2800 3760 4800 4800 Loading rate (L/d) 80 80 150 120
HRT (d) 35 47 32 40
VS content (%) 5.66 5.27 5.49 6.28 OLR (g VS/L/d) 1.617 1.121 1.373 1.256
Source: Adapted from Haryanto et al. (2017)
*) working volume was assumed as 80% of digester capacity.
4. Conclusions
Loading rate influenced biogas yield and biogas productivity from cowdung in semi continuous digester. Increasing loading rate resulted in the decrease in both biogas production and biogas yield. Organic loading rate of 1.31 g VS/L/day gave the highest biogas yield (average 7.32 L/day) and biogas productivity (77.32 L/kg VS removal). The biogas produced from cow dung using semi continuous digester contained fairly good methane content up to average 57.23%. Digester efficiency, in term of VS removal, was almost same for all treatments and was in the range of 42.1% and 46.4%. Daily biogas yield as a function of digestion time can be adequately represented by modified Gompertz kinetic model.
Acknowledgments
The authors acknowledge the Directorate General of Higher Education (DIKTI), Ministry of Research, Technology, and Higher Education for supporting this work under STRANAS scheme with contract number: 419/UN26/8/LPPM/2016 (June 2, 2016).
References
Abbasi, T.S., Tauseef, M., & Abbasi, S.A. (2012) Biogas Energy. New York: Springer Briefs in Environmental Science. Aboudi, K., Álvarez-Gallego, C.J., & Romero-García, L.I. (2015)
Semi-continuous anaerobic co-digestion of sugar beet byproduct and pig manure: Effect of the organic loading rate (OLR) on process performance. Bioresource Technology, 194, 283–290.
Aland, A., Lidfors, L., & Ekesbo, I. (2002) Diurnal distribution of dairy cow defecation and urination. Applied Animal Behaviour Science, 78, 43–54.
Babaee, A. & Shayegan, J. (2011) Effect of organic loading rates (OLR) on production of methane from anaerobic digestion of vegetables waste. World Renewable Energy Congress 2011, Linköping, Sweden: May 8–13, 2011.
Barnhart, S. (2014) From household decisions to global networks: biogas and the allure of carbon trading in Nepal. The Professional Geographer, 66(3), 345–353. Budiyono, Widiasa, I.N., Johari, S., and Sunarso. (2010) The
kinetic of biogas production rate from cattle manure in batch mode. International Journal of Chemical and Biological Engineering, 3(1), 39–44.
Ditjenak (Direktorat Jenderal Peternakan dan Kesehatan Hewan). (2016) Livestock and Animal Health Statistics 2016. Jakarta: Ministry of Agriculture.
Chen, Y., Hua, W., Feng, Y., & Sweeney, S. (2014) Status and prospects of rural biogas development in China. Renewable and Sustainable Energy Reviews, 39, 679–685.
de Mes, T.Z.D.A., Stams, J.M., Reith, J.H., & Zeeman, G. (2003) Methane production by anaerobic digestion of wastewater and solid wastes. In Bio-methane & Bio-hydrogen: Status and Perspectives of Biological Methane and Hydrogen Production (Edited by: J. H. Reith, R. H. Wijffels, and H. Barten). Dutch Biological Hydrogen Foundation, the Netherlands.
Gomez, E.F. (2010) Effects of Organic Loading Rate on Reactor Performance and Archaeal Community Structure in Mesophilic Anaerobic Digesters Treating Municipal Sewage Sludge. M.Sc. Thesis, The Ohio State University, Ohio, USA. 2010.
Haryanto, A., Cahyani, D., Triyono, S., Murdapa, F., & Haryono, D. (2017) Economic Benefit and Greenhouse Gas Emission Reduction Potential of A Family-Scale Cowdung Anaerobic Biogas Digester. International Journal of Renewable Energy Development, 6(1), 29-36.
Ituen, E.E., John, N.M., & Bassey, B.E. (2007) Biogas production from organic waste in Akwa Ibom State of Nigeria. In Appropriate Technologies for Environmental Protection in the Developing World: Selected Papers from ERTEP 2007, July 17-19, Ghana. (Ernest K. Yanful, editor). Germany: Springer Science + Business Media B.V. Jha, A.K., Li, J., Ban, Q., Zhang, L., & Zhao, B. (2012) Dry
anaerobic digestion of cow dung for methane production: effect of mixing. Pakistan Journal of Biological Sciences, 15, 1111-1118.
Kabir, H., Yegbemey, R.N., & Bauer, S. (2013) Factors determinant of biogas adoption in Bangladesh. Renewable and Sustainable Energy Reviews, 28, 881–889.
Khan, U.K., Mainali, B., Martin, A., & Silveira, S. (2014) Techno-economic analysis of small scale biogas based polygeneration systems: Bangladesh case study.
Sustainable Energy Technologies and Assessments, 7, 68– 78.
Luo, T., Zhu, N., Shen, F., Long, E., Long, Y., Chen, X., & Mei, Z.A. (2016) Case study assessment of the suitability of small-scale biogas plants to the dispersed agricultural structure of China. Waste and Biomass Valorization, 7(5), 1131–1139.
MEMR (Ministry of Energy and Mineral Resources). (2016).
Handbook of Energy Economic and Statistics. Jakarta. Naik, L., Gebreegziabher, Z., Tumwesige, V., Balana, B.B.,
Mwirigi, J., & Austin, G. (2014) Factors determining the stability and productivity of small scale anaerobic digesters. Biomass and Bioenergy, 70, 51–57.
Nguyen, V.C.N. (2011) Small-scale anaerobic digesters in Vietnam – Development and challenges. Journal of Vietnamese Environment, 1(1), 12–18.
Pandey, P.K., Ndegwa, P.M., Soupir, M.L., Alldredge, J.R. & Pitts, M.J. (2011) Efficacies of inocula on the startup of anaerobic reactors treating dairy manure under stirred and unstirred conditions. Biomass and Bioenergy, 35, 2705–2720.
Salam, B., Biswas, S., & Rabbi, Md. S. (2015) Biogas from mesophilic anaerobic digestion of cow dung using silica gel as catalyst. Procedia Engineering, 105, 652–657.
Sibiya, N.T., Muzenda, E., & Tesfagiorgis, H.B. (2014) Effect of temperature and pH on the anaerobic digestion of grass silage. 6th International Conference on Green Technology, Renewable Energy & Environmental Engineering
(ICGTREEE). Cape Town, South Africa: Nov. 27–28, 2014. Singh, K.J. & Sooch, S.S. (2004) Comparative study of economics of different models of family size biogas plants for state of Punjab, India. Energy Conversion & Management, 45, 1329–1341.
Song, Z., Zhang, C., Yang, G., Feng, Y., Ren, G., & Han, X. (2014) Comparison of biogas development from households and medium and large-scale biogas plants in rural China.
Renewable and Sustainable Energy Reviews, 33, 204–213. Stafford, M.G. (1982) The Effect of pH on Methane Production
from Dairy Cattle Manure. Masters Thesis, University of Central Florida, USA.
Sugiyono, A., Anindhita, Wahid, L.M.A. and Adiarso (editors). (2016) Indonesia Energy Outlook 2016. Jakarta: Agency for the Assessment and Application of Technology (BPPT). Syaichurrozi, L., Budiyono, and Sumardiono, S. (2013)
Predicting kinetic model of biogas production and biodegradability organic materials: biogas production from vinasse at variation of COD/N ratio. Bioresource technology, 149, 390–397.
Yusuf, M.O.L., Debora, A. and Ogheneruona, D.E. (2011) Ambient temperature kinetic assessment of biogas production from co-digestion of horse and cow dung.