DETERMINATION UNDER
VOLTAGE REDUCTION MINIMUM SPANNING TREE
ON ELECTRICITY DISTRIBUTION NETWORK PRIMER
Hadiyanto1, Hardianto2
1 Department of Informatics Engineering, Sekolah Tinggi Teknologi Bontang, 2 Department of Electrical Engineering, Sekolah Tinggi Teknologi Bontang,
Jl. Ir. H. Juanda No. 73, Bontang 75321, Indonesia
1 Email : [email protected]
Abstract
Determination of the minimum spanning tree is widely used to solve optimization problems are problems that demand solutions minmum search. In the electricity distribution network, the minimum spanning tree (MST) is used to find the minimum cable length for the system to the power grid becomes more optimal. The use of a minimum weight minimum cable length can be used as a variable for calculating the voltage drop of an electricity distribution network. The method used in this research is the process of field observations and data processing. Field observations aims to take some of the coordinates of each pole on the electricity distribution network. While the data processing is done to create a geographic information system that is based on primary data in the form of a power pole coordinates data and secondary data along with the data in the form of electricity distribution networks. Furthermore, the results obtained by the minimum weight of the MST combined with existing data on the electricity distribution networks like cable cross-sectional area, the type of cable used, and the current through the tissue with voltage measurement results from the ends of the network to obtain voltage drop resulting from each feeder. Results (voltage drop) can be used as a basis for evaluating the electrical distribution network that has been existing, particularly in the City Bontang.
Keywords:
Minimum spanning tree, MST algorithm, voltage drop, graph
I.
I
NTRODUCTIONI.1. Background Issues
At this time, the algorithm has been widely used in various applications one in the field of electrical network. The use of algorithms tailored to the needs and accuracy of implementation in the field. Divided based optimization algorithm that produces, among other algorithms that search for the shortest path from one node to another node in a weighted graph and algorithms that search for the minimum spanning tree (finding the minimum spanning tree) is the trajectory on a weighted graph with the smallest amount of weight.
The use of maps in the application of a weighted graph can be done on geographic information systems (GIS). Geographic information system is a database system that is sapsial. Utilization of GIS makes it easy for users and decision-makers in determining the measures taken, especially policies related to spatial aspects. This is possible because of the ability of GIS to process and analyze data quickly and can be presented in a geographic format.
Additionally, the use of electrical cables that are too long in the electrical distribution network will affect the voltage quality of service and quality reliability of the power grid. Quality of service voltage is influenced by the size of the drop in voltage generated at the ends of the electrical network cable. While the quality of the electrical reliability is influenced by the intensity and duration of power outages occur.
Currently, the primary distribution 20kV power network in Bontang using radial system which means the use of a cable to the power grid to achieve electricity customers throughout the territory of Bontang only one direction only and will be longer. In effect, in the event of disturbances in the electrical network system, the primary distribution of electricity customers will experience a power outage
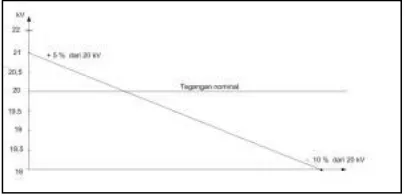
In theory, the voltage drop in the power distribution network is generally proportional to the length of electrical cable used and the electrical load and inversely proportional to the conductor cross-sectional area (Johnson, D. 1992). In accordance with the standards specified voltage by PT. PLN (SPLN), electricity distribution network design is made so that the voltage drop at the receiving end of a maximum of 10% of the voltage source lsitrik.
On the basis of the relationship between the length of conductors (power cord) to decrease the voltage (voltage drop) an electricity distribution network, then be made to study the minimum spanning tree mengaplikasian the electricity distribution network for the region, especially in the area of East Kalimantan Bontang. Electricity distribution network that will be used in this study only the primary distribution network (medium voltage network) ie electricity distribution network which has a voltage of 20kV. The algorithm used to obtain the minimum spanning tree is the MST algorithm.
It is intended to determine the magnitude of the voltage drop occurs in the primary voltage electricity network in the Bontang due to obtaining the optimal length of the cable from the system, as well as for equity fulfill the electricity network for residents in the area Bontang. It is expected with the use of algorithm MST (minimum spanning tree), the design of the electricity distribution network in the region Bontang can be optimized.
I.2. Formulation Of The Problem
Development and design of the electrical distribution network in an area where the population is still relatively rare is a problem that must be considered in the use of a minimum spanning tree (MST).
Thus the use of the algorithm on the selected MST must be able to be the best solution in the analysis and design of optimal electricity distribution network in PT. PLN Bontang area, in particular to determine whether the network cable lengths of electricity generated by the MST affect the voltage drop (voltage drop) in medium voltage power distribution network (JTM).
I.3. Benefits Of Research
This study is expected to contribute to the world of academia to broaden and literature for the development of Prim algorithm in use by other branches of science in solving the minimum spanning tree problem.
This research is also expected to provide benefits to practitioners to allow for the calculation and monitoring of the primary distribution grid systems. In addition, this study is expected to provide input in doing repairs and maintenance as well as help solve the existing problems in the primary distribution power network.
I.4. Research Purposes
This study aims to determine the minimum spanning tree of a primary electrical distribution network in the region Bontang which is based on the geographical conditions of the region using the MST algorithm, in order to obtain the minimum weight in the form of a minimum length of electrical cable near reality.
I.5. Scope Of Problem
Based on the formulation of the problem of the use of geographic information systems in determining the voltage drop in the power distribution network using the minimum spanning tree in the Bontang, the issues to be discussed limited to:
distribution or known as medium voltage network (JTM).
b) The process of determining the voltage drop (voltage drop) at 20kV primary distribution power network is based on the measurement data in the data source power generation and electricity receiver.
II.
T
HEORETICALB
ASISII.1. Decrease Voltage (Voltage Drop)
The voltage drop is the magnitude of the voltage is lost on a conductor. The voltage drop across the power line is generally proportional to the length of the channel and load and inversely proportional to the conductor cross-sectional area. The amount of voltage drop is expressed either as a percentage or in amounts Volt. The amount of upper and lower limits are determined by the discretion of the electricity company. Practical voltage drop calculation in certain limits by simply calculating the amount of prisoners can still be considered, but the network system, especially in medium voltage systems indukstansi issues and capacitance calculated as a significant value (PT PLN (Persero), 2010: pages 20).
The voltage drop is generally used in the load voltage. The voltage drop caused by current flowing through the wire custody. Conductor voltage drop V at greater if the current I in the conductor is getting bigger and if prisoners conductor R and ℓ greater. The voltage drop is responsible for the occurrence of losses in the conductor because it can lower the voltage on the load. Consequently up to be under the nominal voltage is needed. On the basis of these conditions, the voltage drop allowed for the installation of the strong currents of up to 1,000 V are specified in percent of the working voltage (Daryanto, 2010: page 18 & 42).
Fig. 1. Voltage tolerance permitted services. (Source: State electricity company standards (SPLN))
In accordance with the standards prescribed by PLN tengangan (SPLN), network design is made so that the voltage drop at the end of the acceptable 10%. The voltage drop on the network due to the voltage loss due to electrical resistance (R) and reactance (X). Phasor voltage drop Vd in a conductor that has an impedance (Z) and carrying a current (I) can be described by the formula:
Vd = I . Z (1)
In this discussion is meant by the voltage drop (ΔV) is the voltage difference between send (Vk) with voltage receive (VT), the voltage drop can be defined are:
∆V = ( Vk ) – (VT) (2)
The existence of the conductor resistance then the voltage received by consumers (Vr) will be smaller than send voltage (Vs), so that the voltage drop (Vdrop) represents the difference between the voltage at the base of delivery (sending end) and the voltage at the receiving end (receiving end) power . The voltage drop relative called VR voltage regulation (voltage regulation) and is expressed by the formula:
in which:
Vs = the voltage at the base of delivery Vr = voltage at the receiving end
To calculate the voltage drop, calculated reaktansinya, as well as the power factor is not equal to one, then the following will describe how perhitunganya. In simplifying the calculation, it is assumed her burdens is a balanced three-phase load and power factor (cos φ) between 0.6 s / d 0.85. voltage can be calculated based on a formula approach to the relationship as follows:
in which:
I = load current (Ampere)
R = Prisoners circuits (Ohm)
X = reactance circuit (Ohm)
bottleneck of an object. Barriers also inversely proportional to the cross-sectional area of objects, the cross section, the smaller obstacles.. Barriers also directly proportional to the type of object (resistivity) the greater the species barrier, the greater the obstacles it. In mathematics can be written:
R = ρ.L/A (5)
where is:
ρ = Barriers TYPE (ohm / m) L = is the length of object (m)
A = sectional area is (m squared) cross-sectional area usually circle shape.
III.
R
ESEARHM
ETHODSIII.1. Materials Research
The data collected in this study is used to answer the research questions have been formulated, since the data obtained will be used as the basis in the conclusion. The data collection method used in this study, among others:
1. The study of literature, the literature search on the basis of knowledge on matters related to this research. This method is done by finding books, articles, and scientific journals of the algorithm, which is one branch of computer science, in particular regarding the graphs, the minimum spanning tree, and the MST algorithm. It also conducted a search of the existing spatial data in geographic information systems (GIS) as well as matters relating to the drop in voltage (voltage drop) in an electrical distribution network.
2. Data collection electricity distribution network from PT. PLN (Persero) Area Bontang. The data obtained are single data line diagram electrical network 20kV primary distribution (medium voltage network) with multiple feeders (feeder) in the region of PT. PLN (Persero) Area Bontang. It also obtained berkitan data directly to the voltage drop (voltage drop) on the electricity distribution network in the form of voltage on each end of the feeder (feeder), the data distribution transformers, as well as the data type of conductor cables used in 20kV primary distribution power network.
3. Data collection Bontang map administrative regions obtained from the Regional Development Planning Agency (Bappeda) Bontang. The data used is the data area, as well as multiple data streams and roads. The data collection method map using photogrammetric method (aerial photographs) and validated by the
Bakosurtanal (Agency coordinating national survey and mapping).
II.2. Research Tools
The tools used in this study are: 1. Hardware (hardware)
a. Computer with an Intel Core 2 CPU T5500 1.66 GHz.
b. Memory 1.50 GB of RAM. c. 80 GB hard disk.
d. Monitor 14,1'inchi. e. Printer.
f. Scanner. 2. Software (software)
a. Microsoft Windows XP operating system. b. MapInfo Version 8
c. ArcView GIS version 3.3. d. Microsoft Office 2007. e. Microsoft Visio 2003.
II.3. System Design
In this research, there is a design that will be done, among others:
• Diagram Context
primary distribution power network are in the Bontang can be explained in Figure 2:
Sistem Penentuan Jalur Minimum Jaringan Listrik Distribusi Primer 20kV di Wilayah
Kota Bontang dengan menggunakan MST Pengguna
(User)
- Graf jaringan listrik distribusi primer. - MST dari jaringan listrik distribusi primer. - Panjang kabel listrik dan waktu komputasi algoritma prim
Data primer dan sekunder
Fig. 2. Diagram of the context of the determination of the minimum path
Based on Figure 2, the user (users) on these systems incorporate secondary data Bontang map Building administrative regions, among others; road data, and the data stream. In addition, users enter the primary data in the form of data 20kV primary distribution power network, among others; Data electric poles primary distribution, medium voltage air channel data (SUTM) on each feeder (feeder), the data distribution substations, the data LBS (load breaker switch), and the distance data between the primary distribution of electric poles, between distribution substations, or between LBS. Furthermore, this system can display a graph model of 20kV primary distribution power network, showing the results of the minimum path 20kV primary distribution power network, the order of the wires that run electricity distribution poles, resulting in the search path computation time minimum primary distribution power network, and displays the graph of the results MST testing.
• Data Flow Diagrams
DAD describe data storage and processes that transform data. DAD shows the relationship between the data in the systems and processes that follow. The DAD in the system of determining the minimum path power distribution network using the minimum spanning tree with a case study of 20kV primary distribution power network in Bontang region can be explained in Figure
Fig. 3. Flow diagram of the data on the system level 0 MST
Broadly speaking, drawing 4.3 has several processes in a data flow diagram (DAD) at the system level 0 MST algorithm using ArcView GIS 3.3 program. There are several processes that occur in the figure 3, which includes;
1) Process the data record distribution of electricity poles.
2) Process the data record SUTM cable.
3) Process the data record distribution substations.
4) Process the data record LBS / ABS. 5) The process of recording the data path. 6) The process of recording data for the
determination of the minimum path to the MST.
7) The process of recording the data on the results of the determination of the minimum path MST.
8) The process of electricity distribution network graph showing the primary.
9) The process of showing the minimum path of MST.
10) The process of displaying graphics test results MST.
Relation Between Tables
bases on the program ArcView GIS 3.3. The program is built with ArcView GIS 3.3 uses several tables in databases, including mast table, the table cables, substations table, table LBS / ABS, and tables road. Relationships between tables are shown in Figure 4:
Gardu
Fig. 4. Relationships between tables in MST
III.4. Stages Research
This research was conducted through the following stages:
1. Observation and data collection 20kV primary distribution power network in PT. PLN (Persero) Area Bontang and administrative map data Bontang region.
2. Installing the programs needed and settings. 3. Preparing the existing data so that it can be
used by application programs.
4. Designing a graph model of 20kV primary distribution power network in accordance with the data obtained, then the graph is given from the input data required to find the minimum weight of a graph of each electric pole that has been adapted to the Bontang administrative map data using ArcView program GIS 3.3 5. Using the MST algorithm determined the
minimum spanning tree of the graph model at 20kV primary electrical distribution network. Furthermore, calculations and simulations performed by the program ArcView GIS 3.3 network 20kV primary distribution based on data from the minimum length of the cable resulting from the minimum spanning tree (MST). The calculation is done untu each
feeder (feeder) that exist in the electricity network in the area of 20kV primary distribution area of Bontang.
7. Make an analysis of the results obtained from the calculation of the voltage drop (voltage drop) and a minimum length of the power cord from the MST algorithm.
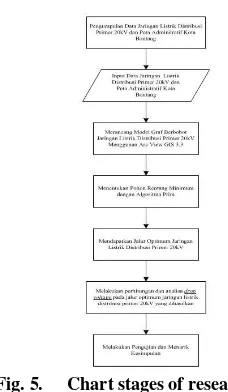
8. The last step is to draw conclusions from the results of the analysis that has been done. The stages of this research can be illustrated in Figure 5 as follows:
Fig. 5. Chart stages of research
Determination Process Stages Minimum Range Trees
Minimum weight is obtained together with the process of determining the minimum path with MST algorithm. This condition occurs because the determination of the minimum path with the minimum spanning tree has adapted to the circumstances of the region, especially in Bontang.
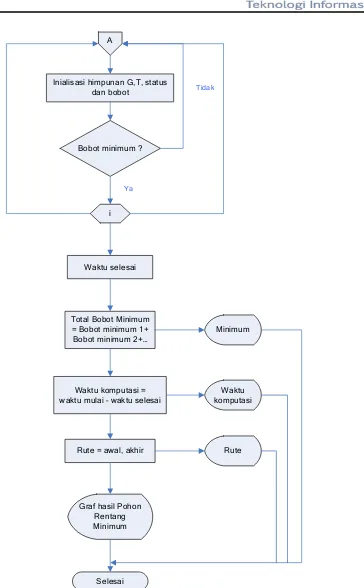
Furthermore, these data are processed using the MST algorithm has been modified to obtain results in a minimum path a 20kV primary distribution power network in the Bontang, accompanied by the total weight of the resulting minimum, meaning that the total length of electrical cable used to connect the poles 20kV primary distribution. In addition, the process produces a sequence path / route and computing time in search of the minimum path. These stages can be described in terms of the program flowchart in Figure 6:
Mulai
Masukkan titik, tinggi titik, dan jarak antar titik
Waktu mulai Inialisasi himpunan G,T, status
i=1 sampai banyak titik-1
Seleksi titik terpilih
j=1 sampai banyak titik-1
Titik terhubung garis?
Tampung Proses
j
A
Ya
Tidak
Pilih titik start (Mulai)
Terhubung dengan titik terpilih?
Ya Tidak
Baca jarak antar titik
Bobot minimum titik terpilih = jarak titik x,y
A
Waktu selesai
Total Bobot Minimum = Bobot minimum 1+
Bobot minimum 2+… Minimum
Waktu komputasi = waktu mulai – waktu selesai
Waktu komputasi
Rute Rute = awal, akhir
Graf hasil Pohon Rentang Minimum
Selesai Inialisasi himpunan G,T, status
dan bobot
Bobot minimum ?
i
Tidak
Ya
Fig. 6. Flowchart stages of determining the minimum spanning tree primary distribution power network of
an area by using algorithms Prim
IV.
R
ESULTS ANDD
ISCUSSIONIV.1. Testing Systems
Testing systems use geographic information systems in determining the voltage drop in the electrical distribution network using the minimum spanning tree method was conducted to determine the ability of the program in the MST algorithm produces the minimum spanning tree.
MST algorithm used program has been modified to include the parameter distribution of distances between power poles to produce a graph with minimum weight.
Further testing of the electricity distribution network which has been existing primary in Bontang. The goal is to determine the minimum length of a real cable used by the primary distribution grid systems Bontang.
Use of variation number of nodes, number of sides, and variation graph model is to get the test results form the MST algorithm's ability to determine the minimum spanning tree based on the distance between the input power lines. Testing this system also uses a program created with ArcView GIS 3.3 with the help of a script avenue.
The intent and purpose of this program is to help connect the data distribution of distances between power poles with MST algorithm method to obtain the minimum spanning tree of a weighted graph and implemented in primary distribution power network Bontang
IV.2. Discussion
From the testing that has been done, it will obtain the three-part test results. The first part of the test results of tests 1 to 3, and the second part is the result of testing 4 to 5. For the third part of the test results 6.
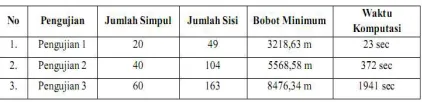
The results of testing the first part focuses on the ability of the system to produce MST with minimum weight for different conditions. In addition, to determine the computing time required by the system to determine the minimum spanning tree. Directly address the test results 1 through 3 testing for minimum weight and computation time required can be seen in Table 1 below:
Table 1. Minimum weight and computing time testing 1 to 3
Based on Table 1 shows that the algorithm computation time required minimum spanning tree (MST) in generating the minimum weight has increased along with the number of vertices and sides of a graph. Determination of the minimum weight of a region with MST algorithm will require long
computation time and when if the number of nodes and the graph plus. This is due to the addition of the script program on the MST algorithm, so the determination of minimum weight with MST algorithm will have additional calculation process to generate the minimum weight on each graph.
Furthermore, the results of testing the second part focuses on the ability of the MST algorithm to generate the minimum spanning tree in the form of minimum weight, which is implemented into the primary distribution power network that has existing Bontang. Of implementation, expected to be obtained weights minimium of electricity distribution network MST Bontang optimal primer is the use of a minimum length of electrical cable based on geographical conditions Bontang.
The second part of the test results is the result of test 4 and test 5. Testing is done in different places, namely the village fires and residential areas Bontang KCY. The details of the test results and testing 4 5 can be seen in Table 2:
Table 2. Test results 4 and 5
Based on Table 2 shows that the error (error) data against reference (manual measurement) does not exceed 1%. The average error for the minimum weight of the resulting algorithm MST is equal to 0.384%. This mengindikaskan that the resulting minimum weight MST algorithm to determine the minimum spanning tree primary distribution power network is already nearing the actual cable length, although it is not 100% accurate.
V.
C
ONCLUSSIONS ANDS
UGGESTIONSBased on the achievement of the results achieved there are several conclusions that need to be considered, including:
(minimum spanning tree) in the form of long cables or conductors of electricity distribution networks JTM.
2. The weight of the resulting minimum MST algorithm can affect the voltage drop on the power grid in the area of primary distribution Bontang sebesare average of 10.062% of the voltage source.
R
EFERENCESBader, David. A (1999). Fast Shared- Memory Algorithms for Computing Minimum Spanning
Forest of Sparse Graphs,
http://www.ece.unm.edu.
Johnson, D.E, Hilburn, J.L, and Johnson, J.R, (1992), Electric Circuit Analysis, Second Edition, Prentice-Hall, Inc., Nee Jersey.
Nugraha, Deny W, (2010), Pen g k a ji a n Kom p l ek si t a s Wa k t u I m p l em en t a si Al g or i t m a MST (Studi Kasus Pada Jaringan Distribusi Listrik Primer di Wilayah Kota Palu), Tesis Program Studi
Teknik Elektro, Universitas Gadjah Mada,
Yogyakarta