Four Years into Welfare Reform:
How Successful was the Design and
Implementation of the Welfare
Reform Act 2012?
Queen Mary University of London
1
Contents
1.0 Abstract ... 2
2.0 Introduction ... 3
3.0 Literature Review ... 5
3.1 Welfare Dependency and the Need for Welfare Reform ... 5
3.2 Them and Us: The Skivers vs. Strivers Agenda ... 7
3.3 UC, the RSRS and the Benefit Cap ... 10
4.0 Methodology ... 13
5.0 Ethics ... 16
6.0 Findings and Discussion ... 18
6.1 Universal Credit ... 18
6.2 Removal of Spare Bedroom Subsidy and the Benefit Cap ... 26
7.0 Conclusions ... 40
2
1.0 Abstract
The Welfare Reform Act 2012 is the most radical restructure of the Welfare State by any
recent government, prompting far reaching changes to those who receive support from,
and those who administer the provisions. Beginning with a discussion of how the Act
moved from narrative to policy, we see how political actors and the media ushered in the
idea that the Welfare State must change. In order to measure the success of the Reform, I
have chosen to evaluate three of its core changes: Universal Credit, the Removal of the
Spare Room Subsidy, and the Benefit Cap. My reasoning for this in part due to my own
employment experience in benefit services, wherein I work closely in the delivery of these
particular changes. Using a multi-method approach, several successes can be observed,
including higher employment levels – a governmental success. Conversely, several failures
in the design and implementation of the Act must be addressed as the Reform continues.
To conclude, this study will assess the best way to manage the continued implementation
of the Act, with an emphasis on the promotion of integration and co-operation: with
3
2.0 Introduction
The Welfare Reform Act 2012 (see Parliament, 2012a) was enacted in March 2012,
paving the way for an extensive programme of welfare reform under the then Coalition
Government. It is anticipated that the Act is vital in achieving £18bn in savings in the
welfare budget and it has suggested there may be £10bn more to come
(Williams, 2012: foreword). As a result, it is integral in the larger austerity programme and
forms part of a wider set of reforms aiming to get the deficit under control, steady the
national debt, and reform public services Gi , : . The programme was a response
to the global financial recession of 2008, he e the risk shift was further embedded with a
change in emphasis from the global dimension of the crisis and a much stronger narrative
and policy focus on local government and households, particularly those in receipt of
elfa e e efits Ke ett, : . Commentators on all sides of the political spectrum
agree that the Act represents one of the biggest shakeups of the welfare state by any
government (Gaffney, 2015; Cole, 2015; Taylor-Gooby, 2013).
The Welfare Reform Act (WRA) 2012 is expansive; making far reaching changes to
the provisions of the Welfare State. The main elements are:
1. The introduction of Universal Credit (UC)
2. A cap on the amount of benefit for working age claimants – the Benefit Cap 3. Changes to rules regarding under-occupancy for those in the social rented sector – Removal of the Spare Room Subsidy (RSRS).
4. The introduction of the Personal Independence Payment, to replace Disability Living Allowance
5. Introductio of a lai a t o it e t fo Jo seeke s Allowance 6. Harsher penalties for benefit fraud
(DWP, 2015a)
This thesis will focus on the first three elements, arguably the most controversial parts of
4 Welfare Reform Act 2012? In doing so, a model of best practice can be developed. This
model would prove useful for Local Authorities and other agencies trying to mitigate the
negative effects of the Act for claimants, and give forewarning to the Department for Work
and Pensions (DWP), Job Centre and Local Authority staff of what to avoid as they
5
3.0 Literature Review
3.1 Welfare Dependency and the Need for Welfare Reform
The WRA 2012 was a response to the 2008 global financial recession. Although
designed and implemented by the then Coalition government, the seeds were sown
earlier. As Cole (2015: 50) notes, the need for reform can be traced to a series of reports
and reviews undertaken by the preceding Labour Government between 2006 and
2008...the 2006 Green Paper, A New Deal for Welfare: empowering people to work [which] ade the ase fo elfa e efo o the asis that the u e t s ste sustai ed a ultu e
of welfare dependency. It is ofte asse ted, as Gaffney (2015: 44) states, that welfare
spending was on an unsustainable upward trajectory prior to the 2008 crash, overall
expenditure…had sho little st u tu al ha ge o e e e t de ades .
The Co se ati es a ifesto highlights the belief in this culture of State
dependency. The Reduce Welfare Dependency section proclaimed to do away with
La ou s failures, offe people ta geted, pe so alised help soo e a d
Give unemployed people a hand up, not a hand out. Unemployed people must be prepared to take up job offers...long-term benefit claimants who fail to find
o k ill e e ui ed to o k fo the dole o o u it o k
programmes…people who refuse to accept reasonable job offers could forfeit their benefits for up to three years. This will create a welfare system that is fair but firm (Conservatives, 2010: 17)
The Liberal Democrats (2010) focused on benefits needing to be fair and proclaimed the need to overhaul the failed system enshrined by Labour. Although their manifesto largely
focused on changes to pensions, the statement of ta geti g payments towards those who need them most e phasis i e, Li e al De o ats, : highlights this o ept of
welfare dependency; although not as overtly as the Conservatives. The Labour Party (2010)
6
successes, e.g. with tax credits. Ho e e , state e ts su h as those ho a o k ust do
so , tough hoi es o elfa e: ou efo s ill i ease fai ess a d o k i e ti es a d
ou goal is to ake espo si ilit the o e sto e of ou elfa e state...a d e ill
continue to crack do o those ho t to heat the e efit s ste (Labour Party, 2010:
5, 7, 20) all echo this concept of an unfair welfare system fostering dependency and fraud.
The Impact Assessments offer important insights into why the reforms are needed.
For the UC Impact Assessment (DWP, 2012a: 1), the fi st se te e states that elfa e
dependency has become a significant problem in Britain with a huge social and economic
ost , a d the arguing that the current system offers poor work incentives and that it
actuall hinders rather than helps millions of individuals on low incomes…For people often
reliant on benefits, the incentives to move into work or to increase earnings once in work
can be very low.Te s su h as elia t , elfa e depe de a d poo o k i e ti es
enforce the ideology of an existing welfare system that is oversubscribed and not fit for
purpose - welfare as a lifestyle choice rather than a lifeline. The Impact Assessment for the
Be efit Cap DWP, : asse ts that the state a o lo ge affo d to pa people
disproportionate amounts in benefit each week, sometimes in excess of what someone in
o k a take ho e i ages , the Cap meaning o kless households will no longer
e ei e o e i e efit tha the a e age age fo o ki g households . Welfare is
presented as too desirable and that it makes less financial sense to work than it does to be
on benefits. Therefore, the cycle of welfare dependency continues. Finally, the Impact
Assessment for the RSRS (DWP, 2012c: 1) argues that the reform will edu e Housing
Benefit expenditure; encourage mobility within the social rented sector; strengthen
7
on work incentives and further promotes this concept of fairness. Impact Assessments are
not just useful windows into the reasons behind each part of the reform; but they also
offer a starting framework on how they can be evaluated.
3.2 Them and Us: The Skivers vs. Strivers Agenda
Upon consideration of the prevailing narrative detailed above, it is perhaps
unsurprising that a perceived culture of welfare dependency has emerged; those who
choose a life on benefits and those who have to use them as a last resort. I Hills :
words:
It s ski e s agai st st i e s: disho est s ou ge s agai st ho est ta pa e s; families where three generations have never worked against hard-working families...It s the agai st us. We are always in work, pay our taxes and get nothing g from the state. They are a welfare-dependent underclass, pay nothing to the taxman and get everything from the state.
This was intensified during and after the financial recession. Nor is it unique to the UK, Hills
(2015: 3) attributing Mitt ‘o e s otio of this elfa e di isio as o e of the ajo
factors in his defeat at the 2012 presidential election. This division relies on the belief
welfare is edist i utio , taki g ta pa e s o e a d gi i g it to the poor, a d that a
large and growing part of the social security budget is spent on hand-outs to those who do
ot o k Hills, : . The Welfare State is seen as fostering dependency and
worklessness (see Shildrick et al., 2012, chapter 3) when it should be doing the opposite.
This narrative forms pa t of a le, as o iousl the a ious Go e e t epo ts,
proposals, policy changes and procedural adjustments have not been introduced into a
a uu , ith TV sho s su h asBenefits Street only promoting this culture further (Cole,
2015: 51). As the narrative of welfare dependency continues, so does the policy of trying
8
Coalition to pursue even riskier reforms, as they a e likel to be successful if voters are
also in a domain of losses or if the government is able to overcome the reform hostility of
the voters who consider themselves to be in a gai s do ai Ke s e ge , : .
These welfare reforms are part of the est u tu i g of al ost all state se i es Ta lo
-Gooby, 2013: 8), e ause supporters of more ambitious reform believe that millions of
pounds remain trapped within public sector organisations that could be released to
f o tli e se i es if state bureaucracy can be subverted (Burton, 2013: 2). Therefore, it is
not just the provision of the Welfare State that need reforming, it is the State entirely.
The media played a key role in promoting the mentality that the welfare state must reform. The Guardian Patte so , has a gued that efo is e essa , as to ha ge
behaviour – if you want, in fact, to give more people the chance of a future that's better
than a life on benefits – what you have to do, even though it's difficult, and even though it
so eti es see s u fai is to fi ou chaotic welfare system. Although less focused on the
notion of skivers vs. strivers, the piece promotes the ideas that the welfare system is
overly complicated and a lifestyle choice for some. An Editorial (The Guardian, 2013)
emphatically proclaims that u i e sal edit is a politi al hol g ail, cheaper for the state to operate, more responsive for the claimant and it's been in the pending tray of many an
a itious politi ia e phasis added . Welfare is not just an expense through what it
provides; the administration process itself is very costly as well. On the other side of the
political spectrum, Richard Littlejohn (2015), in The Daily Mail, declares that the system is just a series of box ticking, where people only have to do the bare minimum of job seeking
i o de to lai ge e ous elfa e a d that Iai Du a “ ith has ade g eat st ides i
9
s all Esse to as the skiving apital of B itai and quotes then Employment Minister
Chris Grayling: how much of a waste of human life the current system has been. Too
many people have been left languishi g o e efits fo too lo g . ‘epeatedl , this ski e
concept is reinforced; a drain on the State, undeserving of its provisions, lazily pursuing
their part of the deal while exploiting a system all too ready to help them. The point
addressed here and above is that the desire for welfare reform cuts across the political
spectrum, albeit how and why, is where the lines between Left and Right can be drawn.
The above examples within the popular UK media clearly demonstrate an agenda.
Age da setti g , ites Bi kla d : , is the p o ess hi h p o le s a d
alte ati e solutio s gai o lose pu li a d elite atte tio . He e, the p o le is elfa e
dependency, unfairness and worklessness, and the solution is the substantial overhaul of
the Welfare State. The former comes together and forms a olle tio of p o le s,
understanding of causes, symbols, solutions and other elements of public problems that
o e to the atte tio fo e e s of the pu li a d thei go e e tal offi ials
(Birkland 2007: 63). In the case of the Welfare Reform Act 2012, those officials would be
Ian Duncan Smith and Lord Freud (Parliament, 2012b). Returning to the medias role, those
politi al elites a d politi ia s ea t to edia ues to o u i ate ith ea h othe . I
advanced industrial democracies, media are part of politics, and they are the
marketplace/arena in which political ideas and proposals are launched, tested, scrutinized
a d o tested Walgrave and Van Aelst, 2006: 100). What the Guardian and Daily Mail
examples illustrated was the mentality that something must be done about the Welfare
State, how as a diffe e t uestio , ut so ethi g eeded to ha ge. Whe politi al
10
edia o e age is asso iated ith pu li opi io i id , the logi al o lusio to that
agenda would be the WRA 2012.
3.3 UC, the RSRS and the Benefit Cap
This thesis focuses on three elements of the WRA 2012: Universal Credit (UC),
Removal of the Spare Room Subsidy (RSRS) and the Benefit Cap. Arguably the three most
controversial aspects of WRA 2012, each radically alters not just what the Welfare State
can provide, but also how the State itself operates and provides its services.
UC aims to unify and replace six other means tested benefits including Tax Credits,
Housing Benefit (HB), Income- ased Jo seeke s Allo a e a d I o e Related
Employment and Support Allowance (Money Advice Service, 2015). By merging these into
a si gle o thl pa e t, it ill st e gthe o k i e ti es, edu e the u e of
benefits and the number of agencies that people have to interact with and smooth the
transition into work. This will make it easier for claimants to understand their entitlements
a d easie to ad i iste the s ste , thus lea i g less s ope fo f aud a d e o DWP,
2012a: 1). Perhaps the most substantive element of the Act, UC is going to affect both
service users and those who administer benefits.
The Benefit Cap wants to estrict the total amount of welfare a household can
receive, broadly to the level of the average take-ho e pa of o ki g households DWP,
2012b: 1). Essentially, the Cap will ensure that those on welfare receive no more than the
average of those whom are in employment. In doing so, the Government hopes it will
incentivise employment and make significant financial savings, both central themes of the
reform. The Cap only applies to those between ages 16 to 64, i.e. below pension age, and
11
single parents who have children living with them and £350 a week for single adults
without children (or children who do not live with them). Those with certain disability
benefits are also exempt from the cap (Gov.UK, 2016).
Finally, the RSRS - AKA the Bed oo Ta , a term coined by Lord Best (Brown,
2013) - is to bring the rules in line with those governing the p i ate e ted se to . This is i
order to contain growing Housing Benefit expenditure; encourage mobility within the
social rented sector; strengthen work-incentives and make better use of available social
housi g DWP, : . Agai , efo i g welfare provisions to promote work incentives
and make the system more equitable for those in public and private rented
accommodations. In other words, the intention is making things fair. There are two tapers, one of a 14% reduction in the eligible rent (i.e. the maximum benefit that can be paid) if
under-occupying by one person and a 25% reduction if under occupying by two or more
people (DWP, 2012c: 1).
I have chosen to focus on these aspects of the WRA 2012 not least because I work
closely on administering them, in my role as Assessment Officer at Lambeth Council.
Within this welfare delivery role, I assess entitlement to HB and Council Tax Support, the
former being central to many of the changes that the WRA 2012 has introduced. Some
scholars have described employees such as myself as street-level bureaucrats, agents of
elfa e depa t e ts, lo e ou ts, legal se i es offi es, a d othe age ies hose o ks
interact with and have wide discretion over the dispensation of benefits or the allocation
of pu li sa tio s Lipsk , : . I and my department are one of the most common
means by which citizens interact with the State. Some have argued that decisions we
12
pressures, effectively become the public policies e a out (ibid). In regards to that line of thinking, in writing this thesis I occupy a valuable niche. The evaluation of the decisions
others and myself make in the implementation of the WRA 2012 will lead to
recommendations on how best to implement the policy in future. I am essentially
evaluating my own decisions as well as those made by my colleagues, as part of the
grander pursuit of generating good Evidence Based Policy (see Sutcliffe and Court, 2005).
At its core, this thesis will examine the successes and failures of the design and
implementation of the WRA 2012. It will utilise a range of sources and data to analyse this,
both qualitative and quantitative to convincingly evaluate the Act. This study offers a
synthesis of existing research material, seeking out themes across case studies. Many of
the previous studies had a tendency to be isolated, particularly in geographical terms, but
have concurrent themes that should be discussed. As mentioned earlier, my employment
at Lambeth Council also enables personal insights – technical and practical – about how
the WRA 2012 is performing and my access to academic literature - which many of the
case studies analysed do not use – offers opportunities to combine knowledge that has
13
4.0 Methodology
This thesis utilised multi-method analysis, using both qualitative and quantitative
data where appropriate. It engaged i the p o ess of t ia gulatio ; the use of o e tha
one method or source of data in the study of social phenomenon so that findings may be
cross- he ked B a , : . The all fo studies to o i e ualitati e a d
quantitative data has increased recently, a esult of the p e ious pola isatio of
app oa hes a d the asso iated sho t o i gs , he e use s of i fo atio e e ofte
dissatisfied ith the ualit of data a d the esulti g a al ti al o lusio s Ma sla d et
al., 1999: 1). Multi-method approaches yield many benefits; a particularly intriguing one is
highlighted B a : , he e ulti-strategy research provides such a wealth
of data that researchers discover uses of the ensuing findings that they had not
a ti ipated . The data is so rich that new insights can be developed, ones that would not
have been available if only quantitative or qualitative methods were used. Jick (1979: 608)
suggests that t ia gulatio allo s esea he s to e o e o fide t of thei esults ,
which he o side s its g eatest st e gth, hile also sti ulati g the eatio of i e ti e
methods, new ways of capturing a problem to balance with conventional data-collection
ethods . T ia gulatio is ot pe fe t; diffi ulties ith epli atio a d the st uggle to give
both qualitative and quantitative methods significant attention are often further
confounded by time constraints (Jick, 1979: 609-610).
Much of the qualitative data in this study will be from case studies conducted by, or
in partnership with, Local Authorities. These will be supported by other case studies
conducted by think tanks and charities, as well as those in academic literature. The Local
Authorities span the breadth of the UK and include Northern Ireland (Gibb et al., 2013),
14
2015) and Haringey (Davies et al. 2013). Here, we will be engaging with the comparative
ethod outli ed Lijpha t . I easi g the u e of ases as u h as
possible...improves the chances of instituting at least some control, Lijpha t, : ,
while strengthening the ability to analyse how the WRA has been implemented and its
impact across a wide variety of contexts and time periods (Hopkin, 2010). There are limits,
however. Burnham et al. (2008) goes into these in great detail, however the most
important consideration here is the issue of value free interpretation. The values of both
the researcher and the political system being studied may cause the researcher to
misinterpret what is being considered. As previously stated, I am a street-level
bureaucrat working in benefits administration. I hold values that are tied to my role, my
political affiliation, and even where I live. This is inescapable, as it is for every other
political scientist, and they will have some degree of influence on the conclusions drawn.
The important task is to limit this influence, so as to maintain as much objectivity as
possible.
The quantitative analysis will primarily consist of statistical data from the DWP s
Stat-Xplore (DWP, 2016) and from Lambeth Council. Using quantitative data, we can
precisely measure and explain policy outcomes. It is particularly useful for analysing
financial impact; as monetary savings is one of the major aims of the WRA 2012. The
strengths of quantitative data and research are numerous, perhaps the most discussed is
that those ethods p o ide us ith a o je ti e f a e o k fo testi g a d alidati g
theo ies a d h potheses a out the o ld a ou d us O'D e and Bernauer, 2014: 63).
This is he e this stud s o je ti e ede tials a e i p o ed, aki g it o e diffi ult fo
15
important means of improving the validity of thei e pi i al i fe e es Du i g, :
113). However, there are limits to the usefulness of quantitative data analysis. What
O D e a d Be aue : o side to e the ost se ious eak esses fo
politi al s ie tists is the assu ptio that ua titati e esea h is o je ti e a d alue f ee .
Quantitative data might more objective than qualitative, but it can still reflect biases and values of the researcher and those studied. This is no reason to abandon them completely,
but is an important consideration when using them. The strengths and limits discussed
above are not exhaustive; they merely reflect some of the more common arguments given
16
5.0 Ethics
In my current employment at the London Borough of Lambeth Council (2016), I am at the
front-line of welfare delivery, where I assess the entitlement of HB and Council Tax
Support for Lambeth claimants. This gives me personal insight into how the Benefit Cap
and RSRS changes affect service users, enabling me to reflect on my experiences with the
areas of the WRA 2012 that I am more familiar with. However, some of these reflections
should be considered anecdotal, to support and explain the research provided by others.
My Local Authority has permitted me to do this and have also agreed to my request to do
basic quantitative analysis of the some of the benefits data we have about those claimants
whose benefit has been affected by the WRA 2012.
Ethical considerations must be discussed. Fortunately, there are existing guidelines
provided by the Economic and Social Research Council (ESRC, 2010) and the American
Political Science Association (APSA, 2012). The guidelines provided will shape how I
conduct my study and are key in making it, ethically speaking, secure. There are
considerations discussed by the American Political Science Association (APSA, 2012: 12, 27)
that are particularly relevant to this study:
12) [The researcher] is a citizen, and like other citizens, should be free to engage in political activities insofar as this can be done consistently with obligations as a teacher and scholar
34) Possible risk to human subjects is something that political scientists should take into account.
Point 34 will be easy to manage, as no primary research with service users will be taking
place. Data will either be analysed from case studies already provided or extrapolated and
anonymised from statistical data. All data is stored securely on encrypted flash drives and
17
unlikely that any of the data could be used to identify them specifically. Point 12 relates to
relationships with sponsors or funders. As stated, I work for Lambeth Council who have
agreed to support me and allow me to use data that I am currently privy to. They have
provided no direct monetary funding for this study, other than the monthly salary I receive
for my job. I cannot bring my employer into disrepute, but I can still give a balanced
evaluation of the WRA 2012. My own values may shape my interpretation of the data, but
this applies to every political scientist – like them, I do my utmost to minimise the impact
of them. It would be incredibly unlikely that this study would bring the council into
disrepute anyway, as although this may be a critical analysis of the implementation of the
18
6.0 Findings and Discussion
6.1 Universal Credit
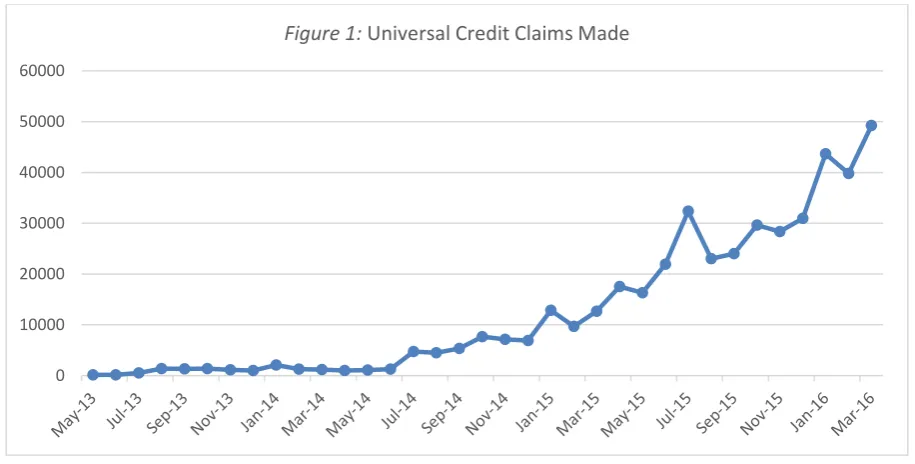
Figure 1 shows the claims made for UC. After an initially slow take-up, applications then begin to rise exponentially from July 2014. The low take-up at the beginning would
largely be due to the roll out being staggered around the UK as well as the eligibility rules
i.e. single claimants only. Early applications would have also been confounded by technical
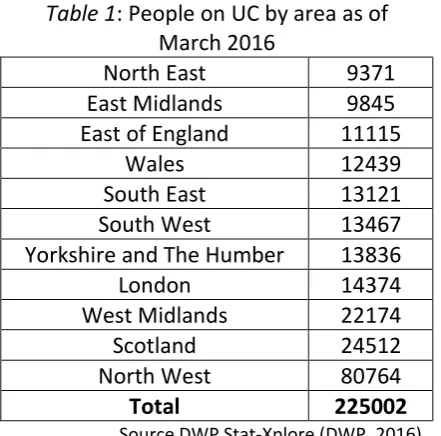
and administrative difficulties, as is the norm with reforms such as this. Table 1 shows the actual number of people on UC filtered by area. The North West being so high compared
to other Northern areas may be due to the fact that many of the initial UC trials took place
there. The North West has also suffered with difficulties in financial growth (Harari, 2016)
and its constituents have some of the lowest disposable income in the UK (ONS, 2015);
therefore, it is unsurprising that there are a substantial number of UC recipients there.
Overall, a success for the government; take-up has grown and UC would be making
administrative savings as a result.
Source DWP Stat-Xplore (DWP, 2016).
0 10000 20000 30000 40000 50000 60000
19
Yorkshire and The Humber 13836
London 14374
how it manages the digital divide. There is substantial evidence that certain groups are
o e likel to e digitall e luded a d the DWP eeds to sta t thi ki g a out h the e
is ot o e digital take up a o g so e g oups a d de elop lea pla s to ta kle this
(ibid). Gibb et al. (2014: 14) states that because UC has no paper claims, it puts p essu e
on the initial claims process, including the construction of the Claimant Commitment and
assessments of appropriate work-related requirements. It is likely that many groups will
find the online process difficult and rather than increasing take-up, this may reduce the
ha es of su essful lai s o a u ate assess e t . This issue was not lost on the Local
Government Association (2012), who warned that
20
unemployed, precisely the ones who could benefit most from information and services available online
What has been particularly concerning is how these changes will affect those who are the
most vulnerable and require the most support. Graham et al. (2015: 11) found in Scotland
that their respondents were actually more stable financially on UC, but the situation was
still precarious with UC negatively impacting their financial and emotional well-being: due
in part to financial instability, but also to negative or upsetting interactions with the system
i the ourse of applyi g for or lai i g e efits (emphasis mine). It is important to note
that this was a very small scale study, only analysing 30 households via longitudinal
semi-structured interviews. However, it does illustrate difficulties with the new system being
stressful fo lai a ts financial and emotional health.
Easton (2014) draws attention to the DWP quote, that UC p ese ts an opportunity to improve internet access for people who are currently digitally excluded as evidence that they are aware of and accept the problem. Easton o side s that e ause lo g te
sickness or disability was given as the most common reason, chosen by 52% of the
espo de ts, h a e ipie t as ot looki g fo o k , these ha ges i deli e ill
ha e a pa ti ula i pa t o disa led people . One may think that there is only one benefit
being integrated into UC that applies to those on long term sickness or disability:
Employment Support Allowance. However, a substantial number of those who receive
disability related benefits, also receive HB to meet their needs. There are a multitude of
reasons why some disabled people may struggle with this new IT only system, not least is
having the physical and financial means to access a computer, and an application process
that is not designed to accommodate a variety of different user needs (Easton, 2014).
21
highlights, the u e t situatio fo pu li se to e a essi ilit is di e. O l o e thi d of
Europe's 761,000 public sector and government websites are fully accessible, despite the
availability of technical solutions, some of which have been developed with EU research
fu di g o e the last ea s . It does ot eflect well on the implementation and design
of UC if those who need it most will struggle to actually get it. This needs to improve
significantly.
Perhaps the situation is not so bleak. A DWP (2013a) survey found some
encouraging esults f o the ea l pilots. O e all, % of lai a ts ag eed that: it as
easier to understand what was required for payments under UC than JSA; UC provided a
better financial incentive to work; and offered a better reward for small a ou ts of o k
(DWP, 2013a: 7). The survey focused on comparisons to JSA, therefore some of the more
vulnerable claimants who also receive DLA, ESA etc. were omitted: therefore, a more
promising result. Regarding those who claim online, 17% had someone supporting them.
In 81% this was a family member or friend, for 10% it was someone from the Jobcentre, for
4% it was a UC telephone adviser and for another 5% it came from elsewhere. While the
5% is a relatively small percentage now, it could nonetheless be crucial in the future.
Lambeth Council provides digital assistance volunteers when making claims for HB,
assisting those who struggle to use computers or have no home access to this technology.
This service has been very well received and it is my understanding that they will be
assisting residents with the switchover and application stages of UC. This is why integrated
support for users is so crucial, although Councils will not be administering UC directly; they
certainly can assist claimants with applying for it, provide budgeting advice and referrals
22
in the survey; however, that is concerning: % of lai a ts disagreed (emphasis mine) and 37% of claimants agreed that UC was a more convenient frequency of payment
o pa ed to J“A DWP, a: 7).
UC payments will be monthly and can only be paid to the applicant, not (usually)
their Housing Provider like HB can. It is precisely this change that led one interviewee to
state that i theo U i e sal C edit sou ds ok, ut all the ha ges s a e us rotten. There
is no guarantee that the system will work, and I think the transition to monthly payments
a d pa i g Housi g Be efit ill put us i to a ea s at fi st He de , : . Three pilots
conducted under the previous Labour government, testing direct payment to tenants,
found that rent collection dropped to 70% (Williams, 2012): a concerning trend for both
claimants and their Landlords. More recently, direct payment pilots by Wigan Council
(2014: 7) found a a e age olle tio ate of % a o gst people receiving direct
payments. This has a huge impact on collection rates and will require a further increase in
ou ad de t p o isio that has al ead ee i eased to £ . pe a u . This is
worrying as savings for the government in the administration of UC are being offset by
Local Authorities having to increase provisions for bad debt.
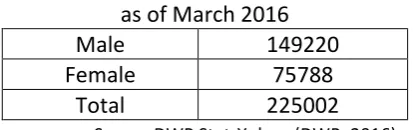
Table 2: Persons on UC filtered by Sex as of March 2016
Male 149220
Female 75788
Total 225002
Source DWP Stat-Xplore (DWP, 2016)
Table 2 shows that almost twice as many of the people whom UC is paid to are men; leading some to argue that changes to delivery will disproportionately affect women.
23
supported by research showing that male partners are more likely to be the main claimant
of core means-tested e efits i a household Ta a d Fi , : . This was
highlighted by the Welfare Reform Committee in Scotland (Watkins, 2013: 2), where it was stated that with UC only being paid to one person, usually male, it means women lose
thei i depe de e a d i o e. This esse tiall o e t ates fi a es a d po e i the
hands of one person and may result in resources not being shared equally. Money
p o ided to o e is o e likel to e spe t o hild e s eeds tha o e allo ated to
men; therefore, the move to a household benefit payment could reduce spending on
hild e . With the o e to monthly payments, this further exacerbates the situation as
o e i lo i o e households te d to e espo si le fo da -to-day budgeting and
any problems with the payment of Universal Credit or difficulties in monthly budgeting are
likely to fall to them i id . This is further o fou ded th ough the i orporation of
payments for children into UC will mean that child-related support will not necessarily be
transparent or paid to the main carer, leading to concerns that this assistance may be less
likel to ea h the hild e it is ea t to suppo t Ta and Finn, 2012: 8). Fortunately, UC
payments can be split between family members in some situations (DWP, 2015c), but this
is entirely discretionary on part of the DWP. The provision of split payments has not been
communicated effectively by the DWP or Local Authorities, which will need to be resolved
as the roll out continues. This indicates a substantial oversight in the design of the reform.
Although the government did not intentionally design the law to negatively affect women,
it was a potentially critical oversight and may have troubling unintended consequences as
the roll out continues. If anything, it will require cash strapped Local Authorities to review
what support services they can provide to women who are struggling because of changes
24
Where the implementation of UC has suffered the most is with IT issues. The IT
system developed for UC will rely on information collected by HMRC that will enable the
DWP to al ulate UC pa e ts ithout e ui i g lai a ts to suppl e plo e t or
pe sio i o e i fo atio …[The] DWP is confident that systems will be ready in time for
i ple e tatio , despite o e s a o g IT e pe ts that the ti eta le is u ealisti Ta
and Finn, 2012: 7). This new system is part of slashing the costs of benefit administration; a
system that does virtually everything automatically would reduce the administration
budget and allow staff to focus on more complex service user needs. The e a e o i g
past e a ples of su essi e go e e ts t a k e o ds o la ge-scale IT programmes and
major risks should be anticipated and avoided if service users are to be spared the
possi ilit of fi a ial ha dship aused pa e t dela s i id . This is a u fo tu ate
reminder for every government about their IT failures. One only needs to remember the NHS patient record system launched in 2002 that was eset ha gi g spe ifi atio s,
technical challenges and disputes with suppliers which left it years behind schedule and
over budget. In September 2011 ministers announced they would dismantle [the records
system], ith so e esti ates suggesti g the failed s ste ost £ (Syal, 2013). With
the ai of the W‘A aki g welfare expenditure savings of £18 billion a year by 2014
– Gi et al., : , a UC failure of a similar magnitude would be disastrous for the
Go e e t s fi a es a d credibility.
Gaffney (2015: 51) is unimpressed by the ill-timed schedule for UC roll-out; and
raises o e s o e the IT p o le s hi h ha e ede illed it a e i fa t resolvable. This
threatens the future of the programme, as its all-or-nothing implementation plan means
25
usi g a ual p o essi g of lai s is p ohi iti e . Gaff e s warnings are of false
e o o , de isio s ade i the a e of effi ie that e d up osti g o e tha the
sa e “to e, : . If the IT s ste eates a false e o o , the ai of aki g fi a ial
savings fails. It is partly because of these IT issues that the DWP had to e aluate its
ti eta le fo i ple e tatio . Fo e a ple, lega Housi g Be efit lai s ha e ee put
a k a ea a d ill ot egi to e t a sfe ed u til Ja ua “tephe s et al.,
2015: 13), while full roll-out has now been delayed until March 2022, instead of 2017 as
initially planned (BBC, 2016). These delays are concerning, particularly considering that
DWP has had to subsidise many local authorities, some estimating costs up to £41 million,
to hire temporary staff so that they can continue to provide HB until UC has been
implemented We ha , ited i “tephe s et al., : . Gaff e s a i gs
about a false economy may not be unfounded. Drawing an example from my own
experience, we had a service user on UC move from another borough to ours when UC was
not yet live. We had not prepared for this situation, as UC was not meant to go live in
Lambeth for several months. This is an issue that overlaps both IT systems and the
staggered roll out across the country. How we could assist the user in the meantime was
problematic, as we had not adapted our IT system to accommodate UC. Councils and the
DWP need to think about situations like this when designing the reform. Essentially, this
could be viewed as a failure of the policy at street bureaucrat level. While the fact that
Central Government did not consider the possibility of people needing support moving
26
6.2 Removal of Spare Bedroom Subsidy and the Benefit Cap
Figure 2 shows that since being introduced, the number of cases of the RSRS being applied has steadily been decreasing, with a net-decrease of approximately 94000 cases
over the period. This is a successful start to the implementation: the changes applied and
sa i gs i the elfa e ill ealised; a positi e out o e fo the Go e e t. La eth s o
data showed that on 18/04/2016, an average of £22.62 of benefit was lost with a standard
deviation of £8.31, higher than the UK average. Unfortunately, the DWP data provides
little further insight beyond this, so it is difficult to understand why it has been decreasing. Possible explanations include:
1. Claimants have downsized properties
2. Changes in the composition of the household, such as a child turning ten ea s old
3. Claimants may have stopped claiming HB altogether because they have started work
Source DWP Stat-Xplore (DWP, 2016).
The above list is not exhaustive, but it highlights the limits of the DWP data. Reasons 1 and
3 are arguably the principle aim of the RSRS, but without further data it would be
13.80
Figure 2: Cases of Under-Occupancy and Benefit Loss
27
impossible to confirm this. Interestingly, as the number of cases of the RSRS decrease, the
average amount of HB lost increases. Over the entire period, the average amount of
benefit lost increased by 0.62p, with £15.27 average benefit lost as of November 2015.
There are a number of possible reasons for this, e.g. those who have lost a higher amount
of benefit may find it difficult to budget for a move to a smaller property, therefore pulling
the average higher vs. those who lost a smaller amount and could budget to move more
easily. Again, without further insights from the data, this is conjecture.
In a DWP study, Clarke et al. (2015) made several observations that reflect well on
the implementation of the RSRS. 17% of claimants surveyed in autumn 2013 were no
longer affected by summer 2014, with finding work or increasing earnings, having a
relative or friend move into the property, or their children getting older being some of the
most common reasons. Finding work and increasing earnings have had a particularly
positive effect and the Government should be proud of that. La eth s o data sho ed
that 1336 applicants affected by the RSRS gained employment in the period of January
2015 to April 2016. The la dlo d su e suggests that atio all a ou d , ‘“‘“
-affected claimants had downsized within the social sector by autumn 2014, as compared
ith a ou d , i autu Cla ke et al., : . A study by Ipsos (2014: 5)
supports this, finding that % of of te a ts o lo ge affe ted [ the RSRS] have
do sized to a othe so ial p ope t ia a t a sfe o utual e ha ge , hile othe
reasons for it no longer applying include claimants increasing their income enough to no
longer needing benefits. Implementing a system to make it easier for tenants to complete
mutual exchanges would certainly aid this further. From this evidence, the RSRS is
28
downsize. This may lead to people over-occupying being able to move into those larger
properties, therefore reducing overcrowding. Finally, there is no distinct increase in the
number of evictions due to the RSRS in autumn 2014. Although some landlords had made
a possession order on 5% of RSRS affe ted te a ies…less tha a te th of this u e
ha e a tuall ee e i ted… ase suggested ost e i tio s No e e had ee of
tenants with pre-existing arrears and/or who had not engaged with their landlord (Clarke
et al., 2015: 20). These figures show that the negative impacts of the RSRS are not as
dramatic as originally envisaged and to blame evictions solely on it would be
unsubstantiated.
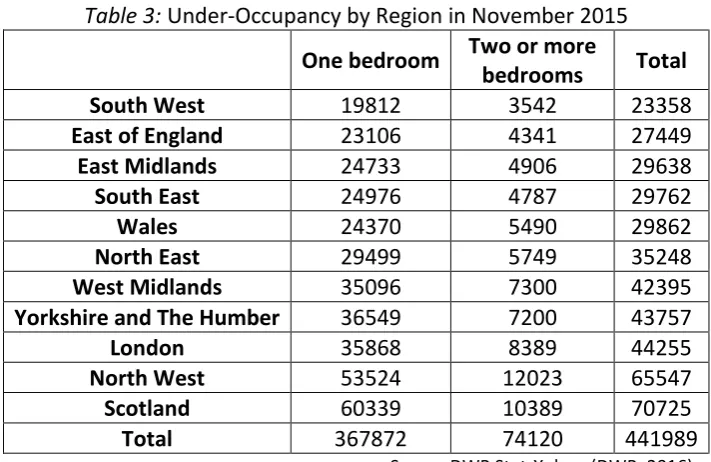
Table 3 shows that the further north the location - with the exception of London - the higher the number of those affected by the RSRS. Scotland being particularly high may
be partly due to how its cases are counted (the whole country vs. individual regions).
La eth s o data i o ed the DWP data i that the ajo it of those affe ted e e
only under-occupying by one room. A study in Merseyside, one of the poorest areas in the
country due to low GDP and a high rate of unemployment (Sefton Council, 2013), by the
Table 3: Under-Occupancy by Region in November 2015
One bedroom Two or more
Yorkshire and The Humber 36549 7200 43757
London 35868 8389 44255
North West 53524 12023 65547
Scotland 60339 10389 70725
Total 367872 74120 441989
29
NHF (2013), examined the RSRS. It found that just 155 of the 26446 households affected
downsized - less than 1%. Not an encouraging result. Since the RSRS was introduced, many
Merseyside Housing Associations have recorded a substantial rise in use of food banks to
help meet day-to-day needs (ibid). Caplan (2016: 8), observed this in their exploration of
Trussel Truststatisti s, fi di g that a major reason for using a food bank has been cuts to benefits i ludi g the RSRS, the benefit cap, and benefit sa tio s hi h a e the tactics
currently being used to discourage the so- alled depe de ultu e a d ake o k
pa . It would be difficult to describe the consequences of the RSRS such as these as a
success.
One Merseyside resident, Mary, 59 lives with her son and is under-occupying by
one bedroom, requiring her to pay a shortfall of £50.60 per month. She has long-term
health conditions, so is reluctant to move because her neighbours provide her with care
a d suppo t. “he has had no choice but to sell the jewellery her late mother bought her as
i thda gifts. Whe the je elle is go e she ill ha e o a of pa i g the ed oo ta
(NHF, 2013: 4). Another Merseyside resident, Teresa, 61, has her young granddaughter
staying over many nights in the week because her daughter works at night. If Teresa did
not provide this, her daughter would be unable to work and would most likely have to
claim benefits instead. Teresa is considered to be under-occupying by one bedroom. She
does not work and finds it difficult to meet the almost £100 per month shortfall in her rent
due to the RSRS. When she qualifies in January 2015 for pension credit, she will be exempt.
Howeve , u til the she has to so eho fi d the e t a o e , o do size – but this
would mean her granddaughter would have nowhere to sleep and her daughter would
30
to ask if these are truly reflective of the experience of most of those affected. Nonetheless,
they raise concerns over the negative impact of the RSRS and its effects on claimant
wellbeing. More discussion or discretion is needed about how much of a week someone
has to reside somewhere for them to be considered to be occupying that spa e room.
In a survey of 452 English Housing Association tenants that were under-occupying,
Burkitt (in Gibb, et al. 2013) found that only 7% of them would be willing to downsize.
Herden et al. (2015: 28) had a disabled respondent suggest that him and his partner are
pa i g a ta o disa ilit , as he a ot sleep i the sa e oo as his wife due to the
equipment he needs keeping her awake at night. The impact of the RSRS on those who are
disabled and vulnerable is definitely a cause for concern. Barnes et al. (2016: 4) observed
the particularly distressing finding that the RSRS, as ell as othe e efit ha ges, led to
increasing despair and self-ha . A state e t f o , Je , 56, is particularly alarming:
I e ee o ied si k si e Ja ua … What s goi g to happe to hus a d if I a t look afte hi [sta ts i g] a d the e s this thi g a d it s this thi g
ith the ed oo ta that is utti g e to the o e… I a holeheartedly
sa it s defi itel the situatio ith the ed oo ta that pushed e o e the edge [to self-harm].
The reform affecting those who are already vulnerable and or disabled to consider
self-harm or even try to commit suicide is obviously not an intended consequence of the WRA
2012, nor particularly widespread, but it raises serious questions about its impact on the
wellbeing of its most vulnerable recipients. If those affected are unable or unwilling to
downsize still, the RSRS has failed as it would not be achieving one of its main aims.
Wiga Cou il : fou d that Ma h , a ea s f o the , u de
occupation households was £381k with £225k solely attributable to the under occupation
31
observed that all pa ti ipa ts [affe ted the RSRS] reported significantly reducing
spending on household essentials, particularly food and utility bills, in an attempt to avoid
falli g i to e t a ea s . Data from Ipsos (2014: 5) supports this, estimating that 64% of
Housing Association tenants affected by the RSRS i a ea s a e i a ea s due to a failure
to pa the size ite ia sho tfall, o pa ed to a esti ated % i autu .
Increasing rent arrears will, for some, inevitably lead to legal action and evictions taken
against tenants. This is very costly for Housing Providers to manage and may end up
costing them more than the money they saved by reducing tenant benefit awards.
Concerns about a false economy are raised again. What could be a particularly disastrous
result is if some of those evicted tenants are moved to costly temporary accommodation
thei lo al autho ities, the ill fo hi h i Lo do fo / ost close to £663m.
The level of expenditure met by London boroughs specifically from their own general
funds can be estimated at…£ ‘ugg, : ii . Having to move more people into
Temporary Accommodation is the last things Local Authorities and the Government want.
Table 4: Discretionary Housing Payments for Benefit Cap recipients in Great Britain, April 2015 to September 2015
Table 5: Discretionary Housing Payments for Benefit Cap recipients Lambeth, 01.10.2015 to 31.03.2016
Amount Spent (£)
Number of Awards Average award (£)
Benefit Cap 157210.79 124 1267.83
32
Tables 4 and 5 shows the Discretionary Housing Payment (DHP) awards, from April 2015 to September 2015 for Great Britain and October 2015 to the end of the financial
year in March for Lambeth, paid to those affected by the RSRS and Benefit Cap. Lambeth
Council is just one of many who award this payment. The award is usually continuous, paid
over a number of weeks, although the length and amount of the award given varies.
Lambeth, for example, typically pays it for 13 weeks. DHPs p o ide e t a o e he
your council decides that you need extra help to eet ou housi g osts, such as
o e i g housi g osts due to a edu tio i ou Housi g Be efit afte the e o al of the
spa e oo su sid i so ial housi g DWP, : . On a positive note, then, Wigan
Council (2014: 7) paid £450k DHP to those affected by the WRA 2012, the RSRS included,
hi h has o side a l assisted i a agi g the i pa ts of the efo s . Li e pool
Mutual Ho es suppo ted a -year-old woman who had fallen into debt with loan sharks
and was facing further debt because of the ed oo ta th ough helpi g he to appl fo
DHP (NHF, 2013: 8). DHPs are being used for their intended purposes then and are helping
to temporarily mitigate the consequences of the RSRS, making the transition easier for
service users. One should note that the amount spent and amount allocated for the
Benefit Cap is much lower than the RSRS. However, the Lambeth data shows that the
amount given in the awards is over three times as much as what is given for the RSRS
recipients. This would reflect that although less people are actually affected by the Benefit
Cap, the amount of benefit lost because of it is more substantial than the RSRS.
Regardless, DHP is being used successfully and is therefore helping to make the transition
easier for service users. The data also details some of the reasons for its allocation. The
33
raises questions about whether enough claimants are doing as the reform hopes and
moving to smaller and or cheaper accommodation. Without further insights from the data,
one can only hope that the DHP is being successfully used for its intended purposes as well
as it can be. The question one has to ask then is, are savings really being made? The savings made by reducing HB are to some extent offset by the administration and
provision of DHPs. Although DHPs are a temporary award, it brings into question just how
much net-savings the RSRS and Benefit Cap is actually delivering fo the Go e e t s
welfare bill.
The most embarrassing event for the Government is what became known as the
Bed oo Ta Loophole . Discovered by Peter Barker, a housing policy consultant, the
loophole ea t that up to , housi g e efit lai a ts a lai o e a k .
Esse tiall , those ho ha e o upied the sa e p ope t o ti uousl a d take housi g
e efit fo it si e should e e ha e ee i luded i the poli … he the
Department for Work and Pensions drafted the controversial legislation it did not update
housi g e efit egulatio s dati g f o that ea Duga , . This loophole led Labour
MP Ch is B a t to state this is the latest e a ple of the haos a d o fusio ithi the
Department of Work and Pensions under Iain Duncan Smith. Rather than closing loopholes
in the policy, the government should scrap their hated bedroom tax" (quoted in Butler et
al., 2014). Not confident words from a fellow MP. For Wigan Council (2014: 7) the loophole
a d su se ue t pa e ts to te a ts ho should ha e ee e e pt from the Under
O upatio Cha ge £ k …considerably assisted in managing the impacts of the
efo s . Although those numbers could be considered small, it would have been a similar
34
Go e e t is that those ho e ei ed DHP to help o e the ‘“‘“ sho tfall ill ha e
their housing benefit refunded, but will not be obliged to repay the DHP cash, which may
esult i so e a tuall gai i g hu d eds of pou ds i ash Butler et al., 2014). A false
economy if there ever was one, as essentially more has been paid to some claimants than
they would have received if the RSRS was not introduced. Camden Council Cabinet
Member Theo Blackwell (quoted in Butler et al.,2014), stated that it is a ad i ist ati e
nightmare as we have to find those continuously in receipt of housing benefit going back
18 years, when we – like most councils – have changed systems largely from a paper-based
o e to e IT s ste s . Be efit staff had to spend substantial amounts of time identifying
people eligible and refunding them, time which could have been better spent working on
more pressing tasks. Overall, the loophole is evidence of a failure in the design of the RSRS;
this oversight has actually cost the Government financially as well as affecting the
credibility of the reform.
Figure 3: Number of Households Capped vs. Amount of Benefit Lost per Week
Up to £25 £25.01 to £50 £50.01 to £75 £75.01 to £100
£100.01 to £150 £150.01 to £200 £250.01 to £300 £200.01 to £250
35
Figure 3 shows the number of households capped per month. After a similar start to UC, the number of households capped rises dramatically in September 2013 and
continues to increase until December 2013, after which it gradually decreases. The initially
low number of cases between May 2013 and August 2013 are most likely due to the
staggered nature of the roll out as well (Robertson, 2013) as Local Authorities and Job
Centres getting to grips with the changes. I can personally vouch for the latter; our systems
experienced difficulty adjusting, as well as having to train staff up on the new rules and
enforcement. Nearly half those affected are those in the up to £25 and £25.01 to £50
bands, so the lower end of the spectrum. As the amount of benefits lost per band
increases, with the exception of £100.01 to £150, the number of those affected within
those bands decreases. La eth s o data showed that as on 18/04/16, an average of
£58.34 per week was lost with a standard deviation of £55.87; indicating substantial
variation. Claims that were capped but had no loss of benefit were removed when
calculating that figure. Overall, this is a positive outcome for the Go e e t s
implementation of the Benefit Cap. With so many households capped, particularly at its
highest in December 2013, the Government would definitely be making fiscal savings, one
of the main aims of the Benefit Cap. The decrease in cases from January 2014 onwards
may also be cause for celebration, as part of the legislation stipulates that you are or will
e o e e e pt f o the e efit ap if a o e i ou household ualifies for Working
Ta C edit Go .UK, . For Working Tax Credits, one must be in paid employment and
working for a certain number of hours per week. If those who are capped move into
employment, they may qualify for Working Tax Credits and therefore exempt themselves
from the Cap. This would mean that the Benefit Cap has been achieving another of its
36
Again, this is something I have personally experienced in my line of work on several
occasions – removing the benefit cap from claimants after they moved into paid
employment. La eth s o data sho s that o l of claimants affected by the
benefit cap between January 2015 to April 2016 gained employment. Not exactly a
substantial figure, but it does show the Cap may encourage people into work. It should be
noted that the Lambeth data is incomplete, so the 29 figure could be much higher.
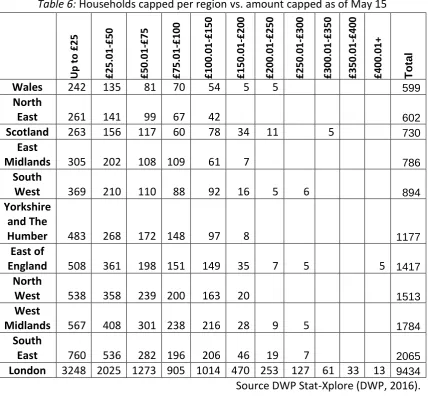
Table 6: Households capped per region vs. amount capped as of May 15
Table 6 shows a break in the pattern we saw earlier with UC: the further North you move; the more people were affected. With the Benefit Cap it is the opposite: the further
37
affected. Nearly 45% of those capped are in London alone, almost 55% if we include those
in the South East too. There are two overlapping reasons for this:
1. London has the most expensive private rented accommodation in the country and those rents have been rising fast Lo do Asse l , ; O Ca ol, 2015; HomeLet 2016; ONS, 2016)
2. The general cost of living in London is much higher than it in the rest of the country (Medland, 2011; Overman and Gibbons, 2011; ONS, 2013)
These two factors will lead to a higher number of people needing more welfare support;
this is particularly true for HB and Tax Credits, as many in London cannot afford private
rents and or to support their families without the extra support these provide. As a result,
it is unsurprising that there were a much higher number of people receiving more than
£350/£500 (dependant on household type) a week in benefits. This is not an oversight on
the part of the Government; however, it does require London Councils, Jobcentres and
charities considering innovative ways to help manage this transition for service users.
Many Local Councils, including my own, implement the Benefit Cap after receiving
data f o the DWP that the appli a ts e efit has ee apped a d ho u h the e
receiving in other relevant benefits, giving a total figure. Their eligibility for HB is then
calculated, and will be added to what is left in their Cap. The HB figure is essentially
calculated last, covering the difference between what they receive in other benefits and
the amount they are capped by. The HB cannot exceed their Cap. The Government sees
this as an opportunity to encourage HB recipients to move into cheaper accommodation,
in the hope that the HB award will be able to meet their needs while not exceeding the
amount their benefit is capped. The problem here, as research in Hackney (Williams, 2012:
22) found only 14 landlords from a search of 1585 properties who were willing to take on
38
many private housing providers are refusing to let properties to those affected by the Cap,
the efo e u de i i g the go e e t s poli of e ou agi g lo al autho ities to pla e
homeless households in the private rented sector (PRS) and to prioritise households in
e plo e t fo so ial housi g Da ies et al., : . If Landlords are not willing to
accept those on benefits, particularly those who are in the more precarious situation of
having theirs capped, then tenants will have to resort to whatever is available to them. A
similar sentiment is echoed from Mrs Jones, a lone parent in North London, whose benefit
was capped in July 2013 reducing her benefit from £605.80 to £500 per week. She had no
ea s to eet the shortfall and is sure that her landlord will try and evict her. She has
looked at alternative accommodation but has not seen anything within travelling distance
of he hild e s s hool ith a e t elo £ a eek Fa thi g, : .
The Cap a ea so e fa ilies ha e to o e ho e, dis upti g hild e s
edu atio a d e isti g so ial a d o u it et o ks Ge tle a i La Pla a a d
Corlyon, 2015: 12), therefore damaging communal systems and increasing social exclusion.
This false belief that there is enough cheap accommodation to meet these needs is an
oversight in the design of the Cap. The Government certainly would not want those
capped to move into the costly Temporary Accommodation market. It is this fear that led
Rugg (2016: 14) to call fo a e e ptio f o the Be efit Cap fo Te po a
A o odatio ases hi h ould edu e osts fo Lo do o oughs, ut o l affe ts a
minority of households in TA . This would at least make things more manageable for those
who have to move into Temporary Accommodation, e.g. those fleeing domestic violence.
Davies et al. (2016: 6) made a similar observation, noting the austere consequences for
39
exacerbation of mental health problems, women left unable to flee abusive partners,
children in danger of being taken into care, and pre-emptive evictions of some private
te a ts . Mitigating barriers to those whom are already vulnerable requires innovative
support from charities and Councils. Thankfully, the Benefit Cap was revised to make
40
7.0 Conclusions
Overall, the design and implementation of the Welfare Reform Act 2012 has seen a
mixture of successes and failures. In my employment for Lambeth Council, I have been
able to observe this first hand.
The WRA 2012 was a response to the 2008 financial recession, whose seeds were
sown by Labour and then implemented by the following Conservative and Liberal
Democrat Coalition government. Their manifestos evidenced a narrative that the Welfare
State must be reformed, how and why it needed to change was where conflict would arise.
The Impact Assessments further reinforced the narrative of welfare dependency being a
substantial problem, and the need for savings to be made ever more crucial. From this
rose the Skivers vs. Strivers Agenda, those who are seen to take unfair advantage over the
current system, while not giving anything back to society; benefits are a lifestyle choice
rather than a safety net. This forms a cycle of accusations of welfare dependency and
demands for reform, resulting in the proposal of yet more radical changes. The media only
exacerbated the narrative that the Welfare State must reform. This all supported the
arguments made by agenda setting theorists and how the narrative was promoted through
all channels in order to increase demand for change. I decided the most appropriate way
for me to evaluate the WRA 2012 would be through examining Universal Credit, The
Benefit Cap and changes to the Removal of the Spare Bedroom Subsidy; this is because I
work in benefits administration for Lambeth Council as a st eet-level bureauc at .
For UC, it was a good idea with some encouraging numbers during the initial
41
changes to delivery have made it problematic for vulnerable users. With a wide digital
divide still in effect, the decision to make the application process for UC online or
telephone only means some people will struggle to get the support they need, increasing
stresses on lai a ts finances and wellbeing. Disabled people are some of the most likely
to affected by this change, therefore it is an absolute necessity that Councils, Job Centres
and charities provide support to disabled service users in order to help them claim. Some
users did not find the application situation so bleak and were able to engage support from
their family and friends. Ensuring the application process is as user-friendly as possible and
allowing family and friends to support applications therefore must remain. Moving away
from paying benefit directly to the Landlord has seen arrears increase and it is only in
much rarer cases that it can be paid to them. These rules could be relaxed; mirroring the
same rules that apply to Housing Benefit payments could make it easier to control tenant
arrears for Landlords. With monthly payments now only made to one person in the
household, usually the male, has led to many women losing some of their financial
independence. Ways to resolve this would be better communication about alternative UC
payments, as it does have provisions for bi-monthly awards, split payments etc., ensuring
financial autonomy for women and making day-to-day budgeting easier. What has been
the most critical failure for UC are the extensive IT problems it has experienced since its
inception. The desire for a fully automated online only system has led to implementation
dates being constantly pushed back, and users not being able to apply for the support
required. In some cases, this even led to payments being made to councils so they could
employ temporary staff to cover their administration until the UC switchover. Concerns
over a false economy arising are not unsubstantiated. It is obviously too far into
42
that their systems are working correctly and they have the appropriately trained staff to
administer it before it goes live in their area. Rushing into it will only increase costs long
term.
In the case of the RSRS, I have observed that the number of people affected has
been slowly decreasing since its inception, while the amount of benefit lost has increased
slightly. Again, this is a largely successful application, with definite savings for the welfare
bill being made. Reasons for the decreased number of applications were varied, but some
of them reflected well on the RSRS. Factors included finding work or claimants downsizing
their properties, two of the principal aims of the RSRS. I observed a geographical pattern
with the RSRS, it being more prevalent the further North in the country you go. This
coincided with a worrying rise in Food Bank use in the North of England. Notable cases
such as where a disabled user could not move because they relied on support from their
neighbours, while a second required the extra room for their frequently visiting
granddaughter. For the former, it may be easier to amend the regulations such as
automatically exempting claimants from the RSRS if they or their partner are receiving the
care component at any rate of Disability Living Allowance/Personal Independence
Payments. This would make things easier administratively, as the assessors would have to
spend less time determining if the spare room fits the requirements under the current
regulation. The RSRS saw a rise in arrears for many Housing Providers, which would
inevitably lead to costly eviction processes. The only way to resolve this is to make sure
tenants are aware of all the support available to them, such as DHP, in order to maximise
their income and help reduce arrears. Again, this is where co-ope atio et ee Cou il s,
43
advice. We saw successful provision of DHP already for the RSRS and the Benefit Cap,
although it does raise questions about how much net-savings are being made. Awareness
of the pa e ts eeds to e i eased a d it a e useful fo Cou ils to discuss jointly
how much and when it is paid, thereby unifying the system further. Finally, we discussed
the most embarrassing failure in the design of the RSRS –the Bed oo Ta Loophole ,
which led to more benefits and payments being paid out to some recipients than would
have been received if the RSRS was not in place. This, combined with the substantial
amount of administrative work needed to resolve it, proved a financial failure for the
Government – one that cannot be repeated.
For the Benefit Cap, it began slowly, followed by a substantial increase and then a
slow decrease over the period since its implementation. Again, this is a promising start for
the Government, with actual savings in the welfare bill being made. We observed another
geographical pattern, whereby the numbers affected by the Benefit Cap increased the
further south you moved down the country. London had almost half the number of people
affected, partly due to private rents being substantially more expensive and the general
higher cost of living compared to the rest of the country. This will necessitate Councils and
charities needing to provide support specifically tailored to London residents, as many
more stand to lose benefits there compared to the rest of the country. It is difficult for the
Benefit Cap to encourage recipients to move into cheaper accommodation when Landlords
refuse to accept people affected by it. Finding cheaper accommodation is challenging,
particularly for those who are already established in the area and have children attending
local schools. The general lack of affordable accommodation only exacerbates this issue.