AN INFORMATION SYSTEM SUCCESS MODEL FOR CLOUD
COMPUTING IN INFORMATION TECHNOLOGY PROJECT
Zulfan
Informatics, Mathematics and Sciences, Syiah Kuala University, Indonesia E-mail: [email protected]
Abstract
Cloud computing is becoming an attractive technology due to its dynamic scalability and effective usage of the resources, it can be utilized under circumstances where the availability of resources is limited. The main aim of this study is to develop an IS successful model for cloud computing in IT project environment. There were 38 respondents participated in this study. Data were collected by surveys and analyzed by SPSS. The findings of the study revealed that the system under study was quite successful on use of cloud computing in IT project assignment and very useful. In addition to all hypotheses in this study were interrelated.
Keywords: cloud computing, Google apps, IT project, IS success
1. Introduction
The development of Information Technology (IT) is currently head to the concepts of social networking, openness, share, collaborations, mobile, easy maintenance, one click, scalability, concurrency, distribution and transparent. Cloud Computing emerging as a service to allow users or companies to perform electronic access to information. Access data from anywhere and use fixed or mobile device using the internet cloud as a place to store data, and other applications can easily retrieve data, download applications and migrate to another cloud, this will provide many benefits both the service providers or from the user side. One example of cloud computing is Google Apps.
Google Apps could be used efficiently for academic tasks such as writing essays and class scheduling. A group of students can work together on an assignment in Google Docs. It allows students to create and edit document online while collaboration in real -time among them. Students could see exactly their schedule of consultation with their lecturer and among them with Google Calendar. It allows creating a schedule and stored it online. Furthermore the documents can be viewed anywhere and anytime as long as we are connected to the internet. With Google Calendar, the student also enables collaboration and sharing of schedules between groups [1].
Google Apps also suitable to be implemented for a group of students to do IT project assignment. They are able to create and edit of their report together online in real-time, and the lecturer also could check it in the same time. With Using Google Apps, they are able to create of their schedule and save it online.
Cyberspace: Jurnal Pendidikan Teknologi Informasi | 19 system a quick response. One reason is their model is a simple model but is considered quite valid [6].
ii. to construct a model that assist successful model that support the successful of cloud computing in IT project environment.
iii. to generate and validate the model that support the successful of cloud computing in IT project environment.
Research Question
The research questions in this study were formulated and are stated below:
i. what are the factors that support the successful of cloud computing in IT project environment?
location thru of internet network. The word "Cloud" itself refers to a cloud symbol in the world of IT is used to describe the Internet[9], [11], [12].
Google Apps
Google Apps is a collection of web-based service is provided by Google that has a function to the needs of businesses, schools, government agencies, and other organizations of any size. Google apps is a type of technology called a "software-as-a-service" or "cloud computing" where Google Apps is provided as a service, and allows users to access these applications from the Internet ("in the cloud") without need to provide infrastructure to support the service [1], [13]. One example service of Google Apps is Google Doc. Google Docs provides a web-based tool for creating and collaborate on documents, spreadsheets, and presentations. A user can create a document from a web browser or uploading documents from other systems are supported, and can share documents with other users to work and edit together.
Success of Information Systems
Process implementation of information system is expected to function effectively. The effectiveness also indicates that he information system development be successful. However, to described the success of the system is difficult the use of cost-benefit analysis cannot be done perfectly because not all benefits can be quantified[14]. In many research [15–21], the success of information systems is proxied by user satisfaction.
However,[22]use of user satisfaction for as a proxy will not mean a lot when the system does not lead to increased individual and organizational performance. Therefore, [14] determine the 5 variables to measure the success of information systems. Those variables are high level of system use, user satisfaction on system, favorable attitude of user toward those systems, achieved objectives of information system, and financial payoff.
Therefore, DeLone and McLean have updated their model to describe the success of information systems. They have included service quality and net benefits. This model known as updated D&M IS success model [23].
Information Systems Success Model (2003)
Good model is a model of a complete but simple. In 2003, DeLone and McLean have updated a model for information system and they call updated D&M IS success model (see Figure 1). The purpose of this model is to be a framework for measuring different dependent variables in IS research [6], [24], [25].
Cyberspace: Jurnal Pendidikan Teknologi Informasi | 21 Figure 1. Updated IS Succes Model [23]
System Quality. System quality is characteristics desired of the information system
which aims as production information for used by its users and decision maker [6].While based [18] explained that system quality relate with issues such as system bugs, user interface, ease of use, and maintenance of program codes. Definition of the system quality according to[28] is the performance of IS in terms of reliability, convenience, ease of use, functionality, and other system metrics. System quality also defined as perception of a system's performance that measured of availability the hardware to and the various software applications designed to users[3].
Information Quality. The traditional definition of information quality refers measures of system output that is produced in the form of report. Characteristics of the measure of such as accuracy, precision, currency, reliability, completeness, conciseness, relevance, understandability, meaningfulness, timeliness, comparability and format [29].
Service Quality. Dimensions of service quality is new in the update DeLone and
McLean IS success model and included by many researchers as measure of IS success. According [23], service quality is the extent to which services meet customer expectations.
Use. There is no precise definition of the system use at any level. However in many cases, dimension of use is a suitable to measure success. Use also can defined as the degree and manner in which user utilize the capabilities of information system [23], [28].
User Satisfaction. User satisfaction is considered as the most common measure of IS success and also consider it as an important means of measuring user opinions [18], [23]. According to [5], user satisfaction covers the user opinion on the whole system. Covers consumer satisfaction across the system user opinions. Some elements such as system quality, information quality and service quality dimension very important to be consider to measure user satisfaction. It is important to measure the difference in the expected and perceived information quality or services are given by the system.
Net Benefits. Like mentioned previously, the net benefits are a dimension was
Hypotheses
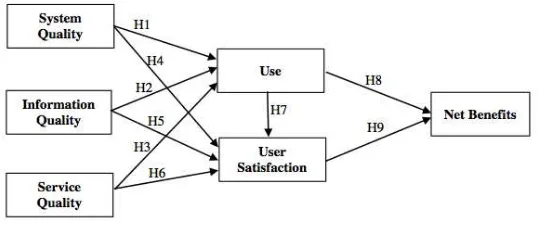
The main purpose of this research study is to apply and test the updated D&M model of IS success in the context of cloud computing success in information technology project. Thus, the researchers have adopted the model (Figure 2) to fit into the cloud computing for IT project context that is Google Apps in this case. According to [30], the systems success or its measurements can vary with organization characteristics. Therefore, the model should be modified according to the context of the targeted.
Figure 2. IS Succes Model Adoption
To test the applicability of the updated D&M IS success model and the relations between its constructs, in the cloud computing for IT project, Google Apps system specifically, the following hypotheses are constructed in Table 1.
TABLE 1: HYPOTHESES
Hypotheses Hypotheses Description
H1 System quality has a relationship to use of the Google Apps system H2 Information quality has a relationship to use of the Google Apps system. H3 Service quality has a relationship to use of the Google Apps system.
H4 System quality has a relationship to user satisfaction of the Google Apps system. H5 Information quality has a relationship to user satisfaction of the Google Apps system. H6 Service quality has a relationship to user satisfaction of the Google Apps system. H7 Use has a relationship to user satisfaction of the Google Apps system.
H8 Use has a relationship to perceived net benefit of the Google Apps system.
H9 User satisfaction has a relationship to perceived net benefit of the Google Apps system.
3. Research Methodology Research Procedure
The process for implementing the research is divided into three (3) main. The three phases mentioned consists of initial study, modeling and validation
Cyberspace: Jurnal Pendidikan Teknologi Informasi | 23 cloud computing in IT project have been identified to construct matrix with counter measures. The research outcomes of this phase are list of threats, list of secure practices and measures of IS success. This phase answered the sub objective one of this study.
In Phase 2: Modeling. In this phase consist of four (4) activities: construct model, create hypotheses, designing instrument and data collection. Finding from the phase 1 are used to construct the model. Also in this phase will create hypotheses for those models. Survey instrument will used in this research to elicit information for respondent. The last activity is data collection, survey instrument is used in data collection from respondent. This phase answered the sub objective
In Phase 3: Validation Study. The final phase of this study is named as validation
phase. The IS success model for cloud computing in IT project constructed in phase 2. The purpose of this activity is to ensure that the IS success model for cloud computing in IT project have been clearly identified and validated. Survey is used for validate the model and also statistical test will be used testing of hypotheses. Feedback from the validation will be used as input for enhancement and improvement of the proposed model. This phase answered the sub objective three of this study.
Research Variables
Variables in this study were classified into exogenous and endogenous variables. Exogenous variables consist of system quality, information quality and service quality. While endogenous variables consist of use, user satisfaction and net benefits. Variable for each construct that used in this study is variables that have been used by previous researcher (see Table 2).
TABLE 2: VARIABLES USED IN STUDY
Constructs Variables
System Quality System availability [31], Ease of learning [17], Ease of use [17], Usefulness of systems feature and function [27], Data and system accuracy [27], Usability [31]
Information Quality Precision [17], Completeness [17], Timeliness [17], Usefulness [27] Service Quality Privacy [32], Contact [32], Service availability [32]
Use Dependency [26], Frequency of use [26], Use for intended purpose [27], Type of information used [27].
User Satisfaction Satisfaction with efficiency [27], Satisfaction with effectiveness [27], Overall satisfaction [27], Helpful [33], Fulfillment of expectations [33], Need fulfillment [34], [35].
Net Benefits Makes job easier [36], Saves time [36], Right choice [34], Improved performance [27], Improved quality of study [27].
Data Collection
In accordance with the purpose of study, i.e. to determine the factors that support the successful of cloud computing in IT project environment using updated D&M IS success model and also to validate and test this model on use cloud computing in IT project assignment, researcher chose quantitative research methods to meet objectives of this study.
Online Questionnaire. In today's internet development, software packages and online survey service make online survey research more easy and faster. This services allow to access to respondent at far locations, the ability to reach those respondents that difficult to be contacted, can save money to doubling form a questionnaire in paper form, and can reduces researcher‘s time [62]. According to [63] for online survey, the researchers need to formulate a research instrument and how it should be administered to respondent. To collect the data for this study using World Wide Web to administer online questionnaire to respondents.
Questionnaire Design. In line with the aim of this study, the main purpose of this
questionnaire is to determine the factors that support the successful of cloud computing in IT project environment based on six constructs updated in DeLone and McLean IS success model and also to test this model using the data collected through this questionnaire. The questionnaire used in this study consists of twenty-nine elements statements from all of six dimensions. All questionnaires are used in this study has been tested and validated by other researchers in previous studies [17], [31], [27], [26], [33], 42], [43] [36]. Wording and format of each question of questionnaire ware changed to fit with this study‘s context.
Data Analysis
Regarding the data analysis of this study, it involves correlation analysis to test the formulated hypotheses and the decision on whether to accept or to reject the hypotheses is based on the correlation coefficient for each of the variables. All data analyses are conducted through using Statistical Package for Social Sciences (SPSS) version 21.0.
Respondent
From the total of 38 respondents, majority of participants are male as 61 percent, whereas 39 percent are female respondents. They are undergraduate students from Bachelor of Information Technology program at University Utara Malaysia. In addition, they are experienced in using Google Apps. And the majority participants’ age at 21 to 25 as 94.70 percent, 2.60 percent are 20 to 24 years of age, and 2.60 percent are 31 - 35 years old.
4. Finding and Discussion System Evaluation
Cyberspace: Jurnal Pendidikan Teknologi Informasi | 25 TABLE 3: DESCRIPTIVE STATISTICS OF SYSTEM QUALITY ITEMS
Item Questionnaire Mean Deviation Standard
SQ1 The Google Apps is always available 3.79 1.018
SQ2 The Google Apps is user-friendly 3.79 1.018
SQ3 The Google Apps is easy to use 3.97 1.000
SQ4 The Google Apps is stable 3.89 0.894
SQ5 The response time of Google Apps is acceptable 3.89 0.763 SQ6 The Google Apps provides interaction between user and system 3.73 0.859 SQ7 The Google Apps has attractive feature that appeal to users 4.00 1.900
System Quality (SQ) 3.87 0.780
Information Quality (IQ). The table 4 below shows mean, standard deviation for each item including summated mean and standard deviation in the information quality construct. For all the four items the means are over 3, which indicate that the respondents seem to agree with question items and thus have no issues regarding information quality of the system. The summated mean is 3.99 with the standard deviation of 0.612, which also confirms that overall respondents agree with the items asked.
TABLE 4: DESCRIPTIVE STATISTICS OF INFORMATION QUALITY ITEMS
Item Questionnaire Mean Deviation Standard
IQ1 Google Apps provides the precise information that I need. 3.84 0.886 IQ2 Google Apps provides sufficient information. 3.92 0.712 IQ3 Google Apps provides up-to-date information. 3.89 0.924
IQ4 Google Apps makes it easy for me to create documents 4.07 0.715
Information Quality (IQ) 3.99 0.612
Service Quality (ST). Descriptive statistics in the service quality for individual item and summated scores revealed an overall agreement on the question items, as shown in the table 5 below. Mean for two items was quite close to 4 where as for the last item it was also well above 3. Further on, the summated mean and standard deviation was observed 3.92 and 0.840 respectively that confirms respondent agreement to the items in this construct.
TABLE 5: DESCRIPTIVE STATISTICS OF SERVICE QUALITY ITEMS
Item Questionnaire Mean Deviation Standard
ST1 I feel safe in completing IT project while using Google Apps. 4.05 0.868 ST2 In Google Apps my personal information is treated confidentially. 3.79 1.094
ST3 Google Apps is available all the time. 3.92 0.881
System Quality (ST) 3.92 0.840
TABLE 6: DESCRIPTIVE STATISTICS OF USE ITEMS
Item Questionnaire Mean Deviation Standard
UE1 I am dependent on Google Apps. 4.05 0.868
UE2 I frequently use Google Apps. 3.79 1.094
UE3 I use Google Apps to communicate knowledge and information with other student. 3.92 0.881 UE4 I use Google Apps to share my knowledge. 4.05 0.868
Use (UE) 3.75 0.812
User Satisfaction (US). The mean values for the individual items that were used to measure user satisfaction, as well as summated mean value was well above 3 thus most of the respondents seem to agree with statements. Besides this the summated mean value 3.90 with standard deviation of 0.744 also support the outcome that most of the respondents agreed to the items in user satisfaction construct (see Table 7).
TABLE 7: DESCRIPTIVE STATISTICS OF USER SATISFACTION ITEMS
Item Questionnaire Mean Deviation Standard
US1 I am satisfied with Google Apps efficiency. 3.76 0.851 US2 I am satisfied with Google Apps effectiveness. 3.89 0.924 US3 Overall, I am satisfied with Google Apps. 3.95 0.868 US4 I think the Google Apps is very helpful. 3.84 0.945
US5 Google Apps has met my expectations. 3.97 0.821
US6 Google Apps provides services that are exactly what I need. 4.00 0.805
User Satisfaction (US) 3.90 0.744
Net Benefits (NB). Table 8 shows that in perceived net benefit, mean values were higher than all the other constructs, for individual items as well as for summated mean which is 3.94 and standard deviation is 0.882. Large numbers of respondents were in agreement with the items in this variable, in which, for two items the mean is above 4 and for other three it is very close to 4.
TABLE 8: DESCRIPTIVE STATISTICS OF NET BENEFITS ITEMS
Item Questionnaire Mean Deviation Standard
NB1 Google Apps makes my tasks, related to this IT project easier. 3.84 0.886
NB2 Google Apps saves my time. 4.05 0.803
NB3 I think I made the right choice when I started using Google Apps. 3.84 1.001 NB4 My performance on the study is enhanced by Google Apps. 4.05 .769 NB5 Google Apps improves the quality of my study. 3.92 0.882
Net Benefits (NB) 3.94 0.761
Reliability Analysis
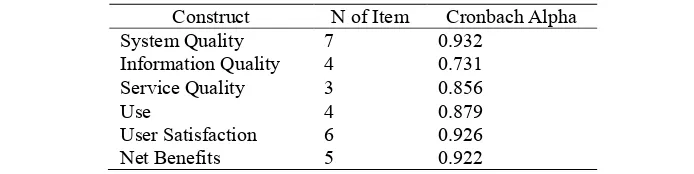
Cyberspace: Jurnal Pendidikan Teknologi Informasi | 27 Results of reliability analysis in this study are shown in table 9. The result of measurement showed that all the score are well or just around the suggested thresholds. The score for Cronbach Alpha range from 0.731 - 0.932, the score exceeding the recommended threshold value of 0.60. That mean the measurement of this study is reliable.
TABLE 9: RESULTS OF COEFFICIENTS FOR ASSESSING THE RELIABILITY OF THE MEASUREMENT
Construct N of Item Cronbach Alpha dependent and independent variables can used Pearson’s correlations coefficient (R). R also frequently is used to test the relationship between various research variables. R indicates the strength and direction of the relationship between the two variables as well as the significance, and generates measure on an interval or ratio scale for variable. The coefficient of the correlation is ranged between -1 and +1 and such value shows the strength of relationship that has been categorized in to high, low or moderate. It’s also used in hypotheses testing. The relationships between various research variables are tested using a Pearson correlation coefficient as supported appropriate for explaining relationship between two continuous variables [39]. For the aims of assessing the relationships of six (6) variables in this study, nine (9) hypotheses are tested through the Pearson correlation. This tested with using SPSS 21.0
Relationship Between System Quality and Use. The result of Pearson correlation coefficient of measures for system quality and use interval scaled variable is shown in Table 10. From the results that the system quality of Google Apps as would be expected, significantly positively correlated to use of Google Apps. Since the results indicated that the independent variable of system quality correlated to dependent variable of use is 61 percent (r = 0.61, and where p < 0.01). The independent variable service quality positively correlated to use. Thus the hypotheses 1 also is accepted, that is system quality will positively affect use of the Google Apps system
TABLE 10: PEARSON CORRELATION COEFFICIENT FOR SYSTEM QUALITY WITH USE
Correlations
SQ UE
SQ Pearson CorrelationSig. (2-tailed) 1 .611**.000
N 38 38
UE Pearson CorrelationSig. (2-tailed) .611**.000 1
N 38 38
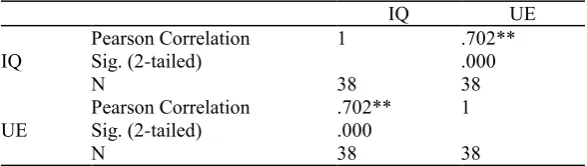
Relationship Between Information Quality and Use. Table 11 shown the result of the Pearson correlation coefficient of measures for information quality and use interval -scaled. From the results that the information quality of Google Apps as would be expected, significantly positively correlated to use of Google Apps also. Since the results indicated that the independent variable of system quality correlated to dependent variable of use is 70 percent (r = 0.70, and where p <0.01). The independent variable information quality positively correlated to use. Thus the hypotheses 2 also is accepted, that is information quality will positively affect use of the Google Apps system.
TABLE 11: RELATIONSHIP BETWEEN INFORMATION QUALITY AND USE.
Correlations
IQ UE
IQ Pearson CorrelationSig. (2-tailed) 1 .702**.000
N 38 38
UE Pearson CorrelationSig. (2-tailed) .702**.000 1
N 38 38
**. Correlation is significant at the 0.01 level (2-tailed).
Relationship Between Service Quality and Use. The below Table 12 shows the Pearson correlation coefficient of the independent variable service quality variable with dependent variable use. The results showed the service quality is significantly and positively correlated with use as would be expected. Since the results indicated that the independent variable of service quality correlated to dependent variable of use is 77 percent (r = 0.77, and where p < 0.01). The independent variable service quality high positively correlated to use. Thus the hypotheses 3 also is accepted, that is service quality will positively affect use of the Google Apps system.
TABLE 12: RELATIONSHIP BETWEEN SERVICE QUALITY AND USE
Correlations
ST UE
ST Pearson CorrelationSig. (2-tailed) 1 .769**.000
N 38 38
UE Pearson CorrelationSig. (2-tailed) .769**.000 1
N 38 38
**. Correlation is significant at the 0.01 level (2-tailed).
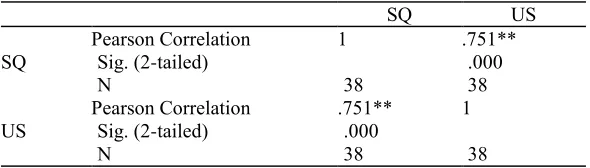
Cyberspace: Jurnal Pendidikan Teknologi Informasi | 29 TABLE 13: RELATIONSHIP BETWEEN SYSTEM QUALITY AND USER SATISFACTION
Correlations
SQ US
SQ Pearson CorrelationSig. (2-tailed) 1 .751**.000
N 38 38
US Pearson CorrelationSig. (2-tailed) .751**.000 1
N 38 38
**. Correlation is significant at the 0.01 level (2-tailed).
The results obtained the service quality is significantly and positively correlated with user satisfaction as would be expected. Since the results indicated that the independent variable of service quality correlated to dependent variable of use is 75 percent (r = 0.75, and where p < 0.01). The independent variable service quality high positively correlated to use. Thus the hypotheses 4 also is accepted, that is service quality will positively affect user of the Google Apps system.
Relationship Between Information Quality and User Satisfaction. Table 14 shows the Pearson correlation coefficient of the independent variable information quality variable with dependent variable user satisfaction. The results obtain the information quality is significantly and positively correlated with user satisfaction as would be expected. Since the results indicated that the independent variable of information quality correlated to dependent variable of user satisfaction is 75 percent (r = 0.75, and where p < 0.01). The independent variable information quality high positively correlated to use. Thus the hypotheses 5 also is accepted, that is information quality will positively affect user of the Google Apps system.
TABLE 14: RELATIONSHIP BETWEEN INFORMATION QUALITY AND USER SATISFACTION
Correlations
IQ US
IQ Pearson CorrelationSig. (2-tailed) 1 .755**.000
N 38 38
US Pearson CorrelationSig. (2-tailed) .755**.000 1
N 38 38
**. Correlation is significant at the 0.01 level (2-tailed).
TABLE 15: RELATIONSHIP BETWEEN SERVICE QUALITY AND USER SATISFACTION
Correlations
ST US
ST Pearson CorrelationSig. (2-tailed) 1 .828**.000
N 38 38
US Pearson CorrelationSig. (2-tailed) .828**.000 1
N 38 38
**. Correlation is significant at the 0.01 level (2-tailed).
The results showed the service quality is significantly and positively correlated with user satisfaction as would be expected. Since the results indicated that the independent variable of service quality correlated to dependent variable of use satisfaction is 83 percent (r = 0.83, and where p < 0.01). The independent variable service quality high positively correlated to user satisfaction. Thus the hypotheses 6 also is accepted, that is service quality will positively affect user satisfaction of the Google Apps system.
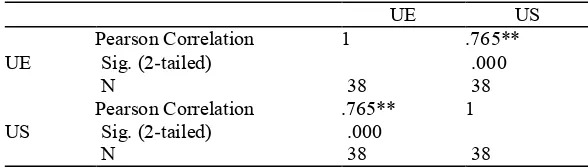
Relationship Between Use and User Satisfaction. The result of Pearson correlation coefficient of measures for use and user satisfaction interval scaled variable is shown in Table 16. From the results that the use of Google Apps as would be expected, significantly positively correlated to user satisfaction of Google Apps. Since the results indicated that the independent variable of use correlated to independent variable of user satisfaction is 76 percent (r = 0.76, and where p< 0.01). The independent variable use high positively correlated to user satisfaction. Thus the hypotheses 7 also is accepted, that is use will positively affect user satisfaction of the Google Apps system.
TABLE 16: RELATIONSHIP BETWEEN USE AND USER SATISFACTION
Correlations
UE US
UE Pearson CorrelationSig. (2-tailed) 1 .765**.000
N 38 38
US Pearson CorrelationSig. (2-tailed) .765**.000 1
N 38 38
**. Correlation is significant at the 0.01 level (2-tailed).
Cyberspace: Jurnal Pendidikan Teknologi Informasi | 31 TABLE 17: RELATIONSHIP BETWEEN USE AND NET BENEFITS
Correlations
UE NB
UE Pearson CorrelationSig. (2-tailed) 1 .859**.000
N 38 38
NB Pearson CorrelationSig. (2-tailed) .859**.000 1
N 38 38
**. Correlation is significant at the 0.01 level (2-tailed).
Relationship Between User Satisfaction and Net Benefits. The result of Pearson correlation coefficient of measures for user satisfaction and net benefits interval scaled variable is shown in Table 18. From the results that the user satisfaction of Google Apps as would be expected, significantly positively correlated to net benefits of Google Apps. Since the results indicated that the dependent variable of user satisfaction correlated to dependent variable of net benefits is 82 percent (r = 0.82, and where p< 0.01). The dependent variable user satisfaction high positively correlated to net benefits. Thus the hypotheses 9 also is accepted, that is user satisfaction will positively affect net benefits of the Google Apps system.
TABLE 18: RELATIONSHIP BETWEEN USER SATISFACTION AND NET BENEFITS
Correlations
US NB
US Pearson CorrelationSig. (2-tailed) 1 .825**.000
N 38 38
NB Pearson CorrelationSig. (2-tailed) .825**.000 1
N 38 38
**. Correlation is significant at the 0.01 level (2-tailed).
Summary of Hypotheses Testing. This section has analyzed each of the hypotheses. The results of hypotheses testing are as summarized in Table 19 below:
TABLE 19: SUMMARY OF HYPOTHESES TESTING
Hypotheses Result
Multiple Regression Analysis
Multiple regression analysis is an advanced extension of correlation, where one variable (the criterion variable) can be predicted based on as number of variables (predicator variables). This analysis purposed to test the model of theoretical framework and gives information about the model as a whole and the relative significance (contribution) of each factor that form the model [42].
From the previous findings in the correlation analysis, it is discovered all variables have positive correlation between independent variable with dependent variable (see Table 10-18). The result of the multiple regression analysis tries to explain the order of the predictive tendency of the variable involved.
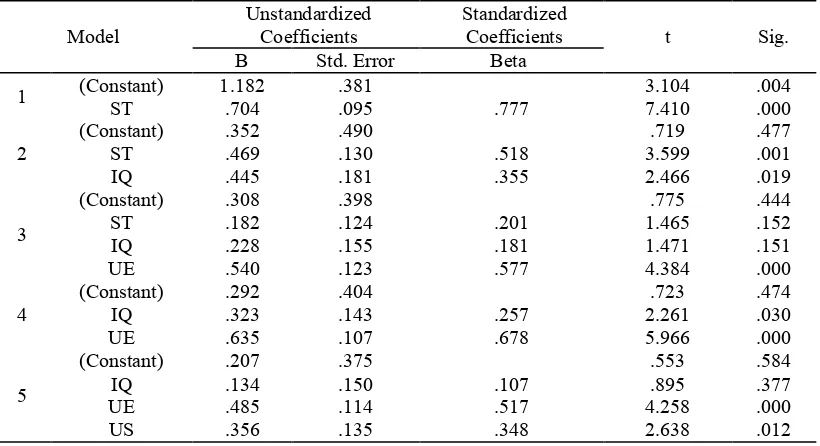
TABLE 20: MULTIPLE REGRESSION ANALYSIS FOR FOUR INTERVAL-SCALED VARIABLES
(i) Model Summary
Model R R Square Adjusted R Square Std. Error of the Estimate
1 .777a .604 .593 .48557
Model Unstandardized Coefficients Standardized Coefficients t Sig.
B Std. Error Beta
1 (Constant)ST 1.182.704 .381.095 .777 3.1047.410 .004.000
2 (Constant)ST .352.469 .490.130 .518 3.599.719 .477.001
IQ .445 .181 .355 2.466 .019
4 (Constant)IQ .292.323 .404.143 .257 2.261.723 .474.030
Cyberspace: Jurnal Pendidikan Teknologi Informasi | 33 estimating measurement of the success of the model. See in table 4.19(i), consist five models that offered by result of multiple regression analysis. From five models offered, high value for R-square is 0.810, in this study model of theoretical framework that selected is fifth model.
The results of ANOVA table 4.19(ii) for fifth model shows that the F value of 48.24 is significant at the 0.0001 levels (p < 0.01). That mean is the independent variables (Information Quality, Use and User Satisfaction) do explain significant amount of the variation in the dependent variable that is Net benefits.
To calculate significant the fifth of variable can be done as below:
LNB = 1IQ1 + 2UE2 + 3US3 + Constant
= 0.134 (3.934) + 0.485(3.7482) + 0.356 (3.9013) + 0.207 = 3.9248218 ≈ 4
The result shows that the IQ, UE and US level in NB were 3.9248218 ≈ 4, which means that the level was strongly agree. The result also shows that the variable of information quality, use and user satisfaction have a significant relationship to the variable net benefits.
5. Conclusion
Findings show that updated D&M IS success model is a useful and efficient tool for determining success using cloud computing in IT project. Accepting Google Apps that is applications of cloud computing, especially by student perspective derived from suitability between individual and information systems. Similar to other research, which use updated D&M IS success model, finding indicates that information quality, system quality and service quality have a significant effect on use and user satisfaction of Google Apps application. As well as, use and user satisfaction have a significant effect on perceived net benefits by students. Finally, usage cloud computing is very useful to student in IT project assignment and most of the student feel satisfied with overall use of the Google Apps.
References
[1] T. Sviridova, L. Sviridova, and B. Tymoshenko, “Google Apps as solution of communication issues
in educational process,” MEMSTECH’2011, no. May, pp. 183–184, 2011.
[2] M. Ali and Z. Khan, “Validating IS success model: Evaluation of Swedish e-Tax system,” Lund University, 2010.
[3] R. D. Freeze, K. A. Alshare, P. L. Lane, and H. J. Wen, “IS success model in e-Learning context
[4] W. DeLone and E. McLean, “Measuring e-commerce success: Applying the DeLone & McLean
information systems success model,” International Journal of Electronic Commerce, vol. 9, no. 1, pp. 31–47, 2004.
[5] P. Reisberger, T. Reisberger, and S. Strahringer, “Measuring success of comerce,” Proceeding of The 6th International Workshop for Technical, Economic and Legal Aspects of Business Models for Virtual Goods, pp. 117–138, 2008.
[6] W. DeLone and E. McLean, “Information systems success: The quest for dependent variable,” Information System Research, vol. 3, no. 1, pp. 65–95, 1992.
[7] C. Baun, M. Kunze, and J. Nimis, Cloud computing web-based dynamic IT services. New York: Springer, 2011.
[8] A. T. Velte, T. J. Velte, and R. Elsenpeter, Cloud computing : a practical approach. United States of America: Mc Graw Hill, 2010.
[9] B. Furht, “Cloud computing fundamentals,” Springer, vol. Chapter 1, no. 4, pp. 3–19, 2010.
[10] K. Ericson and S. Pallickara, “Survey of storage and fault tolerance strategies used in cloud
computing,” Springer, vol. Chapter 6, no. 4, pp. 137–158, 2010.
[11] P. Mell and T. Grance, “The NIST definition of cloud computing recommendations of the National
Institute of Standards and Technology,” Special Publication 800-145, 2011.
[12] S. P. Mirashe and N. V Kalyankar, “Cloud computing,” Communications of the ACM, vol. 51, no. 7, p. 9, 2010.
[13] R. Teeter and K. Barksdale, Google apps for dummies. United States of America: Wiley Publishing, Inc., 2008.
[14] K. Laudon and J. Laudon, Essentials of management information systems, 6th ed. New York: Prentice Hall, 2004.
[15] B. Ives, M. H. Olson, and J. J. Baroudi, “The measurement of user information satisfaction,” Communications of the ACM, vol. 26, no. 10, pp. 785–793, 2008.
[16] J. E. Bailey and S. W. Pearson, “Development of a tool for measuring and analyzing computer user
satisfaction,” Management Science, vol. 29, no. 5, pp. 530–545, 1983.
[17] W. J. Doll and G. Torkzadeh, “The measurement of end-user computing satisfaction,” MIS Quarterly, vol. 12, no. 2, pp. 259–274, 1988.
[18] P. Seddon and S.-K. Yip, “An empirical evaluation of User Information Satisfaction (UIS) measures for use with general ledger accounting software,” The Journal Information System, vol. 6, no. 1, 1996.
[19] M. A. Mahmood, J. M. Burn, L. A. Geomoets, and C. Jacquez, “Variable affecting information technology end-user satisfaction: A meta-analysis of the empirical of the empirical literature,” International Journal of Human Computer Studies, vol. 52, no. 4, 2002.
[20] W. J. Doll, X. Deng, T. S. Raghunathan, G. Torkzadeh, and W. Xia, “The meaning and measurement
of user satisfaction : A multigroup invariance snalysis of the end-user computing satisfaction
istrument,” Journal of Management Information Systems, vol. 21, no. Summer, 2004, 2004.
[21] J. Iivari, “An empirical test of the DeLone-McLean model of information system success,” ACM SIGMIS Database, vol. 36, no. Spring 2005, pp. 8–27, 2005.
[22] M. L. Markus and M. Keil, “If we build it, they will come: Designing information systems that
Cyberspace: Jurnal Pendidikan Teknologi Informasi | 35 [23] W. DeLone and E. McLean, “The DeLone and McLean model of information systems success : A
ten-year update,” Journal of Management Information Systems, vol. 19, no. 4, pp. 9–30, 2003.
[24] A. N. H. Zaied, “An integrated success model for evaluating information system in public sectors,” Journal of Emerging in Computing and Information Sciences, vol. 3, no. 6, pp. 814–825, 2012.
[25] S.-M. Hellstén and M. Maiju, “The DeLone and McLean model of information systems success –
original and updated models,” Seminar in Human-Computer Interaction, pp. 1–5, 2006.
[26] Y.-S. Wang, H.-Y. Wang, and D. Y. Shee, “Measuring e-learning systems success in an
organizational context: Scale development and validation,” Computers in Human Behavior, vol. 23, no. 4, pp. 1792–1808, Jul. 2007.
[27] J.-H. Wu and Y.-M. Wang, “Measuring KMS success: A respecification of the DeLone and
McLean´s model,” Information & Management, vol. 43, no. 6, pp. 728–739, 2006.
[28] S. Petter, W. DeLone, and E. McLean, “Measuring information systems success: models,
dimensions, measures, and interrelationships,” European Journal of Information Systems, vol. 17, no. 3, pp. 236–263, Jun. 2008.
[29] S. I. Swaid and R. T. Wigand, “Measuring the quality of e-service: An empirical study,” Journal of Electronic Commerce Research, vol. 10, no. 1, pp. 13–28, 2009.
[30] P. J.-H. Hu, “Evaluating telemedicine systems success: A revised model,” Proceedings of the 36th Annual Hawaii International Conference on System Sciences (HICSS’03) IEEE, 2003.
[31] L. A. Halawi, R. V. McCarthy, and J. E. Aronson, “An empirical investigation of knowledge
management systems,” Journal of Computer Information Systems, vol. 48, no. 2, p. 121, 2007.
[32] R. Connolly and F. Bannister, “eTax filing & service quality : The case of the revenue online
service,” World Academy of Science, Engineering and Technology, vol. 14, pp. 313–317, 2008.
[33] P. Luarn and H.-H. Lin, “A customer loyalty model for e-service context,” Journal of Electronic Commerce Research,, vol. 4, no. 4, pp. 156–167, 2003.
[34] R. L. Oliver, Satisfaction: A behavioral perspective on the consumer . New York: Mc Graw Hill, 1997.
[35] R. L. Oliver, “A cognitive model of the antecedents and consequences of satisfaction decisions,” Journal of Marketing Research, vol. 17, no. 4, pp. 460–469, 1980.
[36] J. Etezadi-Amoli and A. F. Farhoomand, “A structural model of end user computing satisfaction and
user performance,” Journal Information and Management, vol. 30, no. 2, pp. 65–73, 1996.
[37] L. Kalof, A. Dan, and Thomas Dietz, Essentials of social research, 1st ed. United States of America: Open University Press, 2008.
[38] B. J. Oates, Researching information systems and computing. London: SAGE Publications Ltd, 2006.
[39] U. Sekaran and R. Bougie, Research methods for business: A skill-buiding approach, 5th ed. United Kingdom: John Willey and Sons, 2010.
[40] J. Henseler, C. M. Ringle, and R. R. Sinkovics, “The use of partial least squares path modeling in
international marketing,” New Challenges to International Marketing, vol. 20, pp. 277–319, 2009.
![Figure 1. Updated IS Succes Model [23]](https://thumb-ap.123doks.com/thumbv2/123dok/3729025.1481960/4.595.200.401.95.241/figure-updated-is-succes-model.webp)