1 23
Genes & Genomics
ISSN 1976-9571
Volume 35
Number 2
Genes Genom (2013) 35:159-166
DOI 10.1007/s13258-013-0075-7
Nucleotide diversity of the upstream region
of the putative MADS-box gene controlling
soybean maturity
1 23
Society of Korea. This e-offprint is for personal
use only and shall not be self-archived
R E S E A R C H A R T I C L E
Nucleotide diversity of the upstream region of the putative
MADS-box gene controlling soybean maturity
Jungmin Ha•Puji Lestari •Suk-Ha Lee
Received: 10 June 2012 / Accepted: 22 August 2012 / Published online: 29 January 2013 ÓThe Genetics Society of Korea 2013
Abstract MADS-box genes are involved in plant repro-ductive development. However, the role of gene nucleotide diversity in soybean flowering and maturity remains unknown. Therefore, in this study, the distribution of DNA polymorphisms in the putative MADS-box gene located near the quantitative trait loci (QTL) for flowering time and maturity was targeted for association analysis using Gly-cine max (cultivated soybean) and Glycine soja (wild soybean). Sixteen single nucleotide polymorphisms iden-tified in the upstream region of the putative MADS-box gene around QTLPod mat13-7 and Fflr 4-2 on chromo-some 7 were found to be highly associated with maturity in soybean. The genetic diversity between cultivated soy-beans and the wild relative was comparable, although the early maturity group (EMG) was less diverse than the late maturity group (LMG) of the cultivated soybean. Popula-tion size changes of the MADS-box gene in this soybean germplasm appeared to result from non-random selection.
A selective pressure seemed to act on this gene in the EMG, while the LMG and G. soja were in genetic equilibrium. Neutrality tests and the constructed neighbor-joining tree indicate that the EMG of G. maxhas experi-enced strong artificial selection for its domestication and genetic improvement.
Keywords \Glycine maxGlycine sojaMADS-box gene Nucleotide diversitySNP (single nucleotide
polymorphism)
Introduction
As a short-day crop, soybean depends on a variety-specific day length for the development of flowering initiation (Chen et al.2004). The mechanisms that control the timing of flowering and maturity are crucial (Mansur et al.1996) for the production of soybean seeds. The time of flowering and maturity in soybean varies among genotypes. Thus, understanding soybean maturity is essential for the selec-tion of appropriate varieties with specific geographical adaptations.
For the last few decades, candidate genes responsible for traits of interest could not be identified due to the limita-tions of quantitative trait loci (QTL) mapping on broad genomic regions. However, a recent consensus soybean genetic map composed of various markers (Choi et al. 2007) has been constructed. More than 100 QTLs for traits related to soybean reproduction are now publicly accessi-ble (http://soybeanbreederstoolbox.org/), including QTLs for flowering and maturity. Several QTL analyses for reproductive traits in soybean were progressively investi-gated to resolve questions of phylogeny (Lee et al. 1996; Orf et al.1999; Tasma et al.2001; Khan et al.2008).
Electronic supplementary material The online version of this article (doi:10.1007/s13258-013-0075-7) contains supplementary material, which is available to authorized users.
J. HaP. LestariS.-H. Lee
Department of Plant Science and Research Institute for Agriculture and Life Science, Seoul National University, Seoul 151-921, Korea
P. Lestari
Indonesian Center for Agricultural Biotechnology and Genetic Resources Research and Development, Jl. Tentara Pelajar No. 3A, Bogor 16111, Indonesia
S.-H. Lee (&)
Plant Genomics and Breeding Research Institute, Seoul National University, San56-1, Sillim-dong, Gwanak-gu, Seoul 151-921, Korea
e-mail: [email protected]
123
Genes Genom (2013) 35:159–166 DOI 10.1007/s13258-013-0075-7
With the benefit of revolutionary sequencing technology, the genome sequencing projects of several plant species have published sequences and provided user-friendly web browsers. The genomes of cultivated soybean [Glycine max
(L.) Merrill] and wild soybean (G. sojaSieb. and Zucc) have been sequenced (Kim et al.2010; Lam et al.2010; Schmutz et al.2010). The soybean genome sequence is available on the Phytozome website (http://www.phytozome.net), where the sequence-based markers linked to specific QTLs can be located physically on the chromosomes (Schmutz et al. 2010). Therefore, a candidate gene with a potentially rele-vant role in a trait of interest, such as flowering and maturity, can be easily browsed on annotated genes of soybean and other sequenced genomes.
Several gene families influence the regulation of plant developmental processes. These include GIGANTEA,
CONSTANS, and FLOWERING LOCUS (Li et al. 2008), specifically SUPPRESSOR OF OVEREXPRESSION OF CONSTANS1(Samach et al.2000) and several Arabidopsis loss-of-function mutations of FLOWERING LOCUS C
(Michaels and Amasino 1999). Other genes, designated MADS-box genes, have been well characterized. MADS-box genes encode a highly conserved N-terminal DNA-binding domain and include a family of transcription factors that are involved in various aspects of flowering plant development, such as the development of roots, flowers and fruits (Ng and Yanofsky2001). Several MADS-box genes have been studied in plant species, including MADS AFFECTING FLOWERING1 (Ratcliffe et al. 2001) and AGAMOUS
-LIKE24 (Michaels et al. 2003). The direct effect of Le-MADS-RIN on maturity in tomato was also investigated (Vrebalov et al.2002). Sequence variability of the MADS-box genes in other plants, for instanceZea mays, A. tha-liana, andBrassica oleraceae(Zhao et al.2011), as well as the phylogeny of the MADS-box multigene family in eukaryotes and in lineages of angiosperms and gymno-sperms (Becker et al.2000), has been well investigated.
In soybean, numerous genes that control reproductive stages have been identified. The eightE-series genes from
E1toE8show differential sensitivity to light quality and photoperiod, in which, dominant E alleles determine late flowering and maturity (Cober et al.1996). Under natural day lengths, the dominant E alleles tend to delay flowering time and maturity, although the impact of each gene may vary (Tasma et al.2001). Recently, MADS-box genes have been isolated from soybean (Han et al.2010), and twelve MADS-box genes likely participate in soybean flowering, including APETALA1 have been identified (Chi et al. 2011). However, the role of the MADS-box genes’ nucle-otide diversity on the reproductive stages of soybean remains to be elucidated.
Since MADS-box genes play critical roles in the gene networks that control plant development, a better
understanding of the phylogeny of the soybean MADS-box genes may improve the understanding of soybean evolution and genetic relationships. Thus, based on the hypothesis that single nucleotide polymorphisms (SNPs) in the puta-tive MADS-box genes surrounding QTLs for flowering and maturity are associated with the traits of interest, this study investigated the nucleotide variation of the gene inG. max
andG. soja.
Materials and methods
Plant materials and DNA extraction
A total of 56G. maxand 20G. sojagenotypes originating from Asia, Europe, America and Africa were used in this study. The soybean genotypes were obtained from the U.S. Department of Agriculture (USDA) soybean germplasm collection. With respect to maturity, theG. maxgenotypes were classified into early maturity group (EMG) and late maturity group (LMG). EMG included 28 genotypes with MG-I (maturity group of I) and earlier, while LMG com-prised 28 genotypes showing MG-V and later. The origin and maturity groups of the soybean genotypes used in this study are listed in Supplementary Table 1.
Young and healthy leaves of soybean were harvested for DNA extraction. Genomic DNA was extracted according to Shure et al. (1983).
Sequence identification of the target genomic region
Based on the linked position of the MADS-box gene and the QTLs for maturity and/or flowering, the targeted loci were identified by browsing theG. max genome sequence (Glyma1.01) at the Phytozome website (http://www. phytozome.net/soybean). The locations of the MADS-box genes were searched using a MADS-box specific domain coding sequence. QTLs for three traits of interest (first flower, flowering time and pod maturity) with high phe-notypic variation (R2[10) and logarithm of odds (LOD) scores higher than 5.0 were selected using Soybean Bree-der’s Toolbox (http://soybeanbreederstoolbox.org/). Prin-cipally, phenotypic variation underlines heritable genetic variation, while LOD is to estimate whether two gene loci to be inherited together as a package. These higherR2and LOD score give higher confidence of heritability and evi-dence for linkage being observed does not occur by chance (Collard et al.2005).
Several simple sequence repeat (SSR) markers associ-ated with the QTLs were found in the region of the chro-mosomes using the Basic Local Alignment Search Tool (BLAST) between the markers sequences searched against the G. max genome sequence. The putative MADS-box
genes located relatively close to the QTLs for first flower, flowering time and pod maturity were chosen for further PCR amplification and sequencing. To confirm the poten-tial participation of these genes in the control of flowering and/or maturity, the flanking sequences (*about 10 Kb) of the QTLs were aligned against all GenBank entries using the BLAST algorithm. Any putative genes were also investigated with the FGENESH software (http://linux1. softberry.com/berry.phtml) using the dicot plant option (Arabidopsis).
Primer design and PCR amplification
To amplify the putative MADS-box genes and their upstream sequences, 22 primer sets were designed based on William 82 sequence that was available from the Joint Genome Institute soybean database. The primers were generated using Primer3Plus (http://www.bioinformatics. nl/cgi-bin/primer3plus/primer3plus.cgi), and primer quality was confirmed with the GeneRunner tool version 3.05 (Hastings Software, Hastings on Hudson, N.Y., USA). The primer sequences are listed in Supplementary Table 2.
The designed primers were initially tested for SNP discovery using four soybean genotypes in each maturity group, EMG (M1, M2, M3 and M4) and LMG (M37, M38, M39 and M40). Polymerase chain reaction (PCR) was performed with a Tetrad Thermal Cycler (MJ Research Inc., Watertown, MA, USA), and the reaction consisted of 50 ng of genomic DNA, 3.2 pmol of forward and reverse primers, 200 lM of each dNTP, 1.5 mM MgCl2, 19reaction buffer [10 mM Tris–HCl (pH 8.3), 50 mM
KCl], and 1.6 U of Taq DNA polymerase (VIVAGEN, Sungnam, Korea) in a total reaction volume of 50ll. The PCR reactions were performed with an initial denaturation at 94°C for 5 min followed by 30 cycles of 94°C for 30 s, 50–70°C for 30 s and 72°C for 1 min, and a final extension of 72°C for 1 min. The primer sets possessing SNPs detected among the eight EMG and LMG genotypes were used for further amplification using the remaining 48 genotypes.
Sequencing analysis
The PCR products composed of a single band were purified with exonuclease I and shrimp alkaline phosphatase. The cleaned PCR product was directly sequenced using a Big-DyeÒTerminator v3.1 Cycle Sequencing Kit (Applied Bio-systems, Foster City, CA, USA). One initial amplification primer and an internal sequencing primer were used for sequencing. The sequence product was run on an ABI 3730xl DNA sequencer (Applied Biosystems, Foster City, CA, USA). Twenty wild soybeans (G. soja) were amplified and sequenced using only the primer sets that exhibited
significant genetic diversity associated with maturity in the
G. max genotypes. DNA amplification and sequencing analysis of the MADS-box genes in theG. sojaaccessions was conducted in the same manner as forG. max. Sequence and data analysis
The resulting sequences in ABI trace files were aligned using SeqScape software v2.0 (Applied Biosystems, Foster City, CA, USA) to identify the SNPs. The association between SNP allele frequencies and the soybean maturity group (MG) was evaluated using standard contingency tests for 292 tables
(two alleles, LMG vs. EMG).Pvalues were determined via an approximate calculation on TASSEL version 2.1 (http://www. maizegenetics.net/tassel). Molecular population genetics statistics were estimated using DNASP 5.10.01 (Librado and Rozas2009) and MEGA4 (Tamura et al.2007). This included nucleotide diversity (p) (Tajima1989), the expected hetero-zygosity per nucleotide site and nucleotide polymorphism (h) (Watterson1975), and the number of polymorphic sites in a genotypic sample corrected for sample size.
To test the neutrality of the polymorphisms, Tajima’s D statistical test was used (Tajima1989). This test considered the difference between theta Watterson (h) and nucleotide diversity (p). The coalescence process defined by Fu and Li’s D* and F* statistical tests (Fu and Li1993) was used to evaluate evidence of the neutral theory of molecular evolution. A neighbor-joining tree was built using PHYLIP version 3.68 with slight modification (Felsenstein 1993). The sequence alignment for PHYLIP was performed with ClusterX version 1.81 (Thompson et al.1997).
Results and discussion
Selection of the target genomic region
Approximately 100 QTLs associated with maturity and flowering in soybean were identified. The completion of the soybean genome sequences and advanced bioinfor-matics may facilitate the in silico cross-matching of can-didate sequences with QTLs using approaches of positional cloning or association mapping (Salvi and Tuberosa2005). However, the complicated genome structure of soybean (Shoemaker et al. 1996; Schmutz et al. 2010) presents difficulty in discriminating major genes from genes copied via duplication in the soybean genome. Considering the characteristics of the soybean genome, the present study applied the candidate gene approach in parallel with QTL mapping to identify specific genomic sequences associated with maturity in the cultivated and wild soybeans.
Forty-one of the 84 genetic loci that were searched from Soybean Breeder’s Toolbox (http://soybeanbreederstoolbox.
Genes Genom (2013) 35:159–166 161
123
org/) for maturity and flowering traits (first flower, Fflr; flowering time,FT; pod maturity,Pod mat) exhibited highly significant phenotypic variation and were selected for further analysis. These 41 QTLs were distributed over nine linkage groups/LGs (B1, C1, C2, G, I, K, L, M and O) of the soybean consensus genetic map (Choi et al.2007). Based on the link-age position of MADS-box genes and the QTLs for maturity and/or flowering, several potential genes were chosen according to E-value and high similarity using BLAST algo-rithm. Further screening of the putative MADS-box genes was predicted using Arabidopsis genome (http://linux1.softberry. com/berry.phtml). In consideration of their potential rele-vance in the control of soybean flowering and maturity, finally 75 putative MADS-box genes were selected.
The sequence information of the SSR and SNP markers associated with the 41 QTLs was used to estimate the physical position of the targeted QTLs. The putative MADS-box genes were located around the markers asso-ciated with the QTLs by narrowing down the two genomic regions to chromosomes 7 and 11 with three QTLs on linkage group (LG) M and B1. The QTLs ofPod mat 13-7
(R2=30) andFflr 4-2(R2=26) were linked to the same SSR marker, satt150, and the QTL of Pod mat 6-2
(R2=10.8) was linked to the cr122_1 marker (Lee et al.
1996; Orf et al. 1999). Finally, two putative MADS-box genes located on chromosome 7 (Glyma07g03400) and chromosome 11 (Glyma11g07820) were identified as tightly associated with pod maturity and first flower, and the nucleotide polymorphisms of these genes were inves-tigated. This approach demonstrated that a link between the MADS-box genes and the quantitative trait for maturity can be estimated based on the linkage information of the genes co-segregating with the QTL at positional genes. The genetic variation of these genes was identified among cultivated G. maxbased on the maturity and its wild rel-ative,G. soja.
Nucleotide polymorphism
No nucleotide changes were found in the genic region of the putative MADS-box genes on chromosomes 7 (2390257–2394709 bp) and 11 (5489539–5493481 bp). Sequence polymorphisms were detected only in the upstream region of chromosome 7 (2383002–2384178 bp) with the predicted promoters on the cultivated and wild soybean genotypes as shown in Figs.1and2, respectively. In the upstream region, a promoter initiates transcription of a particular gene. This study demonstrated that there were ten possible promoter regions predicted in the MADS-box gene on chromosome 7. Approximately 7 kb a part from the possible promoter region, the 16 SNPs withP value lower than 0.05 were identified using standard contingency test. The SNPs highly associated with maturity group (MG)
were identified using the primer set indicated with an asterisk in Supplementary Table 2. The positions of poly-morphic sites were counted from transcription starting point of putative MADS-box gene.
Although the SNPs existed within the upstream of the gene, the nucleotide variation proved the high association with maturity. These highly associated SNPs on the tran-scription factor binding sites on the putative promoter were expected to control the transcription of the putative MADS-box gene. This result signifies that MADS-box gene in chromosome 7 contributes more to control soybean maturity in comparison with that in chromosome 11. This result is in good agreement with previous QTL cloning studies which reported the major contribution of variants in the upstream region of the Ap2-like transcription factor involved in flowering (Salvi et al.2007) and the tb1gene governing the increase in apical dominance in maize (Clark et al. 2004). Importantly, MADS-box gene highly associ-ated with soybean maturity in this study was not included among 12 MADS-box genes for flowering/maturity in soybean identified in previous studies (Chi et al. 2011). Therefore, this MADS-box gene containing this variants associated with soybean maturity could be novel.
The SNP frequency in the upstream region of the MADS-box gene for all of the genotypes averaged one SNP per 73.5 bases, with nine identical allele pairs on 16 segregating sites. With alleles commonly found in culti-vated soybean, the nucleotide polymorphism in LMG was higher than that of EMG. Interestingly, a small number of alternate alleles in EMG were found to be common alleles inG. soja.Diverse soybean accessions comprising modern soybean genotypes and the ancestor from different demo-graphic regions may also contribute to detect more frequent SNPs in this gene. Based on the Maximum Composite Likelihood Estimate of the Pattern of Nucleotide Substi-tution (Tamura et al. 2007), the overall transition/tranver-sion ratio bias of the wild soybeans was 2.58 times higher than that of G. max (0.487). In this approach, the evolu-tionary distances are estimated independently of others, either by analytical formula or by likelihood methods with lower errors and expectedly is more accurate (Tamura et al. 2007). Clearly, although the selection was made for loci with a function, the nucleotide variation associated with the function may result from the non-coding region as shown in this study. The variation detected in upstream of the MADS-box gene may support the expectation based on previous QTL cloning studies.
Neutrality test
A neutrality test was conducted to assess the selection of mutations in this putative soybean MADS-box gene based on Tajima’s D (Tajima1989), and Fu and Li’s D* and F*
Fig. 1 Sequence polymorphisms and structure prediction in the genomic region associated with MG in 56 genotypes of G. max. Within the upstream region, ten possible promoter regions were predicted using TSSP (http://linux1.softberry.com/berry.phtml), which are indicated withpink arrowheads. At one of the possible promoter regions (highlighted arrowhead) as far as 7 Kb upstream of the putative MADS-box gene, sixteen polymorphisms with p values lower than 0.05 were identified. Codes of M1–M28 in the left column
represent the EM group ofG. max, and M29–M56 indicate the LM group ofG. max. The positions of the polymorphic sites are indicated based on the transcription starting point of the putative MADS-box gene.Green arrowson theblack bold barrepresent the chromosome 7 predicted genes.Yellow arrowsandblue boxessymbolize the exact location of polymorphisms and predicted transcription binding sites, respectively.Question marksrepresent the nucleotides that could not be sequenced. (Color figure online)
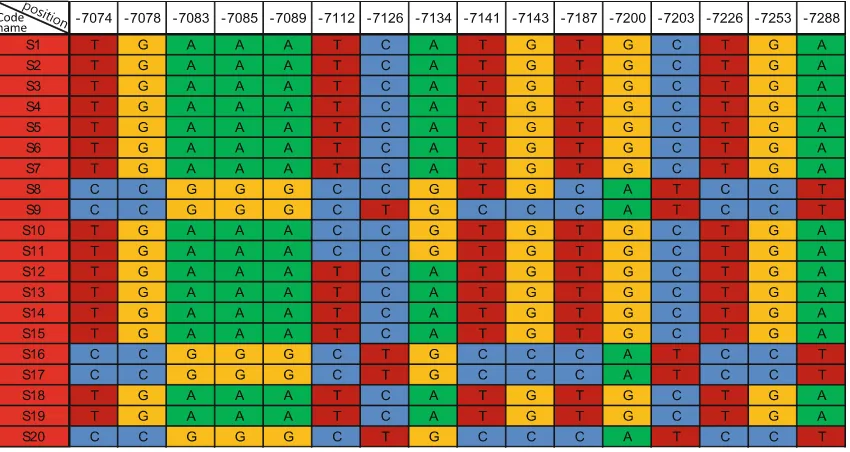
Fig. 2 Sequence polymorphisms inG. soja. Code names of S1–S20 in theleft columnindicateG. sojagenotypes. Thenumbersin thefirst row
represent the distance from the transcription starting point of the putative MADS-box gene
Genes Genom (2013) 35:159–166 163
123
tests (Fu and Li1993). Tajima’s D, and Fu and Li’s D* and F* tests test are powerful statistical approaches for com-paring the observed nucleotide diversity with the expected diversity in a neutral genetic model. Statistical analysis of the putative MADS-box gene sequence is presented in Table1.
A positive Tajima’s D (3.547,P\0.001) for all of the observed genotypes suggests that this gene contains an excess of common variation. Significant positive Tajima’s D for total soybeans signifies low levels of low and high frequency polymorphisms of the MADS-box gene. Based on this, it can be concluded that a decrease in the soybean population size may be influenced by balancing selection. A highly significant Tajima’s D may also implies that the allele variation of the MADS-box genes in the total soy-bean accessions is not randomly selected (Tajima 1989), indicating that artificial selection may be acting upon this gene. In support of the conservative Tajima’s D test results, positive significant Fu and Li’s D* (1.615) and F* (1.957) values emphasize evidence of balancing selection or a population subdivision event. These results support the hypothesis that a demographic process may influence the diversity ofG. max LMG and EMG, as well as the wild soybean during selection and domestication.
When each population ofG. sojaandG. maxwas tested individually for neutrality, the individual value of each conservative Tajima’s D was non-significant positive, indicating a slight excess of intermediate frequency or long-lived polymorphism for this gene. This result was supported by similar positive values of Fu and Li’s D* and F* tests for each population ofG. maxandG. soja. A non-significant negative value of Tajima’s D (-1.889) in EMG ofG. max proves that rare alleles that contribute to popu-lation growth, even under selective pressure, have occurred in these total soybean accessions (Tajima 1989).
Accordingly, deleterious alleles that existed in the MADS-box gene on EMG may lead to population expansion. Demographic processes possibly affect the genome more evenly than selective pressures on the MADS-box gene itself on EMG (Stajich and Hahn2005). This did not occur on LMG that showed a higher Tajima’s D with a non-significant positive departure (D=2.677). The frequency
spectrum of polymorphic sites for this gene on LMG was skewed towards a deficit of low-frequency alleles relative to expectations. In the selection process, early maturity soybean genotypes are preferentially improved (Lee et al. 1996; Tasma et al.2001). A non-significant Tajima’s D of LMG specifies that bothG. maxandG. sojaare in genetic equilibrium (Maia et al.2009) but not for EMG as a target of artificial selection program. This clue provides evidence that G. soja and LMG have not been intentionally improved as strongly as EMG in the selection process. The MADS-box genes in the populations shaping these soy-beans may be primarily contributed by the EMG.
Evolutionary divergence and phylogeny
The nucleotide diversity of 16 SNPs (Figs. 1, 2) was evaluated using two common measures, the expected het-erozygosity per nucleotide site (p) and the difference between theta Watterson (h). The theta estimates 4Nel, whereNeis the effective population size andlis defined as the mutation rate per nucleotide (Watterson 1975). As expected, G. max exhibited lower nucleotide diversity (p=0.0179) compared to the wild soybean(p=0.0253).
However, based on thehvalue,G. max(h=24.1) andG.
soja(h =23.9) were comparatively similar to one another.
It is notable that LMG exhibited much higher nucleotide diversity estimators (p=0.0280, h=0.0213) than EMG
(p=0.0030,h=0.0109), in spite of the same sample size.
Table 1 Sequence statistics of the putative MADS-box gene
Parameter Total population G. max Early maturity group/ EMG (G. max)
h910-3 0.0204 0.0241 0.0109 0.0213 0.0239
Hd 0.716 0.592 0.071 0.767 0.568
k 5.175 2.958 0.026 5.842 2.231
D 3.547** 1.305ns -1.889ns 2.677ns 1.497ns
D* 1.615* 1.438ns -2.934* 1.439* 1.211ns
F* 1.957* 1.647ns -3.051* 2.125* 1.503ns
Nnumber of accession,Snumber of segregating sites,pnucleotide diversity,hnucleotide diversity Watterson,Hdhaplotype diversity,kaverage evolutionary divergence,DTajima’s D test,D* Fu and Li’s D*,F* Fu and Li’s F*
ns non-significant atP
\0.05 level, * and ** significant atP\0.05 andP\0.01 levels, respectively
The mean diversities within the total population compris-ingG. maxandG. sojawere higher (2.587) than the mean inter population diversity (1.832). Measured parameters representing evolutionary divergence of this gene is shown in Table1.
According to the base substitution for the overall sequence pairs, the mean pairwise distance used to estimate the average evolutionary divergence ofG. maxwas higher than that withinG. soja.Among soybean MGs, the EMG genotypes were less divergent (k=0.016) than the LMG
genotypes (k=6.933). Moreover, the pairwise distance of
LMG andG. soja(1.889) was less than that of EMG andG. soja(11.366). The putative MADS-box gene of EMG and LMG also exhibited higher divergence (3.049) compared to that of LMG andG. soja. The coalescent theory (Wall and Hudson2001) was performed to predict an initial number of haplotypes for the MADS-box gene. Considering all of the accessions, the estimated number of haplotypes ranged from 5 to 11. Based on each group, G. max and G. soja had comparable haplotype diversity according to theta Watter-son. However, the haplotype diversity of the total soybean accessions was still less than that in LMG. In contrast to LMG, EMG showed the lowest haplotype diversity, speci-fying lower genetic differentiation. Considering the genomic region of the SNPs,G. maxretained only 71 % (p) and 66 % (Hd) of the nucleotide diversity ofG. soja. Furthermore, the higher p value on LMG compared to EMG supports the Tajima’s D value, indicating that strong selection for matu-rity affects the genetic diversity at the specific region. In addition, the lowerh value of EMG compared to G. soja
suggests that the haplotypes ofG. sojahave been eliminated in G. max EMG by high pressure selection during the domestication ofG. soja to G. max. The alternate alleles probably remained in the EMG that commonly existed in the wild progenitors due to purifying selection.
The neighbor-joining tree analysis with the genetic distance revealed two major clades. One of the clades encompassed all of the EMG and a number of the LMG with very minorG. sojagenotypes.G. sojaand the LMG of
G. maxwere distributed evenly in both clades, regardless of their origins. In contrast, EMG was grouped dominantly in one branch of the second clade despite diverse origins (Fig.3) that may be considered different haplotypes. In good agreement with neutrality tests and evolutionary divergence analysis, the neighbor-joining tree showed that the trace of strong selection identified on EMG pooled into one clade, signifying low genetic diversity. Consistent with the series of Tajima and Fu and Li tests results, the phy-logenic analysis also demonstrates that selection on this genomic region has focused on early maturity with con-sideration of diverse origins such as Korea, China and Japan. The lower mean evolutionary distance of this gene found between LMG andG. sojacompared to that between
EMG and LMG also indicates that those genotypes may belong to the same molecular evolutionary lineage. Thus, the results of this study provide insight into the genetic relationship and evolutionary history of both cultivated and wild soybeans.
In this study, the candidate gene approach in parallel with QTL mapping proved effective at identifying genomic regions associated with QTLs. Considering the advantages of whole genome sequences (Varshney et al. 2009), a common domain of a gene family was detected around the QTL as a candidate gene for association analysis. A cla-distic analysis for establishing future genetic association studies of the MADS-box gene may be validated. More-over, further analysis on the putative MADS-box gene associated with soybean maturity using genetic engineer-ing, mutagenesis or RNA interference will be valuable for gene regulation studies.
Acknowledgments This research was supported by a grant from the Next-Generation Biogreen 21 Program (No. PJ008117), Rural Development Administration, Republic of Korea.
References
Becker A, Winter KU, Meyer B, Saedler H, Theiben G (2000) MADS-box gene diversity in seed plants 300 million years ago. Mol Biol Evol 17:1425–1434
Chen M, Chory J, Fankhauser C (2004) Light signal transduction in higher plants. Annu Rev Genet 38:87–117
Chi Y, Huang F, Liu H, Yang S, Yu D (2011) An APETALA1-like gene of soybean regulates flowering time and specifies floral organs. J Plant Physiol 168:2251–2259
Fig. 3 Neighbor-joining tree representing the clade relationships of the MADS-box genes.Yellow,purpleandred dotsrepresent the LMG ofG. max, the EMG of G. max, andG. soja, respectively. (Color figure online)
Genes Genom (2013) 35:159–166 165
123
Choi IY, Hyten DL, Matukumalli LK, Song Q, Chaky JM, Quigley CV, Chase K, Lark KG, Reiter RS, Yoon MS et al (2007) A soybean transcript map: gene distribution, haplotype and single-nucleotide polymorphism analysis. Genetics 176:685–696 Clark RM, Linton E, Messing J, Doebley JF (2004) Pattern of
diversity in the genomic region near the maize domestication gene tb1. Proc Natl Acad Sci USA 101:700–707
Cober ER, Tanner JW, Voldeng HD (1996) Soybean photoperiod-sensitivity loci respond differentially to light quality. Crop Sci 36:606–610
Collard BCY, Jahufer MZZ, Brouwer JB, Pang ECK (2005) An introduction to markers, quantitative trait loci (QTL) mapping and marker-assisted selection for crop improvement: the basic concepts. Euphytica 142:169–196
Felsenstein J (1993) PHYLIP (Phylogeny Inference Package). Version 3.5. Distributed by the author, Department of Genetics, University of Washington, Seattle
Fu YX, Li WH (1993) Statistical test of neutrality of mutation. Genetics 133:693–709
Han LT, Jiang W, Yang SP, Yu DY, Gai JY (2010) Isolation and analysis of MADS-box gene from soybean (Glycine max L. Merr.) cytoplasmic male sterile line. Acta Agronomica Sinica 36:905–910
Khan NA, Githiri SM, Benitez ER, Abe J, Kawasaki S, Hayashi T, Takahashi R (2008) QTL analysis of cleistogamy in soybean. Theor Appl Genet 117:479–487
Kim MY, Lee S, Van K, Kim TH, Jeong SC, Choi IY, Kim DS, Lee YS, Park D, Ma J et al (2010) Whole-genome sequencing and intensive analysis of the undomesticated soybean (Glycine sojaSieb. and Zucc.) genome. Proc Natl Acad Sci USA 107:22032–22037 Lam HM, Xu X, Liu X, Chen WB, Yang GH, Wong FL, He WM, Qin
N, Wang B, Li J et al (2010) Resequencing of 31 wild and cultivated soybean genomes identifies patterns of genetic diversity and selection. Nat Genet 42:1053–1059
Lee SH, Bailey MA, Mian MAR, Carter TE, Ashley DA, Hussey RS, Parrott WA, Boerma HR (1996) Molecular markers associated with soybean plant height, lodging, and maturity across locations. Crop Sci 36:728–735
Li D, Liu C, Shen L, Wu Y, Chen H, Robertson M, Helliwell CA, Ito T, Meyerowitz E, Yu H (2008) Repressor complex governs the integration of flowering signals inArabidopsis. Dev Cell 15: 110–120
Librado P, Rozas J (2009) DnaSP v5: a software for comprehensive analysis of DNA polymorphism data. Bioinformatics 25:1451–1452 Maia RT, Scarpassa VM, Maciel-Litaiff LH, Tadei WP (2009) Reduced levels of genetic variation inAedes albopictus(Diptera: culicidae) from Manaus, Amazonas State, Brazil, based on analysis of the mitochondrial DNAND5gene. Genet Mol Res 8:998–1007
Mansur LM, Orf JH, Chase K, Jarvik T, Cregan PB, Lark KG (1996) Genetic mapping of agronomic traits using recombinant inbred lines of soybean. Crop Sci 36:1327–1336
Michaels SD, Amasino RM (1999) FLOWERING LOCUS C encodes a novel MADS domain protein that acts as a repressor of flowering. Plant Cell 11:949–956
Michaels SD, Ditta G, Gustafson-Brown C, Pelaz S, Yanofsky M, Amasino RM (2003)AGL24acts as a promoter of flowering in
Arabidopsisand is positively regulated by vernalization. Plant J 33:867–874
Ng M, Yanofsky MF (2001) Function and evolution of the plant MADS-box gene family. Nat Rev Genet 2:186–195
Orf JH, Chase K, Jarvik T, Mansur LM, Cregan PB, Adler FR, Lark KG (1999) Genetics of soybean agronomic traits I. Comparison of three related recombinant inbred populations. Crop Sci Soc Am 39:1642–1651
Ratcliffe OJ, Nadzan GC, Reuber TL, Riechmann JL (2001) Regulation of flowering inArabidopsisby an FLC homologue. Plant Physiol 126:122–132
Salvi S, Tuberosa R (2005) To clone or not to clone plant QTLs: present and future challenges. TRENDS Plant Sci 10:298–304 Salvi S, Sponza G, Morgante M, Tomes D, Niu X, Fengler KA,
Meeley R, Ananiev EV, Svitashev S, Bruggemann E et al (2007) Conserved non-coding genomic sequences associated with a flowering-time quantitative trait locus in maize. Proc Natl Acad Sci USA 104:11376–11381
Samach A, Onouchi H, Gold SE, Ditta GS, Schwarz-Sommer Z, Yanofsky MF, Coupland G (2000) Distinct roles ofCONSTANS
target genes in reproductive development of Arabidopsis. Science 288:1613–1616
Schmutz J, Cannon SB, Schlueter J, Ma JX, Mitros T, Nelson W, Hyten DL, Song QJ, Thelen JJ, Cheng JL et al (2010) Genome sequence of the palaeopolyploid soybean. Nature 465:120 Shoemaker RC, Polzin K, Labate J, Specht J, Brummer EC, Olson T,
Young N, Concibido V, Wilcox J, Tamulonis JP et al (1996) Genome duplication in soybean (Glycine subgenus soja). Genetics 144:329–338
Shure M, Wessler S, Fedoroff N (1983) Molecular identification and isolation of theWaxylocus in maize. Cell 35:225–233 Stajich JE, Hahn MW (2005) Disentangling the effects of
demogra-phy and selection in human history. Mol Biol Evol 22:63–73 Tajima F (1989) Statistical method for testing the neutral mutation
hypothesis by DNA polymorphism. Genetics 123:585–595 Tamura K, Dudley J, Nei M, Kumar S (2007) MEGA4: Molecular
Evolutionary Genetics Analysis (MEGA) software version 4.0. Mol Biol Evol 24:1596–1599
Tasma IM, Lorenzen LL, Green DE, Shoemaker RC (2001) Mapping genetic loci for flowering time, maturity, and photoperiod insensitivity in soybean. Mol Breed 8:25–35
Thompson JD, Gibson TJ, Plewniak F, Jeanmougin F, Higgins DG (1997) The CLUSTAL_X windows interface: flexible strategies for multiple sequence alignment aided by quality analysis tools. Nucleic Acids Res 25:4876–4882
Varshney RK, Nayak SN, May GD, Jackson SA (2009) Next-generation sequencing technologies and their implications for crop genetics and breeding. Trends Biotechnol 27:522–530 Vrebalov J, Ruezinsky D, Padmanabhan V, White R, Medrano D,
Drake R, Schuch W, Giovannoni J (2002) A MADS-Box gene necessary for fruit ripening at the tomato Ripening-Inhibitor (Rin) locus. Science 296:343–346
Wall JD, Hudson RR (2001) Coalescent simulations and statistical tests of neutrality. Mol Biol Evol 18:1134–1135
Watterson GA (1975) On the number of segregating sites in genetical models without recombination. Theor Popul Biol 7:256–276 Zhao Q, Weber AL, McMullen MD, Guill K, Doebley J (2011)
MADS-box genes of maize: frequent targets of selection during domestication. Genet Res Camb 93:65–75