ISBN: 978-9952-8071-4-1
EMERGING ISSUES
IN THE NATURAL AND
APPLIED SCIENCES
Academic book
“PROGRESS”
LCC: AY10-29 UDC: 002
Editorial board:
Ángel F. Tenorio, Prof. Dr.
Polytechnic School, Pablo de Olavide University (Spain) Maybelle Saad Gaballah, Prof. Dr.
National Research Centre, Cairo (Egypt) Manuel Alberto M. Ferreira, Prof. Dr. ISCTE-Lisbon University Institute (Portugal) Eugen Axinte, Prof. Dr.
"Gheorghe Asachi" Technical University of Iasi (Romania)
Sarwoko Mangkoedihardjo, Prof. Dr.
Sepuluh Nopember Institute of Technology (Indonesia)
Cemil Tunc, Prof. Dr.
Yuzuncu Yil University (Turkey)
Peng Zhou, Prof. Dr.
School of Medicine, Wake Forest University (USA)
Editor-in-chief: Dr. J.Jafarov Executive editor: A. Khankishiyev
Emerging issues in the natural and applied sciences. “Progress” LLC, Baku, 2013, 180 p.
This research book can be used for teaching modern science, including for teaching undergraduates in their final undergraduate course in all fields of natural and applied sciences. More generally, this book should serve as a useful reference for academics, sciences researchers.
ISBN: 978-9952-8071-4-1
TABLE OF CONTENTS
Chapter 1.
Manuel Alberto M. Ferreıra
THE HAHN-BANACH THEOREM FOR THE NORMED SPACES………...5
Chapter 2.
Vítor João Pereira Domingues Martinho INTERNATIONAL TRADE OF FRUITS BETWEEN
PORTUGAL AND THE WORLD………...18
Chapter 3.
Yetrie Ludang
EXPERIMENTAL FINDINGS ON BIODIVERSITY OF CITY PHYTOSTRUCTURE BASED ON INDIGENOUS KNOWLEDGE IN PALANGKA RAYA, CENTRAL
KALIMANTAN………...30
Chapter 4.
Manuel Alberto M. Ferreira, Marina Andrade
AN INFINITE SERVERS QUEUE SYSTEMS WITH POISSON AND
NON POISSON ARRIVALS BUSY PERIOD SIMULATION...38
Chapter 5.
Yusak Tanoto
POTENTIAL OF FEED-IN TARIFF IMPLEMENTATION FOR RESIDENTIAL INTEGRATED PHOTOVOLTAICS-GRID CONNECTED IN INDONESIA’S
RESIDENTIAL SECTOR...59
Chapter 6.
Abdul Hamid
THE IMPORTANCE OF FORESTS BIODIVERSITY
AS CARBON SINK OF EAST JAVA...76
Chapter 7.
M.M. Sabbour
PRELIMINARY INVESTIGATIONS INTO THE BIO- CONTROL OF
RED PALM WEEVIL RHYNCHOPHORUS FERRUGINEUSBY USING
BEAUVERIA BASSIANA ISOLATES IN EGYPT...85
Chapter 8.
M. Husni Kotta, Sarwoko Mangkoedihardjo
COASTAL LANDUSE CHANGE AND THE NEED OF GREENSPACE FOR SUSTAINABLE WATERFRONT SETTLEMENT OF
Chapter 9.
M.M. Sabbour
EVALUATION OF ISOLATED ENTOMOPATHOGENIC FUNGI
AGAINST THE RED PALM WEEVIL RHYNCHOPHORUS
FERRUGINEUS IN EGYPT...111
Chapter 10.
José António Filipe, Manuel Alberto M. Ferreira
SOCIAL AND POLITICAL EVENTS AND CHAOS THEORY- THE
“DROP OF HONEY EFFECT”...126
Chapter 11.
Vítor João Pereira Domingues Martinho
WOMEN EMPOWERMENT IN PORTUGAL: REALITIES, CONSTRAINTS,
POLICIES, STRATEGIES AND INITIATIVES...138
Chapter 12.
Muhammad Zubair Asghar, Aurangzeb Khan, Shakeel Ahmad, Fazal Masud Kundi
PREPROCESSING IN NATURAL LANGUAGE PROCESSING...152
Chapter 13.
Alia Damayanti, Nuraini Fadhilah, Puput Perdana Widiyatmanto EFFECTS OF ETHYLEN DIAMIN TETRA ACETIC ACID ON PHYTOREMEDIATION OF COPPER AND CHROMIUM USING
Yusak Tanoto. Potential of feed-in tariff implementation for residential integrated photovoltaics-grid connected in Indonesia’s residential sector. Emerging Issues in the Natural and Applied Sciences 2013; 3(1), 59-75. DOI: 10.7813/einas.2013/3-1/5
POTENTIAL OF FEED-IN TARIFF
IMPLEMENTATION FOR RESIDENTIAL
INTEGRATED PHOTOVOLTAICS-GRID
CONNECTED IN INDONESIA’S
RESIDENTIAL SECTOR
Yusak Tanoto
Electrical Engineering Department, Petra Christian University (INDONESIA)
E-mails: [email protected],[email protected]
DOI: 10.7813/einas.2013/3-1/5
ABSTRACT
Key words: photovoltaic, techno-economic, urban households, grid connected
1. INTRODUCTION
Utilization of solar power through photovoltaics modules has became significantly increasing over the decades. The environmental protection issue besides its well developed technology has made the utilization of photovoltaic a viable alternatives to meet electricity demand. Solar photovoltaics is starting to play a substantial role in electricity generation in some countries, especially in European countries. Nevertheless, some leading and emerging market in Asia have taken the same path with that in Europe in terms of the role of photovoltaics as large power generation plant. Solar photovoltaics global capacity has increased quite significantly from only 0.6 GW in 1995 to around 100 GW in 2012 (1). Worldwide, 32.340 GW was installed in 2012 alone, when the photovoltaics sector rose by 23% compared with 2011 (2). Due to its reliable performance and long durability, photovoltaics modules can be either installed stand-alone in the remote rural area or grid connected in the location where electricity is easily accessible such as in the city’s building rooftop or residential provided clean energy with relatively free maintenance over its lifespan (3-5). The Feed-in tariff for photovoltaics individual installation was said the most prevalent support mechanism for renewable energy technologies across Europe (6). Nowadays, many countries classified as emerging Asia and even developing Africa introduce the solar feed-in tariff policy (7-9). Despite of technical and economical potential, installation and utilization of photovoltaics in the developing countries particularly in urban residential sector is still quite uncommon due to lack of supporting regulation and other disadvantage conditions.
photovoltaics installation was presented in (11). The study described the design of the installation and system performance data of amorphous silicon PV opearting at prevailing condition. Technical and formal aspect of integrating of photovoltaics in building was discussed in (2). A study intended to provide a simple way for homeowners and developers to explore the financial viability of individual photovoltaics installations was presented in (6). The experimantal results of controlled photovoltaics module for building integrated photovoltaics system was presented in (12). This study intended to improve performance ratio which was caused by partial shadows, temperature effects, inverter losses, thermal losses, and mismatching losses by menas of suitable electronics. Nevertheless, none of aforementioned study and other study explained about technical as well as economical aspect of photovoltaics installation on individual residentials in terms of system’s sizing and cost of energy under the Feed-in tariff mechanism.
2. INDONESIA’S RESIDENTIAL ELECTRICITY
Electiricity power for all customer sectors including residential is supplied by a state owned electricity company called Perusahaan Listrik Negara or PLN. PLN has been responsible for all process of electricity services, of which comprise of generation, transmission, and distribution. As of 2012, the number of PLN’s residential customer was 46.21 million or 92.6% of the total customers. The residential sector consumed 72,130 GWh or 41.45% of the 2012 total national electricity consumption. In Indonesia, PLN’s residential customer are divided into three sub-sectors based on their tariff category, since 1999. The “R-1” category are those with connected capacity up to 2,200 VA whereas “R-2” and “R-3” are those with connected capacity up to 6,600 VA and beyond, respectively (13). The “R-1” category was remained in domination with around 90% of electricity consumption among other categories, particularly in the urban region. With the growth of total number of residential customers from 45.83 million at the end of 2011 to 46.21 million at the end of 2012, the electrification ratio reached around 73.37% at the end of 2012 or increased around 2.14% compared to that achieved at the end of 2011 (14).
3. TECHNO-ECONOMIC ANALYSIS
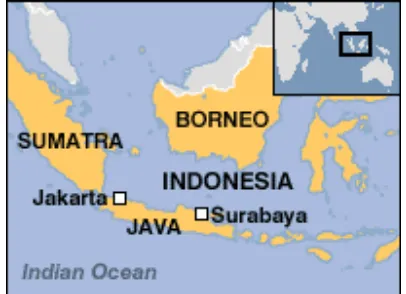
calculate the average daily radiation from the clearness index and vice-versa.The city can be reached either by means of land transportation form all over direction or about one hour flight from Jakarta, the Indonesia’s capital. Part of the map of Indonesia and the location of Surabaya is depicted in Figure 1. Meanwhile, solar resource inputs in terms of monthly averages solar irradiation in kWh/m2/day is used to calculate the photovoltaics array power for
each hour of the year. The monthly averaged daily solar irradiation and corresponding clearness index is presented graphically in Figure 2.
Fig. 1. Location of Surabaya in the Indonesia archipelago map
For the purpose of analysis, three typical residential daily loading pattern model which are representing three residential sub-sector tariff group are considered, i.e. a typical daily loading pattern for residential with 2,200 VA connected capacity, orR1, a a typical daily loading pattern for residential having 3,500 VA connected capacity, or R2, and a a typical daily loading pattern for residential with 6,600 VA connected capacity, or R3. In order to create such patterns, a walkthrough survey has been primarily conducted for several sample houses for each tariff group in urban area of Surabaya. The averaged daily electricity loading curve for R1, R2, and R3 residential sub-sector is shown in Figure 3. The generated loading curve have neglected the seasonal variation as well as weekend loading condition.
Fig. 3. The survey based-averaged daily electricity loading curve for R1, R2, and R3 residential sector in Surabaya, Indonesia
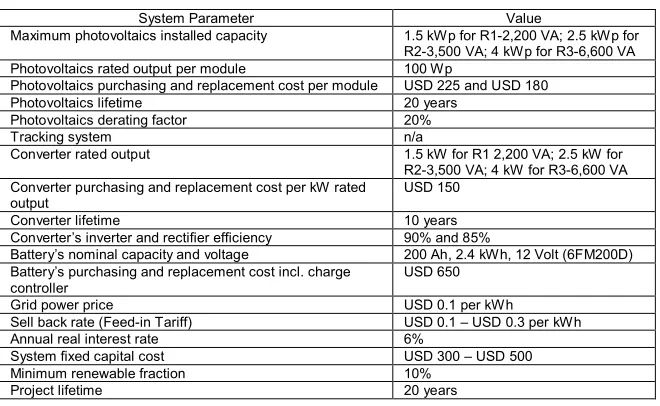
Table 1. Some important technical and economic simulation system parameters
System Parameter Value
Maximum photovoltaics installed capacity 1.5 kWp for R1-2,200 VA; 2.5 kWp for
R2-3,500 VA; 4 kWp for R3-6,600 VA
Photovoltaics rated output per module 100 Wp
Photovoltaics purchasing and replacement cost per module USD 225 and USD 180
Photovoltaics lifetime 20 years
Photovoltaics derating factor 20%
Tracking system n/a
Converter rated output 1.5 kW for R1 2,200 VA; 2.5 kW for
R2-3,500 VA; 4 kW for R3-6,600 VA Converter purchasing and replacement cost per kW rated
output USD 150
Converter lifetime 10 years
Converter’s inverter and rectifier efficiency 90% and 85%
Battery’s nominal capacity and voltage 200 Ah, 2.4 kWh, 12 Volt (6FM200D)
Battery’s purchasing and replacement cost incl. charge
controller USD 650
Grid power price USD 0.1 per kWh
Sell back rate (Feed-in Tariff) USD 0.1 – USD 0.3 per kWh
Annual real interest rate 6%
System fixed capital cost USD 300 – USD 500
Minimum renewable fraction 10%
Project lifetime 20 years
large solar generation stations under a Feed-in tariff mechanism at USD 0.25 to USD 30 per kWh, as to comply with recent regulation issued by government. In addition, the minimum renewable fraction is imposed in the simulation in order to allow supply from photovoltaics as well. Here, a distinct control scheme in terms of how photovoltaics dispatch electricity in a minimum of 10% house’s required energy is applied by HOMER. Figure 4 depicts a HOMER system architecture for household with 2,200 VA power connected capacity whereas the remaining model for R2 and R3 are similar except a difference appeared on daily energy requirement.
Fig. 4. HOMER system architecture for household with 2,200 VA power connected capacity
process, every system configuration in the search space is simulated and the feasible ones are displayed in a table, sorted by net present cost.
4. RESULT AND DISCUSSION
Based on the predetermined conditions and constrains, simulations are carried out for each tariff group with respect to various sellback rate, which represents the possible amount of feed-in tariff. Either optimictic or pesimistic scenarios of feed-feed-in tariff implementation is reflected in the proposed amount of sellback rate. Figure 5 to Figure 7 shows HOMER simulation result in terms of photovoltaics optimal sizing along with their incured life cycle cost with respect to corresponding sellback rate, for R1 to R3 system, respectively. From the simulation, the higher the sellback rate, i.e. the amount of feed-in tariff, the more photovoltaics modules are sugested to be installed, resulting in a lower cost of energy over the project lifetime. Although the initial capital required could be consequently higher, the operational cost as well as the total net present cost would be substantially decreased. The system performed a shortage free condition with all demand could be fullfiled, provided no battery is required in these cases. It could be theoriticaly possible as long as the grid supply are secured over the year.
Fig. 6. HOMER optimization result in terms of sizing and cost of the R2-3,500 VA system
Fig. 7. HOMER optimization result in terms of sizing and cost of the R3-6,600 VA system
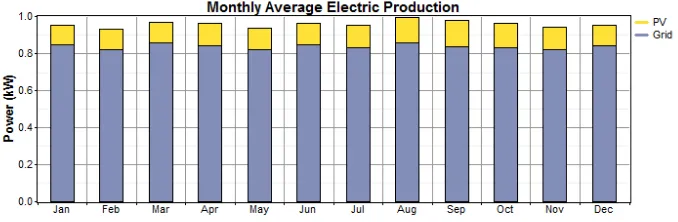
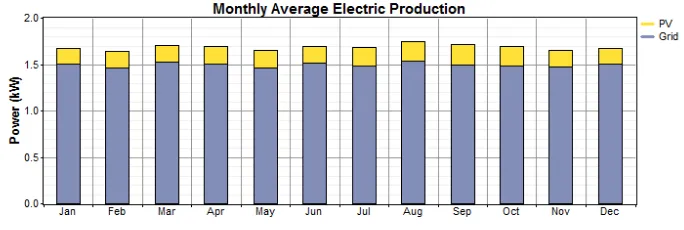
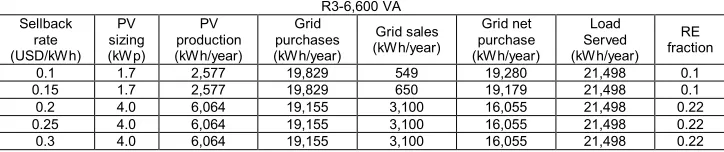
Figure 8 to 10 shows the proportion of monthly average electricity production by grid and photovoltaics for R1 to R3 with respect to a USD 0.1/kWh sellback rate and corresponding optimal photovoltaics sizing. We can see that the relatively high proportion from solar energy is achieved on August, September and October due to consecutively three month high in daily solar radiation.
Fig. 9. R2-3,500 VA monthly average electricity production with 1.1 kW photovoltaics installed capacity
Fig. 10. R3-6,600 VA monthly average electricity production with 1.7 kW photovoltaics installed capacity
Table 2. Electricity consumption and production for R1-2,200 VA
Table 3. Electricity consumption and production for R2-3,500 VA
R2-3,500 VA
Table 4. Electricity consumption and production for R3-6,600 VA
R3-6,600 VA
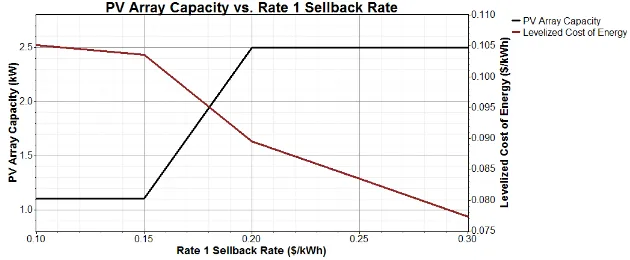
Fig. 11. Sensitivity analysis graph of photovoltaics capacity vs sellback rate superimposed to cost of energy for R1-2,200 VA
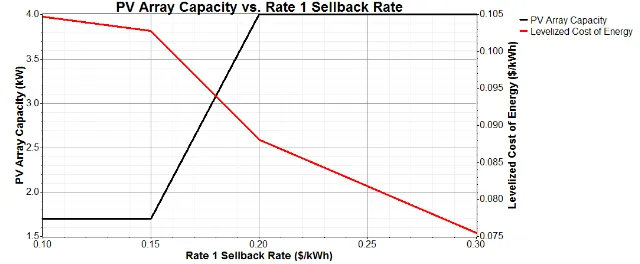
Fig. 13. Sensitivity analysis graph of photovoltaics capacity vs sellback rate superimposed to cost of energy for R3-6,600 VA
From Figure 11, we can see that the levelized cost of energy of USD 0.098/kWh could be achieved by having 1.2 kW photovoltaics array installed capacity under a sellback rate of USD 0.18/kWh. Similarly, for R2 and R3 cases, the cost of energy that could be obtained are USD 0.095/kWh and USD 0.094/kWh, respectively, provided 1.95 kWp and 3.1 kWp photovoltaics array installed under a sellback rate of USD 0.18/kWh. From this case study, we can infer that all tariff group could possibly obtain lower cost of energy compared to that achieved by the load having a sole connection into the grid without a photovoltaics supply. The interesting finding include the same sellback rate for all tariff group as well as similar cost of energy provided different photovoltaics installed capacity.
of power from solar photovoltaic power projects in Indonesia which require developers to bid in capacity quota tenders; and (ii) feed-in-tariff for solar photovoltaic power projects at the cap of USD 0.25/kWh, or USD 0.30/kWh if the photovoltaic module contains 40% or more local components. However, the regulation is applicable for considerably large solar power plant generation only. In the case of residential-photovoltaics integrated-grid connected, the regulations could be of that combination between fiscall incentives and energy price policy, of which proposing to encourage the deployment of photovoltaics modules among domestic dan residential sector on the voluntary basis. The energy price subsidy, on the other hand, can be converted into a kind of subsidy to support photovoltaics modules procurement and deployment while other possible mechanisms are yet opened to be discussed to bring the residential photovoltaics integrated-grid connected, which is relatively expensive in initial capital into the implementation under the feed-in tariff.
5. CONCLUSION
The preliminary assessment in terms of technical and economical aspect of feed-in tariff potential for residential sector is presented in this work. The mechanism is focuced on the implementation of residential integrated photovoltaics-grid connected in the urban residential sector in Indonesia. From the simulation, it is found that the feed-in tariff mechanism could be potentially technically and economically viable as the cost of energy can be relatively lower that achieved by the conventional condition with support by a proven photovoltaics technology. The next callenge is deal with the relevant policy and regulation that is needed to encourage the utilization of such system under the feed-in tariff mechanism.
REFERENCES
2. T. Schuetze (2013). Integration of Photovoltaics in Buildings-Support Policies Addressing Technical and Formal Aspects. Energies, 6, 2982-3001.
3. T. James, A. Goodrich, M. Woodhouse, R. Margolis, and S. Ong (2011). Building-Integrated Photovoltaics (BIPV) in the Residential Sector: An Analysis of Installed Rooftop System Prices. NREL Technical Report-6A20-53103, Colorado, United States.
4. L.Y. Seng, G. Lalchand, G.M. Sow (2008). Economical, environmental and technical analysis of building integrated photovoltaic systems in Malaysia. Energy Policy 36 (6), 2130–2142.
5. T. Meyer (2004). Photovoltaic Energy: Stand-Alone and Grid-Connected System. Reference Module in Earth Systems and Environmental Sciences, 35-46.
6. J. Hart (Photovoltaic Installations in the Domestic Sector: A Model of the Environmental and Economic Implications of the Proposed UK Feed-in Tariff Scheme. http://
www.iema.net/system/files/jessica20hart.pdf . Date
accessed: October 7, 2013.
7. PV-Magazine.com. Feed-in tariffs (FITs). http://www.pv- magazine.com/services/feed-in-tariffs/feed-in-tariffs-for-various-countries/ Date accessed: October 8, 2013.
8. W.Y. Teoh, S.Y. Khu, C.W. Tan, I.H. Hii, and K.W. Cheu (2012). Technoeconomic and Carbon Emission Analysis for a Grid-Connected Photovoltaic System in Malacca. ISRN Renewable Energy 2012, 1-8.
9. D. Lavansiri (2013). Updates on the Feed-in Tariff Scheme in Thailand. http://www.engerati.com/on-demand/updates-feed-tariff-scheme-thailand/2415. Accessed on: October 23, 2013.
11. R. Ruther, M.M. Dacoregio (2000). Performance assessment of a 2 kWp grid-connected, building-integrated, amorphous silicon photovoltaic installation in Brazil. Progress in Photovoltaics: Research and Applications, 8 (2), 257-266.
12. S. Ubertini and U Desideri (2003). Performance Estimation and Experimental Measurements of a Photovoltaic Roof. Renewable Energy, 28, 1833-1850.
13. Y. Tanoto and M. Praptiningsih (2013). Factors decomposition of Indonesia’s Household Electricity Consumption. Engineering Journal, 17 (2), 19-28.
14. S. Corporate (2013). PLN Statistics 2012. PT. PLN (Persero), Jakarta, Indonesia.
15. T. Lambert, P.G. Gilman, and P. Lilienthal (2006).
Micropower System Modeling with HOMER.
http://www.pspb.org/e21/media/HOMERModelingInformatio n.pdf. Date accessed: April 12, 2008.
16. Y. Tanoto, M. Santoso, C. Massay (2013). Off Grid Fully Renewable Energy with Free Capacity Shortage for Remote Electrification. The Proceeding of 7th IEEE International Power Engineering and Optimization Conference, 3-4 June 2013, Langkawi, Malaysia.
17. A.M.A. Haidar, P.N. John, and M. Shawal (2010). Optimal Configuration Assessment of Renewable Energy in Malaysia. Renewable Energy, 36, 881-888.