MONMORILLONITE NANOCOMPOSITE
EVI YULIANTI*
Center for Science and Technology of Advance Materials, National NuclearEnergy Agency (BATAN), Kawasan Puspiptek Serpong, Tangerang, 15314,
SUDARYANTO
Center for Science and Technology of Advance Materials, National NuclearEnergy Agency (BATAN), Kawasan Puspiptek Serpong, Tangerang, 15314,
The effects of plasticizer addition to solid polymer electrolyte based on chitosan monmorillonite nanocomposite containing lithium salt have been studied. Ethylene glycol as plasticizer is an additive with low molecular weight expected to influence intrinsic polymer properties. A plasticizer also tends to dissociate ion pairs into free cation and anion which leads to an overall enhancement conductivity. The purpose of the research is to determine optimal composition of plasticizer addition to obtain good solid polymer electrolyte. The plasticizer within the range of 0 ≤ x ≤ 75% w/w was added into
chitosan monmorillonite nanocomposite. The mixture then was casted by slow evaporation in order to obtain thick film of solid electrolyte. The sample characterizations involve ionic conductivity measurement by LCR meter, crystal structure by an X-ray Diffraction, thermal analysis by a Differential Scanning Calorimetric and mechanical properties by a Universal Testing Machine. The results show that the addition of 50% w/w plasticizer could increase the ionic conductivity from
∼10-9 S/cm until 2.26 x 10⁻⁴ S/cm and the polymer elasticity increase from 11.2% until
77.5% elongation break. The x-ray diffraction analysis showed that plasticizer addition make polymer more amorphous. It is concluded that the addition of plasticizer has improved the electrical and mechanical properties of the solid polymer electrolyte.
Keywords : nanocomposite, polymer electrolyte, chitosan, plasticizer
1. Introduction
Nowdays solid polymer electrolytes (SPEs) have attracted considerable attention
because of their technological aspects which is widely used in energy storage
components such as batteries, fuel cells, supercapacitor and a hybrid energy
source [1,2]. SPEs is formed by dissolving salt in a macromolecule, typically
such as poly(ethylene oxide) PEO, poly methyl metacrylate (PMMA), chitosan,
etc. The solid polymer electrolyte membrane is the key component of polymer battery that has to fulfill a series requirement, including good mechanical properties (to assure easy battery fabrication, high ionic conductivity, high lithium ion transport, wide electrochemical stability, low cost and benign chemical composition (to be environmentally friendly). Unfortunately, it is not an easy task to achieve those requirements and until now SPEs still have low ionic conductivity at ambient temperature that acts as barrier to their utility [3,4]. To overcome these problems, the realization of single ion conduction is good alternative and development of polymer nanocomposite electrolyte (PNCEs) by using layered silicate clay meets these criteria. Polymer nanocomposite electrolyte was prepared by dispersing the ceramic material such as : SiO2, Al2O3,
and clay (bentonite , monmorillonite) into a complex matrix of polymers and salts [5-8] . The idea of composite formation by dispersing the ceramic or clay materials is an attractive approach to improve stability properties by modifying (i) the local structure / morphology (ii) crystallinity degree (iii) the glass transition temperature (iv) the flexibility of the polymeric segment (v) the chemical properties of the filler particles and (vi) the interaction between heterogeneous systems of filler, salt and polymers [9].
Generally, the ionic conductivity of PNCE usually lies in the range 10-7 to 10-5
S/cm at ambient temperature. Almost all composites polymer electrolyte posses inherent obstacle which come up of their partial crystalline nature that impedes their overall ionic conductivity and in that way impose limitation on their application [3, 9-13].
In order to overcome these limitations and to increase the ionic conductivity of PNCE without affecting their stability is plasticizing the composite polymer electrolyte with small organic molecules such as ethylene carbonate (EC), propylene carbonate (PC), ethylene glycol (EG), glycerol, etc. which have high dielectric constant and low vapour pressure [14]. These plasticizers helps in improving the ionic conductivity of PNCE by (i) increasing the amorphous content of polymer electrolytes, (ii) dissociating ion pairs into free cations and anions which leads to an overall enhancement conductivity, (iii) increasing the flexibility in the polymeric segment, (iv) significant change in local structure/microstructure, (iv) lowering the glass transition temperature, Tg [9]. The plasticizer addition can increase in the ionic conductivity of 1-2 orders of magnitude and a decrease of Tg values by 40°C of plasticized polymer
obtained that chitosan plasticized with 50 wt% of ethylene carbonate and 10 wt% of oleic acid showed the ionic conductivity of 10-5 S/cm. [17,18].
In this work, new composite polymer electrolyte based on chitosan are presented. The samples of PNCEs film based on chitosan containing monmorillonite and LiClO4 were plasticized with ethylene glycol, and the
influence of this additive to the properties of PNCEs films is investigated.
2. Methodology
2.1. Materials
Chitosan (CS) from crab shells with low molecular weight used in this work was purchased from Bogor Agricultural Institute Laboratory. This chitosan was obtained by deacetylation of chitin and it had a degree deacetylation of 86%. Glacial acetic acid (HAc) obtained from Merck was used as the solvent of chitosan, monmorillonite K 10 (MMT) as a filler, and LiClO4 as lithium salt source, both of them purchased from Sigma Aldrich and Ethylene glycol (EG) as plasticizer purchased from Merck.
2.2. Preparation of Composite
Chitosan solution was prepared by dissolving chitosan (CS) in a 1% (v/v) aqueous acetic acid solution at a concentration of 4 wt% . The mixture was stirred continuously with a magnetic stirrer until chitosan powder has completely dissolved in the acetic acid solution. Monmorillonit (MMT) was first swelled by 10% (w/v) LiClO4 solution, then the plasticizer ethylene glycol was added with
composition 10 wt%, 25 wt%, 50 wt% and 75 wt% and stirred for 1 hour. After that, each mixed solution is added to 100 ml chitosan solution and stirred for 10 hours. Then, MMT/CS/LiClO4/plasticizer solution was casted on a petri dish at 50°C for 48 hours until solvent free film were obtained. The films were kept in
the desiccator for further drying.
2.3. Materials Characterization
Kα radiation ( λ= 1.5418 Å) in the 2θ (Bragg angles) range 5 ≤ 2θ ≤ 65 at scan
speed 3° per minute. Differential Scanning Calorimetry (DSC) studies of
different plasticized polymer films were carried out with a DSC unit (Perkin Elmer).
3. Result and Discussion
3.1. Ionic Conductivity
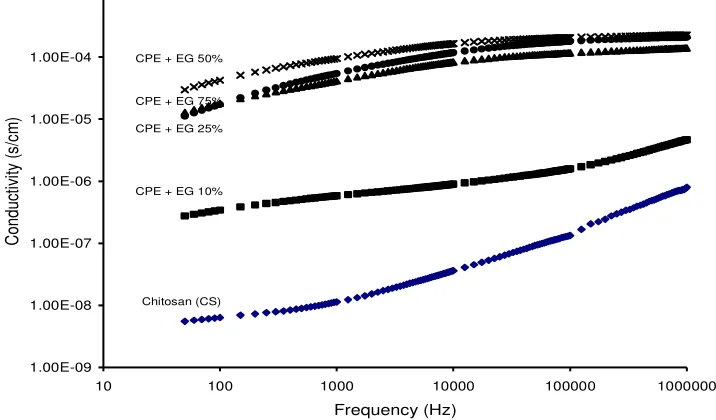
Figure 1 shows the variation of ionic conductivity (σac) with frequency for
different concentration of ethylene glycol at room temperature for CS + 2wt.% MMT + 40 wt.% LiClO4 + x wt.% EG. The ac conductivity patterns show a frequency independent plateau in the medium frequency region. From the graph it can be seen that the conductivity of polymer films undergo significant changes. The ionic conductivity of plasticized composite polymer film is higher than unplasticized polymer film (CS). The ionic conductivity starts increase at EG (x = 10%) until x = 50%. But at x = 75% the ionic conductivity values is not increase anymore, but tends to decrease significantly. It can be concluded that the optimum addition of plasticizer is 50 wt% for the CS/MMT/LiClO4 composite polymer system(PNCE). Referring to previous research by Yulianti, E. et. al [19] the ionic conductivity value of unplasticized CS/MMT/LiClO4 was 2.38 x 10⁻⁵ S/cm and in this work is obtained the ionic conductivity of plasticized
composite polymer is 2.26 x10⁻⁴ S/cm increased by 1 orde, with 50 wt.% plasticizer addition.
10 100 1000 10000 100000 1000000
Frequency (Hz)
Figure 1. Variation of a.c conductivity with frequency CS + 5 wt.%MMT
Plasticizer tends to dissociate ion pairs into free anions and cations, so the amount of moving ion into the system is increased. Therefore the ionic conductivity for plasticized composite polymers were higher than unplasticized ones. Plasticizer addition also increased the flexibility of composite polymer so that ions movement in the polymer matrix become more freely [9]. The plasticizer addition also made polymer more amorphous, and this phenomena can be seen from the X-ray diffraction pattern of CS/MMT composite film in Figure 2.
3.2. X-ray diffraction
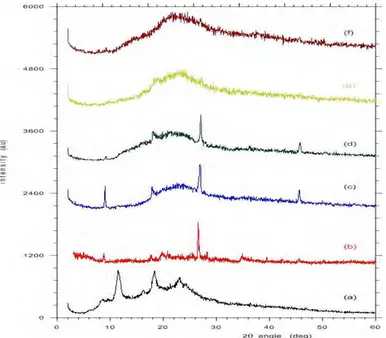
The XRD patterns for composite polymer electrolyte based on chitosan with different plasticizer concentrationare shown in Figure 2. The XRD pattern has typical features namely a background hump followed by several characteristic peaks that are attributed to the host polymer (i.e., chitosan). This agrees with the result of Agnieska et al. [9,14] and indicates that the solid polymeric films are composed of a combination of crystalline and amorphous phases. Crystalline phase is characterized by the peak at position 2 θ angle of
11.97 ° and 18.52 °, not sharp but wide peak which indicates the presence of
amorphous phase. Further, the appearance of small peak at at 2 θ angles ∼° 27.05
may possibly be related to the existence of SnO2 that is contained in monmorillonite [19]. This suggests that the diffraction peaks of composite polymer electrolyte (PNCE) films are of composite nature.
The addition of ethylene glycol plasticizer brings substantial changes in the diffraction pattern of the composite polymer electrolyte with the increasing concentration of the plasticizer as observed in Fig 2(c) – (d). The main XRD peaks (due to chitosan) at 11.97 ° and 18.52 ° almost disappear and significant
broadening with plasticizer addition. On the addition of ethylene glykol (EG) plasticizers up to 50% only one peak of chitosan at 18.52 ° is visible, whereas
the addition of 75% plasticizer, the peak had disappeared and have maximum broadening, that suggest that the sample with EG = 75% has maximum disorder, shows the increasing amorphous phase in the polymer composite systems. Peak SnO2 of monmorillonite at ∼° 27.05 at EG = 10% and 25% is still visible, while
affects its ability to disrupt hydrogen bonding of chitosan chains. Plasticizer reduces the intermolecular force of polymer chains, therefore there is a larger space for the ions (i.e. lithium ions) to move, thereby the ionic conductivity of the PNCE system will be increase as shown in Figure 1.
Figure 2. X-ray diffraction pattern of PNCE thin film with different concentration (x) of EG (a) chitosan, (b) monmorillonite, (c) x = 10% (d) x = 25% (e) x= 50% and (f) x= 75%.
3.3. Differential Scanning calorimetry
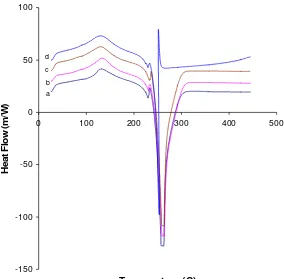
The thermal properties curves for of the composite polymer electrolyte (PNCE) system at various plasticizer concentrations measured by DSC are shown in Figure 3 over a wide range of temperature i.e., 30 to 450°C. In Figure 3 shows
an endothermic peak which is melting temperature of PNCE crystalline fraction containing plasticizers which starts at onset temperature around 120°C. The
polymeric segment, that is also convinced by the mechanical properties data of
the PNCE film (i.e., the elongation break curve) that shows the PNCE films
become more elastic with the higher concentration of plasticizer. These results
are also consistent with measurements of X-ray diffraction pattern which shows
the broadening of the peak which means higher amorphous fraction in PNCE
with increasing concentration of plasticizer.
-150 -100 -50 0 50 100
0 100 200 300 400 500
Temperature (C)
H
eat
Fl
ow
(
m
/W
)
a b c d
Figure 3. DSC curve of PNCE in temperature range 30 to 450°C with different
concentration of EG (a) x = 10%, (b) x = 25% (c) x= 50% and (d) x= 75%
3.4. Mechanical Properties
Tensile strength
andelongation breakpercentage were veryimportantto
explainhowthe mechanicalcharacteristicsofthematerial͘
Tensile strengthvalues
measuredto determine theextent to whichthe membranereacts tothepull
force͘ W
lasticizeris a material that can make polymer material becomesmore
elastic if it was added͘
The addition of this plasticizer is needed toovercome the
stiffnessproperties ofchitosanͲ
basedfilms͘
With theaddition ofthe plasticizer
inthepolymerchainsof chitosancauses inter-polymerbondĐĂŶ
be damaged
and made polymer more plasticity and flexibly. Mechanicalproperties data of
PNCEaddedplasticizersethyleneglycolare shownin Figure4
andFigure5͘
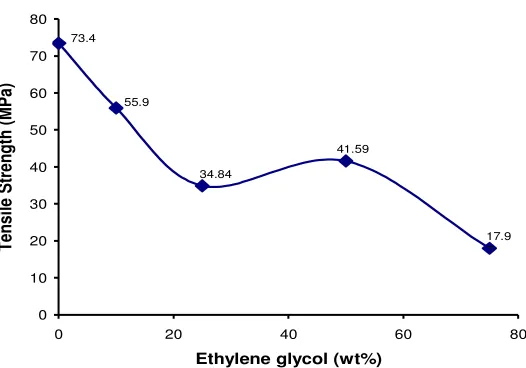
Figure 4. Tensile Strength curve of PNCE with different plasticizer concentration (x) (x= 0, 10%, 25%, 50% and 75%)
In Figure 4 it can be seen that the tensile strength of PNCE decreased with the increasing of plasticizer concentration. The unplasticized PNCE have tensile strength value 73.4 MPa, while the plasticized film with x = 10% is decreased to 55.94 MPa, and with x = 25% also decrease to 34.84 MPa. However, the plasticizer addition of 50% caused the tensile strength increased to 41.59 MPa, but at x = 75% PNCE the strength decreased again to 17.97 MPa.
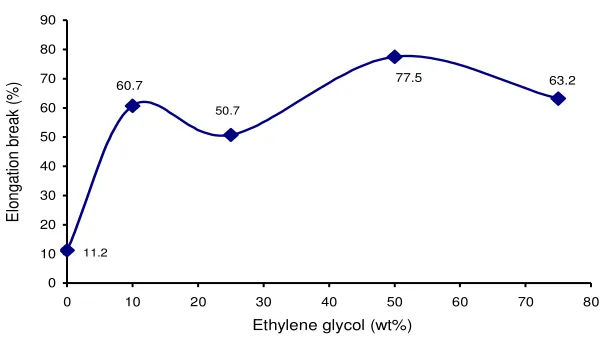
PNCE film. The addition of plasticizer ethylene glycol was increase the elongation break of the PNCE films. The unplasticized PNCE film is inflexible and only has elongation break percentage 11.2%. The addition of plasticizer at composition 10 wt% has increased elongation break significantly until 60.7%, but at plasticizer concentration 25% little bit decrease to 50.7%. The highest elongation break value 77.5% is achieved at plasticizer concentration 50%. From the Figure 4 and 5 it can be seen that the optimum mechanical properties of PNCE films is achieved at plasticizer concentration of 50 wt%.
0
Figure 5. Elongation break curve of PNCE films with different plasticizer concentration (x)
(x= 0, 10, 25, 50, and 75 wt%)
4. Conclusion
References
1. Yuan, X.Z., Wang, H., Song, C., Zang, J., Electrochemical Impedance Spectroscopy in PEM fuel cells. Springer London Dordrecth Heidelberg, New York. 2009
2. C. Polo Fonseca, S. Neves, Journal of Power Sources 159 (2006) 712-716
3. W.A.V. Schalkwijk, B. Scrosati, Advances in Lithium –Ion batteries, Kluwer Academic Publishers, New York, 2002
4. C. Sequeira and D. Santos, Polymer Electrolytes, fundamentals and Applications, Woodhead Publishing, Philadelphia (2010)
5. A. Usuki, Y. Kojima, M. Kawasumi, A. Okoda, Y. Fukushima, T. Kurauchi, J. Materials Research, 8, 1179, (1993)
6. J.E. Weston, B.C.H. Steele, Solid State Ionics, 7, 81, (1982)
7. Z. Shen, G.P. Simon, Y.B. Cheng, Poly. Engi. Sci., 42, 2369 (2002)
8. M. Kurian, M.E. Galvin, P.E. Trapa. D.R. Sadoway, A.M. Meyes, Electrochimica Acta, 50, 2125 (2005)
9. D.K. Pradan, B.K. Samantaray, R.N.P. Choudary, A.K. Thakur, Journal of Power Sources 139 (2005) 384-393
10. D.K. Pradhan, R.N.P. Choudary, B.K. Samantaray, Int. J. of Electrochem. Sci., 3 (2008) 597-608
11. Brinkmann, D., Gang, W., Croce, F., Scrosati, B., Solid State Ionics 53-56 (1992) 1202
12. Krawiec, L.W., Scanlon, L.G., Fellner, J.P., Vaia, R.A., Vasudevan, S., Giannelis, E.P., J. Power Sources 54 (2) (1995) 310
13. Leo, C.J., Subbarao, G.V., Chowdari, B.V.R., Solid State Ionics 148 (2002) 159 14. A. Pawlicka, M. Danczuk, W. Wieczorek, E.Z. Monikowska, , J. Phys. Chem. A.
2008, 112, 8888-8895.
15. MacFarlane, D.R., Sun, J., Meakin, P., Fasoupoulos, P., Hey, J., Forsyth, M., Electrochim. Acta 1995, 40, 2131
16. Forsyth, M., Meakin, P.M., MacFarane, D.R., Electrochim. Acta 1995, 40 2339 17. Yahya, M.Z.A., Arof, A.K. Eur Polym J. 2003, 39, 897
18. Khiar, A.S.A., Puteh, P., Arof, A.K. Physica B 2006 373