Proceedings of the 2007 Asian Physics Symposium (APS 2007) ISBN 978-979-17090-1-9 November 29 – 30, 2007, Bandung, INDONESIA
D22.1
CSAMT AND DC-RESISTIVITY SURVEY FOR GROUNDWATER AND
STRUCTURAL INVESTIGATION:
APPLICATION TO EASTERN BANDUNG BASIN, INDONESIA.
Asep Harja1,2., Wahyu Srigutomo1 , Enjang Jaenal Mustafa 1 ,Doddy Sutarno1
1
Physics of Complex System, Faculty Of Mathematics and Natural Sciences, ITB,, Jl. Ganesha No. 20 Bandung 40132
2
Department of Physics, Universitas Padjadjaran Jl. Jatinangor Km 21 Sumedang 45363
Groundwater is a strategic resource which is increasingly threatened by human activities. Saving this precious resource demands sound knowledge of the subsurface, of the equilibrium between exploitation and recharge processes. In this case history from Eastern Bandung basin, we demonstrate the use of resistivity data from CSAMT and DC-resistivity to describe groundwater and structure. CSAMT and DC Resistivity surveys were conducted for groundwater investigation in area of Eastern Bandung Basin. Data were collected using CSAMT scalar measurement and DC resistitivty 2D multi-channel acquisition system. From the interpretation results, we correlate resistivity structure of CSAMT and DC-resistivity. It is revealed that the subsurface resistivity structure of the investigated area can be represented as shallow structure from DC resistivity and deep structure from CSAMT. Resistivity structure can indicate layering of sediment near the surface and deep structur. Based on the interpreted resistivity structure, we obtain information on shallow and deep distribution of groundwater.
Keywords: Groundwater, DC-resistivity, CSAMT, Sructure Resistivity.
I. INTRODUCTION
Subsurface models of the earth obtained from a combination of two or more geophysical methods are likely to be more reliable than models obtained from any single method. Modeling different data sets by combination or integration is increasingly being used in recent years so as to allow for more confidence in the derived models and to reduce the ambiguity in interpretation. The subject of ambiguity of interpretation in geophysics is comprehensively dealt with in a classic paper by Roy (1962). Due to the inherent ambiguities in geophysical methods, an integrated approach involving two or more techniques is recommended. Similar to other geophysical methods, electrical (E) and electromagnetic (EM) methods also suffer from ambiguity in interpretation due to the phenomena of the ‘principle of equivalence’, especially for thin middle layer problems (Patra and Mallick, 1980; Zhdanov and Keller, 1994).
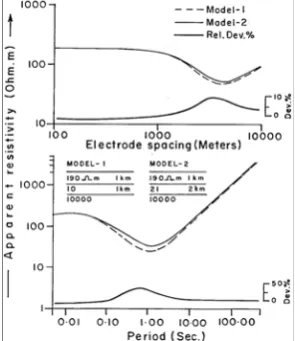
As both methods depend on the same physical property, namely the electrical conductivity, conductivity variation with depth should be reflected in the measurements of both methods at least with varying response in different ways. For two simple models (1 and 2) of three layers each with a conductive middle layer (Figure 1)(Harinarayana,1999). The thickness of the middle layer is 1 km for model-1 and 2 km for model-2. Both MT and DC responses are computed for these models and the relative deviation is plotted. As can be seen from the figure, the maximum relative deviation in apparent resistivity curve in DC is about10%, whereas it is about 50% in MT. The detectability of the middle layer is easier using MT than using DC. Similarly, one can have models in which the DC apparent resistivity can show a large deviation compared to MT, especially for resistive middle layers. Therefore, to detect a middle layer in certain cases can be a problem when applying a single method alone. Thus, joint use
of both methods in principle should give better estimates of the basin subsurface parameters.
Figure 1. Figure 1. DC and MT apparent resistivity curves for two models and their relative deviation with respect to Model 1. Due to an equivalence problem, there is a small deviation in DC (top) and for the same model there is a large deviation for MT (bottom).(Harinarayana,1999)
Proceedings of the 2007 Asian Physics Symposium (APS 2007) ISBN 978-979-17090-1-9 November 29 – 30, 2007, Bandung, INDONESIA
D22.2
Groundwater resources of Bandung basin as urbanised areas are increasingly threatened by human activities, which can pollute recharge areas or even lead to an over exploitation. Saving these precious resources requires a careful management and legislation. Often the management is subdivided obeying administrative boundaries, while groundwater reservoirs obey to natural boundaries and conditions.
Electrical and electromagnetic methods are the most popular of all the geophysical methods as far as groundwater exploration. high level cultural noise, which are encountered in Bandung urban and suburban areas. The DC-Resistivity method was used due to its affectivity and free from cultural noise (Parasnis,D., 1983; Vogelsang, 1995)with shallow depth . CSAMT have used for the deep layer with depth until 2 km.
The DC-Resistivity method with multichanel system and CSAMT were used to detect subsurface structures, which is particularly useful to investigate the deeply buried groundwater aquifers.
Accordingly, analysis of resistivity structure which is correlated with hydrogeological system (aquifer and reservoir) allow us to obtain information on distribution of groundwater flow, water table and zone of high flood potential as well as drain zone. As study area of groundwater investigations using DC-resistivity and CSAMT were selected in area of Eastern Bandung Basin (the survev location, Figure 1).
Figure 1. Survey Location (Google earth)
II. DC-RESISTIVTY AND CSAMT METHODS
DC-Resistivity
DC-Resistivity survey technique (Koefoed, O., 1968) was used in an attempt to delineate and map the extent of possible groundawater dan mineral resource. The Sounding and the mapping surveys were carried out in 5 lines between December 2005 and Februari 2006 using 2D-multichannel DC Resistivity measurement method involving 28 electrode and using Wener-Schlumberger confi-guration system. The measuring equipment consisted of Supersting R8/IP multichannel manufactured by AGI USA.
The formulation generally use to calculate apparent resistivity for any configuration are:
I
The main task of the DC-Resistivity survey is to delineate the depth of the saturated sandstone and limestone stratum, which represents the main groundwater reservoirs in Eastern Bandung basin area. As mentioned earlier, the survey area is characterized by high-thick sedimentation. To overcome this problem and to meet the main goals of this study, especial field configuration for DC -Resistivity data acquisition was applied. 2D-Data Acquisisiton with Wener-Schlumberger confi-gurations are used in this survey. The electric dipole transmitter length reaches 810m, and 28 electrode with the distance between the electrode is up to 30 m.
Moreover a source current of 1 Ampere was used, this can reduce the effect of the uppermost conductive layer, which is also encountered in Bandung basin area.
CSAMT
Basic theoretical principle for CSAMT theory can be described in terms of Maxwell’s equations. The general solutions of a tangential component of electric field (Eφ) and a radial component of magnetic field (Hr) from equations are expressed
in cylindrical coordinates6) as
(
)
where dl is the dipole length, r is the source-sounding distance, and Im and Km are modified Bessel function of the m-th order.
From equations (3) and (4), it is evident that the relative strengths of these components are dependent upon r, media properties and frequencies. Media properties and frequency determine the skin depth δ. We can visualize the functional dependence of equations (3) and (4) as the ratio of r to δ, that is According to the characterization of the induction number, there are three regions of propagating electromagnetic (EM) field in CSAMT method. The region near the transmitting dipole is electrically characterized by small induction (|kr| <<1) known as “near-field” zone. The region far from transmitting dipole is electrically characterized by large induction number (|kr|>>1) known as “far-field” or “plane-wave” zone. The region between these zones is called “transition” zone.
III. THE RESULTS AND INTERPRETATION
Proceedings of the 2007 Asian Physics Symposium (APS 2007) ISBN 978-979-17090-1-9 November 29 – 30, 2007, Bandung, INDONESIA
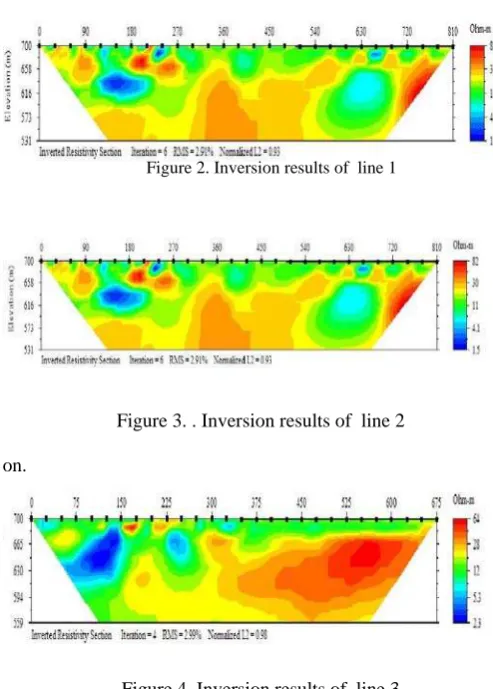
D22.3 consisting of clay and alluvial deposits. The resistivity value range from 4 to 20 Ohm.m possibly suggest as impermeable zone. The upper zone is underlain by high resistivity zone (15-40 Ohm.m) indicating sandy clay with some sand lenses (resistivity <10 Ohm.m); it has a thickness about 50 m until 80 m, possibly suggest as reservoir and fresh water. The lower most part of the model shows a high resistivity values more than 40 Ohm.m due to tuff and volcanic rocks. At the South-west from marginal of basin (Figure 2 to 5), the depth of impermeable layer (clay) increase with distance. This indicate increasing the depth of aquifer and reservoir.
Figure 3. . Inversion results of line 2
on.
Figure 4. Inversion results of line 3
sedimentation near to margin of the basin with about 20 m in depth and resistivity between 10 to 20 Ohm.m. The second layer suggest as aquifer, Indicated by increasing in depth of first layer to center of the basin at southern. Some lenses appear with 15-30 meter in depth suggest as reservoir and possibly as fresh water.
More southern and same direction with line 3 is line 4 (figure 5). This line has 432 m in length and cross section of resistivity shows that first layer (10-20 Ohm.m ) is very thick about 132 meter. This layer suggest as clay without
groundwater reservoir. This area is possible as centre of basin, because at northern that is line 5 (figure 6) also shows that first layer increase with increasing distance from margin of the basin.
Figure 5. . Inversion results of line 4
Figure 6. . Inversion results of line 5
Figure 7. Groundwater Occurrence (Kashef, 1987)
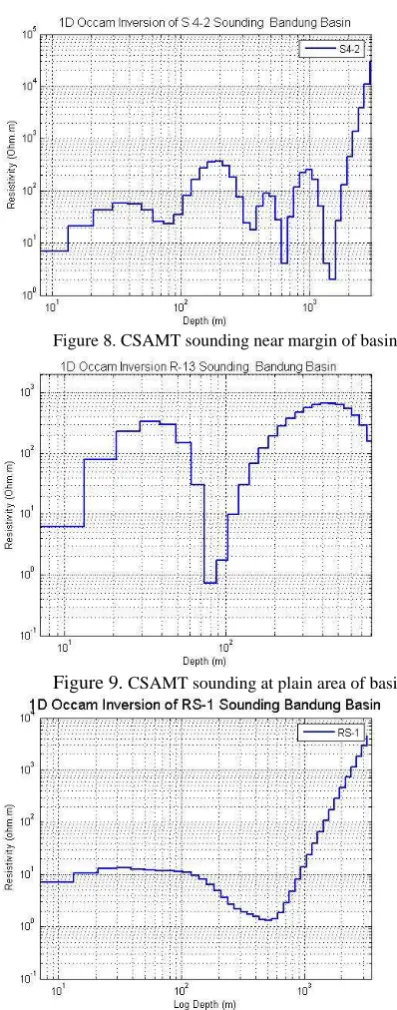
The results of DC-resistiviy inversion are similarly with 1D Occam’s inversion of CSAMT (Figure 8 to 9). Three sounding point with scalar CSAMT survey show that resistivity near basin marginal indicate thin layer of conductive sediment (Figure 7). Based on generalation of groundwater occurrence (Figure 8) Longer distance from basin marginal (Figure 9) and at near of basin center, deeper impermeable area increase. Alteration of permeable (15-40 Ohm.m)and impermeable layers (0-15 Ohm.m) from 1D Occam inversion CSAMT is indicative of high variability in depositional setting . The interpretation of the resistivity data in near central part of the plain (Figure 10) indicates a continuous low-resistivity.
Proceedings of the 2007 Asian Physics Symposium (APS 2007) ISBN 978-979-17090-1-9 November 29 – 30, 2007, Bandung, INDONESIA
D22.4
Figure 8. CSAMT sounding near margin of basin
Figure 9. CSAMT sounding at plain area of basin
Figure 10. CSAMT sounding at in near central part of the basin
IV. CONCLUSIONS
The interpreation results, it is revealed that the subsurface resistivity structure of the investigated area isrepresented as four-layer structure. The first layer (10-20 Ohm.m) is interpreted as mixture of clay and alluvial deposits. The second layer with low resistivity (1-10 Ohm.m) is
interpreted as clayey sand which is saturated by water. The third layer is sandy clay with higher resistivity (15-40 Ohm.m) than the first layer. The last layer represents tuff and igneous rock, which are identified by highest resistivity (>40 Ohm.m). From topography with low variety in altitude surface water flow to South-Western direction and this area is zone of high flood potential as well as drain zone. Groundwater distribution is not same because variation in structure resistivity of subsurface.
V. ACKNOWLEDGEMENTS
We thank TPSDP Physics Department Padjadjaran University and ITB for providing equipment and financial support for the Researc..
REFERENCES
Dam,M.A.C., 1994,The Late Quarternary Evolutio of The Bandung Basin, West Java, Indosensia., Thesis Vrije Universiteit Amsterdam ,TheNetherlands.
Geza Kunetz, 1966 Principles of Direst Current Resistivity Prospecting, Geopubli-cation Associates series1-No1.
Harinarayana,T.,1999, Combination of EM and DC Measure-ment for Upper Crustal Studies, Surveys in Geophysics 20: 257–278, .Kluwer Academic Publishers.
James R, Wait, 1982, Geo-Electromagnetism, Academic Press Kashef, A.A.I.,1987, Groundwater Engineering, McGraw Hill
International Ed.
Koefoed,O., 1968, The Application of The Kernel Function in Interpreting Geoelectrical Resistivity Measurements, Geopublication Associates series1-No. 2.
Parasnis D.S. 1983, Principles of Applied Gephysics, New York ,JWS Inc .
Patra, H.P. and Mallick, K.: 1980, ‘Geosounding principles, 2: Time varying geoelectric soundings’,lsevier, Amsterdam, 419 pp.
Roy, A.: 1962, ‘Ambiguity in geophysical interpretation’, Geophysics 27, 90–99
Vogelsang, 1995, Environmental Geophysics , Practical Guide., Springer.