Using the Rasch Model to Measure Students’ Attitudes toward
Science in “Low Performing” Secondary Schools in Malaysia
Ahmad Nurulazam Md Zain
School of Educational Studies, Universiti Sains Malaysia E-mail: [email protected]
Mohd Ali Samsudin
School of Educational Studies, Universiti Sains Malaysia E-mail: [email protected]
Rohandi
School of Educational Studies, Universiti Sains Malaysia E-mail: [email protected]
Azman Jusoh
Sultan Abdul Halim Teacher Training Institute, Sg. Petani, Kedah, Malaysia E-mail: [email protected]
Abstract
The objective of this study was to examine students’ attitudes toward learning science in three “low performing” secondary school in Penang, Malaysia. 214 students from these schools were involved in completing a questionnaire containing items consisting of six constructs. Data collected were analyzed using Rasch modeling. Students in low performing schools tended to have less positive self-concept of science and were unlikely to experience that learning science were related to their future careers. However, students believed that science is useful for society, and experienced that learning science was interesting. Implications for science educators based on these results are discussed.
Keywords: Attitudes toward science, “Low performing” schools, Rasch Model
Introduction
Students’ attitudes toward science have become a major concern of science education researchers in order to increase interest, performance, and student retention in science. Studies in the science educational literature emphasize that the development of a positive attitude towards science should be an important goal for the school curriculum.
Science educators have been struggling with defining science attitudes and differentiating among attitudes, beliefs, and values (Moore and Foy, 1997). The concept of 'attitude' is defined widely as used in the science education literature. Oliver and Simpson (1988) has defined 'attitude' simply as the degree to which a student likes science. Salta and Tzougraki (2004) have summarized that attitude is a tendency to think, feel or act positively or negatively toward objects in our environment, and can be viewed as having three main components: 1. cognitive component - is a set of beliefs about the attributes of the attitudes and its assessment can be performed using paper-and-pencil tests (questionnaires);
2. affective component - includes feelings about objects and its assessment can be performed using psychological indices:
3. behavioral component - pertains to the way people act toward objects and its assessment can be performed by directly observing behaviors.
attitudes toward science, with the strongest school-related correlation being that of how well students like or get along with their science teacher. Haladyna and Shaughnessy (as cited in Zacharia and Barton, 2004) put forward that students’ attitudes toward science are determined by three independent constructs: teacher, student, and learning environment.
Regarding the relation of attitudes with other aspects in teaching and learning science, Siegel and Ranney (2003) explored the findings from researches. These findings showed that for example; attitudes affect students’ persistence and performance, modest positive correlations between science attitude and science achievement, activity-based and issue oriented science instruction enhance positive attitudes toward science (Siegel and Ranney, 2003). Trumper (2006) also found that the quality of teaching of school science is a significant determinant of attitude towards school science.
One important outcome of the attitudes research has demonstrated the correlation between attitudes toward science and student achievement in science and future access to science experiences. Cannon and Simpson (1985) argue that changes in student achievement motivation were similar to changes in science attitude. They found that science self-concept at the tenth-grade level is a good predictor of both number and type of science courses a student will take during high school. In particular, students with lower attitudes do not appear to pursue additional courses in science (Simpson and Oliver, 1990). Whereas in Zacharia’s and Barton’s (2004) study, students’ attitudes, both at the middle- and high-school level, appear to be affected by the their interest levels in science, their abilities in school science, the curriculum and the learning climate, their access to extracurricular science experiences, their family, teachers, their own self-concept, and their peer group. However, in term of influence factor affecting students’ attitudes is not clear which are the major nor is it clear to what extent various researchers agree (Young, 1998).
Attitudes in science are seen as a construct and are understood as the relation of a student to physical matters. Even though there is a range of aspects in researching the students’ attitudes in science, this study focused on construct developed by Barmby, Kind, & Jones (2008). They developed six attitude constructs. These constructs are as follows:
Whereas, combined interest in science consists of the construct of learning science in school, future participation in science, and science outside of school.
Methodology
Sample
The objective of this study was to find out students’ attitudes toward learning science in three “low performing” secondary schools. Altogether, 214 students from Form 2 and Form 4 were involved in this study.
Data Collection
A questionnaire used in this study was the attitudes in science questionnaire developed by Barmby, Kind, & Jones (2008). This questionnaire was designed to evaluate students’ attitudes towards science. The questionnaire consisted of 37 items separated into seven constructs representing the overall students’ attitudes towards learning science. These six constructs were learning science in school (item 1- 6; α=0.89), self-concept in science (item 7-13; α=0.85), practical work in science (item 14-21; α=0.85), science outside of school (item 22-27; α=0.88), future participation in science (item 28-32; α=0.86), importance of science (item 33-37; α=0.77), and combined interest in science (α=0.93). The combined interest in science consists of the construct of learning science in school, future participation in science and science outside of school.
The extreme categories in the Likert scale are labeled ‘‘strongly disagree’’ (coded 1) and ‘‘strongly agree’’ (coded 4).
These instruments were administered in the presence of science teacher in respective schools who would provide assistance if the students encountered any difficulty. Overall, the administration of the questionnaires proceeded smoothly; all students had sufficient time to complete the questionnaire, and very few students had any queries about the items. In this paper, we draw on the data obtained from the questionnaire, in order to examine students’ attitude toward learning science in three low performing schools in Penang.
Data analysis
Boone and Scantlebury (2006) identified that in recent years the Rasch model has been implemented in analyzing large-scale assessment projects in many areas. In educational research, the Rasch model provides valuable data for the development, modification, and monitoring of valid measurement instruments.
In this paper, the Rasch model was used to examine students’ attitude toward learning science in three low performing schools in Penang. The Rasch model transforms raw item difficulties and raw person scores to equal interval measures of logits on a line in a “meter stick”. The idea of a line helps us to determine item positions by considering each item relative to the items already positioned on the line. This determination can be done by comparing pairs of items with respect to their relative difficulties along the line. The strength of placing logits scale on a meter stick is in providing equal and standard interval data. The way in which data are displayed in the meter stick, will insure that data collected from a meter stick produced are one place combined with data collected with a meter stick produced at a different location. Once the variable is constructed by the line of items, the positions of students can be produced on this same line. Their probable positions can be specified initially by a best guess as to their ability to correctly answer the items which define the variable. The line of variable shows both the positions of items and the positions of students. Eventually, the positions of students will become more explicit and more empirical by observing what items they correctly answer. This is particularly important on monitoring the students’ attitudes. If raw scores to equal interval measures, the result of analysis may provide incomplete information (Boone & Scantlebury, 2006). Thus, this data conversion is important in order to provide a good quality measurement.
The equal interval measures transformed by Rash model are used to map persons and items onto a linear (interval) scale. Such mapping (called person–item maps) produces useful tools for evaluating students’ attitudes and also can be used to evaluate the instrument’s effectiveness. The person–item maps of students’ attitudes towards learning science provided ways for evaluating and interpreting the data. Items order in person–item maps illustrates the level of items difficulties. This means that items which more difficult to agree with or items which easier to agree with can be identified.
The Rasch model explains how the students’ attitudes towards learning science can predict student’s response on a particular test item involving attitudes. Students at the same logits value as an item have a 50% chance of correctly answering that item. Items above their ability level can still be answered correctly, but students have less than a 50% chance of correctly answering the item. Items listed below a student are those that the student has less than a 50% chance of correctly answering. Consequently, the higher position of the item on the single line means that the item is more difficult to agree with. Conversely, the lower position of the item on the single line means that the item is easier to agree with.
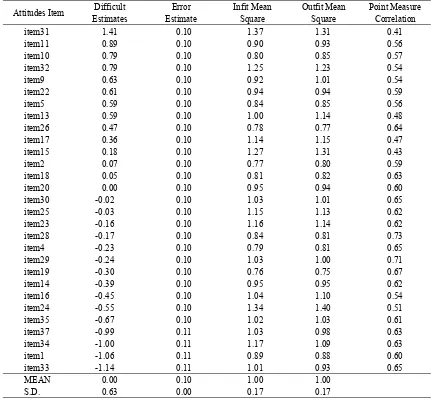
Prior to analyzing the students’ attitudes towards learning science, overall collected data were diagnosed in order to provide a precise and productive measurement. This process is similar to the process of calibrating an instrument. This was done by analyzing the relevant data according to a relevantly parameterized unidimensional measurement model implementing the essential requirements of measurement- a Rasch model. The responses of 214 students to the 37 items of attitudes towards learning science were analyzed using Winsteps (Racsh-Model Computer program). In order the items can be used in the Rasch model, the items infit mean square and outfit mean square should be distributed between 0.7 and 1.4, and the item point measure correlation should be greater than 0.3. Using this criteria, there are 9 items out of 37 items (item3, item6, item7, item8, item12, item21, item27, and item36) has been discarded from the Rasch analysis.
Finding and discussion
correlations are distributed from 0.41 and 0.73. By looking at the result of Principle Components Analysis, 52.7% of the variance in the data is explained by the measures. This data fit the Rasch model perfectly with 52.7% would be explained. These percentages are same, indicating that the estimation of Rasch measures has been successful.
The distributions of students (n = 214) according to attitude and of items (n = 29) according to difficulty are shown in Figure 1. On the left-hand side of Figure 1, the distribution of Students is represented. Items located below a participant are items that the students were likely to agree to. Items located above are items that the students were unlikely to agree to. The mean of Rasch score for students attitudes was 0.38 Logits (SD = 1.1). By looking at which items are located above and below this point, we can understand the student’s average level of attitudes. Whereas, the mean of Rasch score for items was 0.0 Logits (SD=0.63). Looking at the mean of Rasch score on persons and items and their respective standard errors, students’ attitude score is compatible with items difficulty score. It means that for this sample of students, their attitude towards science could not be justified whether or not they tend to have a more positive attitude. However, the items distribution on the map has valuable information of students existing attitude. Figure 1 displays an item–person map in which students are placed relative to the hierarchy of items. On the right side, items are listed in order of difficulty, with the hardest item to agree to at the top (item31) and the easiest item to agree to at the bottom (item33).
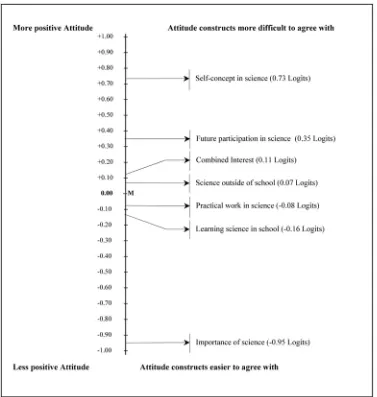
Figure 2 shows the difficulty in every construct of attitude towards science. As this study was conducted in low performing secondary schools, it was reasonable that students were unlikely to agree to the items of self-concept in science (0.73 Logits), for example students were most unlikely to agree to the item9 “I get good marks in Science” (0.63 Logits). This student’ less positive attitude towards self-concept in science leads to the less positive attitudes towards their future participation in science. The students were unlikely interested to further participate in the area of expertise related to science. This is indicated by high mean of difficulty of the attitudes construct on future participation in science (0,35 Logits). As shown in Figure 1, for example, becoming a science teacher (item31; 1.41 Logits) was the related science activity in the future that they were unlikely involve in. Even though students have less positive self-concept in science, their attitude towards the importance of science in their society is more positive (-0.95 Logit). Students believed that science play an important role in society. For example, students were most likely to agree to the item33 “Science and technology is important for society” (-1.14 Logits). They observed that science was likely making people live in more easy and more comfortable ways (item34; -1.00 Logits). They were also likely found many exciting phenomenon in science and technology (item37; -0.99 Logits). This finding shows that students appreciate the contribution of science and technology in society, even though they have weaknesses to do science.
The student’s attitudes in “learning science in school” construct (-0.16 Logits) was observed higher that the average of the overall items (0.00 Logits). Students found that they learned interesting things in their science lesson (item 1; 1.06 Logits). This shows that at least the students want to do more science in their school (item4; 0.23 Logits). However, students were unlikely to agree that they would look forwards to their science lesson (item2; 0.07 Logits) and they tended to like other subject better than science in their school (see item5; 0.59 Logits).
This finding shows that learning of interesting things in science lesson did not directly influence student’s interest in science. The Rasch measure of “combined interest” construct (0.11 Logits) validates this preposition. The student’s positive attitude in certain aspect of learning science in school, practical work in science (-0.08 Logits) and the important of science (-0.95) provide good conditions to develop their interests in learning science. However, their overall attitudes need to be improved. Efforts should be given in order to make them appreciate more on science outside of school in their learning. In order this to happen, science teachers need, for example, to integrate more science activities outside of school.
Conclusion
experiencesin order to perform their idea. By doing this, students feel that their ideas are important and valued. This will uplift their self-concept in science. Moreover, students’ experiences in learning science should have connection with their expectation of their future. In order this to happen, teachers need to consider that learning science needs to have more emphasis on making connection between science and students’ life. Implementing instructional congruence in the teaching of science proposed by González and Moll (2002), in which students’ culture and experiences are appreciated; seem relevant to be considered in developing students’ attitudes in science.
References
Barmby, P., Kind, P. M. & Jones, K. (2008). Examining Changing Attitudes in Secondary School Science. International Journal of Science Education, 30(8), 1075-1093.
Basu, S. J. & Barton, A. C. (2007). Developing a Sustained Interest in Science among Urban Minority Youth. Journal of Research in Science Teaching, 44, 466-489.
Boone, W. J. & Scantlebury, K. (2006). The Role of Rasch Analysis When Conducting Science Education Research Utilizing Multiple-Choice Tests. Science Education, 90, 253-269.
Cannon, R. & Simpson, R. (1985). Relationships among attitude, motivation, and achievement of ability grouped, seventh grade, life science students. Science Education, 69, 121-138.
González, N. & Moll, L. C. (2002). Cruzando el Puente: Building Bridges to Funds of Knowledge. Educational Policy, 16, 623-641.
Moore, R. W. & Foy, R. L. H. (1997). The Scientific Attitude Inventory: A Revision (SAI II). Journal of Research In Science Teaching, 34(4), 327-336.
Oliver, J. S. & Simpson, R. D. (1988). Influences of attitude toward science, achievement, motivation, and science self concept on achievement in science: a longitudinal study. Science Education, 72(2), 143-155.
Osborne, J., Simon, S. & Collins, S. (2003). Attitudes towards science: a review of the literature and its implications. International Journal of Science Education, 25(9), 1049-1079.
Salta, K. & Tzougraki, C. (2004). Attitudes Toward Chemistry Among 11th Grade Students in High Schools in Greece. Science Education, 88, 535- 547.
Siegel, M. A. & Ranney, M. A. (2003). Developing the Changes in Attitude about the Relevance of Science (CARS) Questionnaire and Assessing Two High School Science Classes. Journal of Research in Science Teaching, 40(8), 757-775.
Young, T. (1998). Student Teachers’ Attitudes Towards Science (STATS). Evaluation and Research in Education, 12(2), 96-111.