Teaching children cooperation — An application of
experimental game theory
Chinn-Ping Fan
∗Associate Professor, Department of Economics, Soochow University, Taipei, Taiwan, ROC
Received 9 December 1997; received in revised form 7 April 1999; accepted 14 April 1999
Abstract
This paper studies children’s behavior in a prisoner’s dilemma game. I attempted to teach children cooperation by means of a short moral lecture. Over the period of 12 months, I experimented with 196 children between the ages of six and eleven. The experimental findings are as follows. (1) In support of the developmental psychology theories, the proportions of cooperation are indeed higher for older children. (2) There is a positive short-run teaching effect: the proportion of cooperative individual increases significantly immediately after the lecture. However, a moral lecture 12 months before has no significant effect on children’s behavior. ©2000 Elsevier Science B.V. All rights reserved.
JEL classification:A12; C72; C91
Keywords:Cooperation; Prisoners’ dilemma game; Experimental game theory; Developmental psychology
1. Introduction
Cooperation is one of the most important aspects of human behavior, but unlike, for example, competition (which has been thoroughly studied by economists), cooperation is an issue that still needs much analysis. One good example demonstrating this inadequacy is the prisoner’s dilemma game. Game theory predicts that when the prisoner’s dilemma game is repeated for a finite number of rounds, rational players will defect in every round. Many people do. But experimental evidence repeatedly shows that certain proportions of the subjects choose the strategy that is not their best response, they cooperate with their rival and are able to achieve the Pareto superior outcome.
One possible theoretical explanation for this non-Nash cooperative behavior can be found in Harsanyi (1977) in which a general theory of rational behavior was proposed. Theprimary
∗Tel.:+886-23111531 ext. 3310; fax:+886-238-22001.
E-mail address:[email protected] (C.-P. Fan).
definition of individual rationalityrefers to the widely used concept of maximizing individ-ual expected utility; while thesecondary definition of rationality(in the case of ethics) refers to maximizing the average utility level of all individuals in a society. Mathematically, the former definition can be transformed to the latter by adopting the equiprobability postulate, that is, agents maximize under ‘the fictitious assumption of having the same probability of occupying any possible social position’ (p. 632). Harsanyi called this the ‘equiprobability model of moral value judgments’ (p. 632). If people are rational under this definition, the Pareto superior cooperative outcome will be the equilibrium result of the prisoner’s dilemma game.
Harsanyi distinguished these two rationality concepts by specifying different objective functions. However, the relationship between these two concepts was not discussed. It is also unclear which part of the human population possesses which kind of rationality concept. The field of developmental psychology may be helpful in this respect. Developmental psychology studies the processes of intellectual, emotional, and cognitive development in children. According to Kohlberg (1969), the development of human cognitive structure is the result of processes of interaction. He claims that:
The direction of development of cognitive structure is toward greaterequilibriumin this organism-environment interaction, i.e., of greater balance orreciprocity...In addition,
however, social cognition always involvesrole-taking,i.e., awareness that the other is in some way like the self, and that the other knows or is responsive to the self in a system of complementary expectations....The direction of social or ego development is also toward
an equilibrium orreciprocitybetween the self’s actions and those of others toward the self. In its generalized form this equilibrium is the end point or definer of morality, conceived as principles of justice, i.e., of reciprocity or equality1 (pp. 348–349).
This theory, no doubt, provides a possible support for Harsanyi’s general theory of rational behavior. It also looks very much like a verbal description of a game theoretic solution concept, with the particular condition that cognition development would bring us to an equilibrium with the special property of equality or reciprocity. In a prisoner’s dilemma game, if people understand that the only candidate for equilibrium is reciprocal behavior, than it would be reasonable for them to choose cooperation over the Pareto-inferior outcome. Developmental psychology contains more than abstract theoretical statements. Beginning with the pioneering work of the great Piaget (1928), psychologists have observed and studied the behavior of children empirically. Among other results, it has been found that older children are more capable in understanding other people’s thoughts and feelings (Karniol, 1995). Their ability in making causal reasoning is more developed (Siegler and Thompson, 1998). Older children are more sensitive to the implicit demand for socially appropriate actions (Zarbatany et al., 1985). And the effect of negative emotions, for example, anger or anxiety, on cognition ability is stronger for younger children (Buengtal et al., 1995).
One research technique frequently employed by psychologists is to elicit free responses to hypothetical questions from subjects. However, economists will point out that subjects may not be properly motivated to provide meaningful responses to the questions. A stan-dard procedure for economic experiments is to design material incentives in order to elicit meaningful responses from subjects.
Table 1
Payoffs of the card game16
Card Points
Child A Child B Child A Child B
s s 5 5
△ △ 1 1
△ s 10 0
s △ 0 10
Originating from the prisoner’s dilemma game and developmental psychology research, this paper examines the following propositions by means of a laboratory-controlled experi-ment with material incentives. First, older children are in the later stages of developexperi-ment and their behavior tends more to the reciprocal equilibrium. While younger children are more likely to end up in the Pareto inferior aggressive outcome. Therefore, I expect the proportion of cooperation, that is, reciprocal goodwill, to be higher for older children. Second, I want to study the possibility of teaching children cooperation in a prisoner’s dilemma environment. A short lecture explicitly explaining the logic favoring cooperation was designed as the treatment variable. Comparing children’s behavior before and after receiving this lecture, we could test whether this teaching significantly changed children’s behavior. Over the period of 12 months, I experimented with 196 children between the ages of six and eleven. The behavior of children is analyzed statistically to formally test the above propositions. Section 2 explains the experimental procedure and design. Section 3 reports the statistical analysis of the experiment data. Section 4 concludes this paper.
2. Experimental procedure and design
With the basic structure of the prisoners’ dilemma environment, I designed card games and recruited children between the age of six and eleven as subjects. All sessions of the ex-periment were conducted in the classrooms of Min-Chun Primary School in Taipei, Taiwan. The teachers first introduced us (the experimenter and assistants) to the class. We made simple greetings and announced that we were going to show the children how to play a card game. Each child would be given two cards, one marked with△and the other withs2. Two children would form a pair to play this game. One round of the game consisted of each child freely choosing one card and then the pair of children showing the chosen cards to each other simultaneously. The points to be received by children were as specified in Table 13. To ensure understanding, the experimenter also explained Table 1 orally to the children. The experimenter explained to children that we could think of this card game being similar to a toy-sharing situation. Imagine that the experimenter had a very precious toy that each pair of children were allowed to borrow for a period of 10 minutes. Playing thes
card would be like a child acting cooperatively, while a child who plays the△card would
2The usual terms for describing actions in a prisoner’s dilemma game (cooperate, defect) are suggestive. With
geometric symbols, we wished to construct a neutral decision-making environment for the children.
3Table 1 is different from the usual bi-matrix representation of a game, which we think is not very easy for young
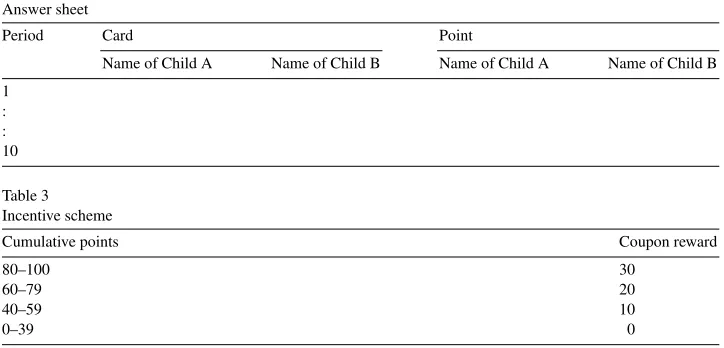
Table 2 Answer sheet
Period Card Point
Name of Child A Name of Child B Name of Child A Name of Child B 1
be aggressive. Twoscards would mean both children were cooperative; they would share
this precious toy equally and each child would have it for 5 minutes. If one child were to play the△card and the other to plays, the aggressive (△) child would take the toy by force and enjoy it for the whole 10-minute period, leaving the cooperative (s) child with no time
at all. But two△cards would mean both children were aggressive, they would then spend 8 minutes fighting with each other and be left with 1 minute each for enjoying the toy.
To make sure that children understood the game rules and could correctly record their actions, we invited a pair of volunteers (for each session) to publicly demonstrate playing the game. Cards were distributed to the volunteers and they filled in their names in the proper places of the answer sheet (Table 2) posted on the blackboard. On the count of three, the volunteers showed the cards they had chosen to the whole class, and then recorded the outcome of the game on the answer sheet. The volunteers were asked to play the card game two or three times to ensure understanding.
After the public demonstration, we announced that there would be a material incentive for playing the card game. Children would play the same card game with the same partner for 10 periods in a session. When the session was completed, children should calculate their respective cumulative points4 and they would be rewarded accordingly (Table 3). Most teachers discourage small children bringing cash to school, therefore, I did not use cash payment as incentives. Instead, I used coupons for the school store. Children could then use these coupons to purchase stationery, milk, juice or snacks. The numbers in Table 3 are in New Taiwan (NT) dollars. A coupon of 10 NT dollars can buy a small package of cookies in the school store.
Before the game started, we gave each class one more chance to ask questions. Cards marked with△andsand the answer sheets were then distributed to the children. Most
classes rotate children’s seating on a regular basis, but for the few sessions that had not had their seats changed recently, I asked the teacher to rearrange children’s seating randomly to decrease the probability of children playing with their best friends. The experimenter
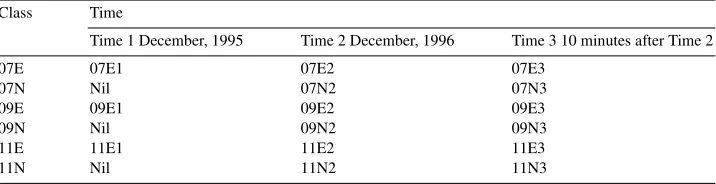
Table 4
Experimental design and session names Class Time
Time 1 December, 1995 Time 2 December, 1996 Time 3 10 minutes after Time 2
07E 07E1 07E2 07E3
and assistants stayed in the classrooms during the experiment and assisted children when needed. When a session was completed, I also invited children to freely express their feelings and opinions concerning this card game.
The unit of analysis in this research is classes of children, six classes were recruited and sessions were conducted in three different time periods. The experiment involved two control variables (age and lecture treatment) and a total of fifteen sessions. The first column of Table 4 gives the name of the six classes and top row explains the time arrangement of the experiment, each cell of Table 4 gives a session name.
Three classes (07E, 09E and 11E, E for Experienced5) participated both in 1995 and 1996, and the other three (07N, 09N and 11N, N for No experience) only participated in the 1996 sessions. Both in Time 1 and Time 2, the experimenter gave a short lecture immediately after the children completed a 10-period session of the card game. The essence of the lecture is as follows: ‘Whatever the other child does, playing the△card will always get you more points than playing thescard. Therefore, if you care only for yourself, the best you could
do is to play the△card. But then, when the other child arrives at the same conclusion, he (or she) will also play the△card, and you will both end up in the worst situation. For the two of you, a better result is that you cooperate with each other and both play thescard, you can then share the toy equally and not waste any time fighting’. This lecture was designed as a treatment variable by which children were explicitly told that it was a good thing to cooperate with one another. Also, I think the procedure of giving a somewhat similar lecture6 is what many teachers and parents would do when they try to teach children cooperation.
In 1996, after giving this lecture, the experimenter announced that the class would be given one more chance to play this card game for another 10 periods with the same partner. The coupon award for this additional session would be the same as before. This last session was denoted as Time 3.
With such a design, I formally tested the following propositions.
1. Age effect. I was interested in comparing the behavior of children of different ages. The-ories of developmental psychology suggest that it would be more difficult for younger children to achieve cooperation, therefore, the proportion of cooperation should be
5The first two numbers refer to the age of the children in 1996. Therefore, children of class 07E were actually
6-year olds in 1995, the same for classes 09E and 11E.
lower for younger children. For example, I expected session 07E1 to have a lower proportion of cooperation than 09E1.
2. Short-term Teaching effect. For the same classes of children, I compared their behavior in Time 2 and Time 3 (for example, 07E2 versus 07E3). If the proportions of cooperation in Time 3 were significantly higher than in Time 2, then I concluded that the moral lecture had a positive short term teaching effect. It is called short term because Times 2 and 3 were only 10 minutes apart. Therefore, the test result of the teaching effect may not be true for a longer duration.
3. Maturity effect.For the three classes participating in both the 1995 and 1996 sessions, I wanted to know whether their behavior differed in these 2 years (for example, 07E1 versus 07E2). If the proportions of cooperation in Time 2 were significantly higher than Time 1 for the same groups of children, I would conclude that the children matured within this period and hence, their behavior was different7. This analysis compliments the testing for the age effect. For age effect, we compared, at a fixed time point, the behavior of children of different ages. While for maturity effect, we took the same class of children and compared their behavior in 1995 and 1995, 12 months apart.
4. Experience effect.Six classes of children participated in the sessions in Time 2. Among them, three classes had the experience of playing the same card game and receiving the lecture a year ago, while the other three classes did not have this experience. For the same age group, I compared the behavior of the experienced versus the no-experience class (for example, 07E2 versus 07N2). If a significant difference existed, I would conclude that there is an experience effect.
3. Experimental Result
This section analyzes subjects’individual behaviorandpair behavior. The following convention is adopted when coding the experimental results. For individual behavior, a
scard is coded as cooperative, and a△card non-cooperative. Pair behavior records the outcomes of the game. I am certain that twoscards mean the children are cooperating with each other and therefore it is denoted as a cooperative pair. It is also clear that two△
cards mean the children are aggressive to each other, hence I denote it an aggressive pair. However, it is possible for (s,△) pairs to have different meanings. Most of these pairs could be best described as ‘failed cooperation’, where a one-sided cooperative behavior did not find it’s reciprocal. But it could also be that children were cooperative through rotating their roles in consecutive (s,△) outcomes. I suspect a few pairs of children were doing just that. For this reason, I called these pairs ‘others’. Since they do not allow a unique behavioral interpretation, I did not conduct statistical testing for them8.
Table 5 reports the sample mean (over the 10 periods) of proportions of subject behavior for all sessions of the experiment.
7Another, though less likely, possibility is that some of these children remembered the short lecture delivered by
the experimenter 12 months before. There was a long-term teaching effect that made children more cooperative.
8Also, the proportions of cooperative pairs, aggressive pairs and other pairs add up to one. Therefore, I only
Table 5
Experimental results, mean proportions
Session No. of Subjects Individual behavior Pair behavior
Cooperative Non-cooperative Cooperative Aggressive Others
07E1 32 0.3531 0.6469 0.2313 0.5250 0.2438
07E2 32 0.3719 0.6281 0.1563 0.4125 0.4313
07E3 32 0.5469 0.4531 0.3125 0.2250 0.4625
07N2 34 0.3824 0.6176 0.2000 0.4353 0.3647
07N3 34 0.4971 0.5029 0.2176 0.2235 0.5588
09E1 34 0.3912 0.6088 0.1529 0.3706 0.4765
09E2 34 0.3765 0.6235 0.1412 0.3882 0.4706
09E3 34 0.4618 0.5382 0.2000 0.2765 0.5235
09N2 30 0.3167 0.6833 0.1067 0.4733 0.4200
09N3 30 0.5033 0.4967 0.2733 0.2667 0.4600
11E1 28 0.4286 0.5714 0.1643 0.3071 0.5286
11E2 28 0.5250 0.4750 0.2143 0.1643 0.6214
11E3 28 0.5893 0.4107 0.2643 0.0857 0.6500
11N2 38 0.5711 0.4289 0.3053 0.1632 0.5316
11N3 38 0.6184 0.3816 0.4368 0.2000 0.3632
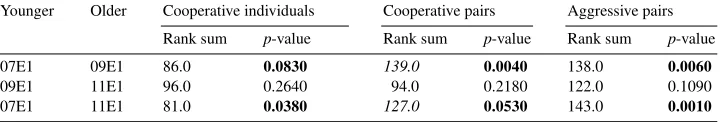
Table 6
Hypothesis testing for age effect at Time 1
Younger Older Cooperative individuals Cooperative pairs Aggressive pairs Rank sum p-value Rank sum p-value Rank sum p-value
07E1 09E1 86.0 0.0830 139.0 0.0040 138.0 0.0060
09E1 11E1 96.0 0.2640 94.0 0.2180 122.0 0.1090
07E1 11E1 81.0 0.0380 127.0 0.0530 143.0 0.0010
To formally test the behavioral differences of children, I focused on the following sample statistics: the proportion of cooperative individuals, the proportion of cooperative pairs and the proportion of aggressive pairs. The Wilcoxon rank-sum test9 was conducted to analyze the behavioral difference of two classes. The signed-rank test was conducted to analyze the behavioral difference of the same class of children in different times. Table 6 through 11 report the statistics10and thep-values.
To test for the age effect, it is necessary to control the ‘lecture treatment’ variable. Chil-dren’s exposure to the lecture were different in Times 1, 2 and 3, therefore, the hypothesis testing for the age effect was conducted separately for these sessions. The null hypothesis is that there was no significant difference in the behavior of the two sessions. Following the developmental psychology theories, the alternative hypotheses are that the proportions of cooperative individuals and cooperative pairs are lower for the younger children, and the proportions of aggressive pairs higher.
In the following tables, ap-value in bold shows that the null hypothesis of no difference can be rejected at a 10 percent significance level. A rank-sum in italics shows that the direction of the difference is wrong, that is, contrary to the prediction of the developmental
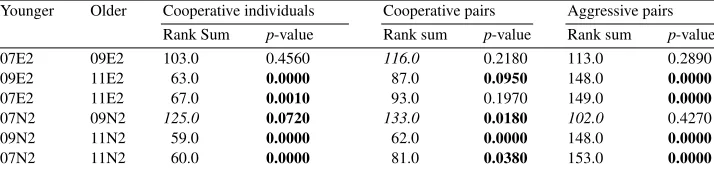
Table 7
Hypothesis testing for age effect at Time 2
Younger Older Cooperative individuals Cooperative pairs Aggressive pairs Rank Sum p-value Rank sum p-value Rank sum p-value
07E2 09E2 103.0 0.4560 116.0 0.2180 113.0 0.2890
09E2 11E2 63.0 0.0000 87.0 0.0950 148.0 0.0000
07E2 11E2 67.0 0.0010 93.0 0.1970 149.0 0.0000
07N2 09N2 125.0 0.0720 133.0 0.0180 102.0 0.4270
09N2 11N2 59.0 0.0000 62.0 0.0000 148.0 0.0000
07N2 11N2 60.0 0.0000 81.0 0.0380 153.0 0.0000
psychology theories. For example, the first row of Table 6 reports three hypothesis testing results comparing the behavior of session 07E1 versus session 09E1. In this row, the cell under the column of cooperative pairs shows a rank-sum of139.0, which means that the proportion of cooperative pairs in session 09E1 is actually lower than that of session 07E1 with ap-value of0.0040.
(1) Hypothesis testing for age effect at Time 1.
Observing the columns of cooperative individuals and aggressive pairs, I find that the ex-perimental evidence supports the prediction that younger children were less cooperative11. All the directions of the differences are as expected and four out of the six rank-sums lead to the rejection of the null hypothesis. But the proportions of cooperative pairs seem to tell a different story. Two out of the three rank-sums show that the proportions of cooperative pairs were actually higher for younger children. Compared with sessions 09E1 and 11E1, session 07E1 had fewer cooperative individuals but more cooperative pairs. The tendency of reciprocity was highest among the 6-year olds. Although they had more aggressive pairs, but they were able to achieve higher proportions of cooperative pairs with fewer cooperative individuals. As for the 8- and 10-year olds, there were more individual cooperative attempts which did not meet a partner with reciprocal goodwill.
(2) Hypothesis testing for age effect at Time 2.
Table 7 summarizes the result of 18 hypothesis tests, eleven of which confirmed the theoretical prediction that older children were more cooperative. Comparing the various age groups, I find that the behavior differences between the 7- and 9-year olds were neither significant nor in the right direction12. But for the other age-group comparisons (09 versus 11 and 07 versus 11), the experimental evidence is very supportive for the prediction of developmental psychology theory. It is indeed true that older children have more cooperative individuals, more cooperative pairs and fewer aggressive pairs.
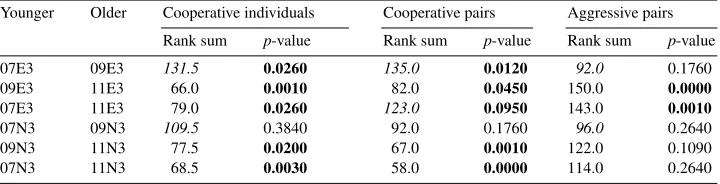
(3) Hypothesis testing for age effect at Time 3.
The statistical results of Table 8 appear somewhat similar to that of Tables 6 and 7. It is again difficult to distinguish behavioral differences between the 7- and 9-year olds. As for the other age groups, nine out of the 12 hypothesis testings are significant with correct direction. Tables 6–8 generally confirm that older children were more cooperative in this prisoner’s dilemma experiment. However, at the current stage, I am unable to decipher the exact reason behind this behavioral difference. I can only offer the following observations. It appeared
Table 8
Hypothesis testing for age effect at Time 3
Younger Older Cooperative individuals Cooperative pairs Aggressive pairs Rank sum p-value Rank sum p-value Rank sum p-value
07E3 09E3 131.5 0.0260 135.0 0.0120 92.0 0.1760
09E3 11E3 66.0 0.0010 82.0 0.0450 150.0 0.0000
07E3 11E3 79.0 0.0260 123.0 0.0950 143.0 0.0010
07N3 09N3 109.5 0.3840 92.0 0.1760 96.0 0.2640
09N3 11N3 77.5 0.0200 67.0 0.0010 122.0 0.1090
07N3 11N3 68.5 0.0030 58.0 0.0000 114.0 0.2640
Table 9
Hypothesis Testing for Short-term Teaching Effect
Time 2 Time 3 Cooperative individuals Cooperative pairs Aggressive pairs Rank sum p-value Rank sum p-value Rank sum p-value
07E2 07E3 0.0 0.0020 0.0 0.0039 3.5 0.0058
07N2 07N3 6.0 0.0137 16.0 0.4219 0.0 0.0039
09E2 09E3 2.0 0.0117 8.0 0.0977 0.0 0.0078
09N2 09N3 0.5 0.0010 0.0 0.0020 3.0 0.0098
11E2 11E3 7.0 0.0371 13.0 0.0801 2.5 0.0156
11N2 11N3 12.0 0.1250 2.0 0.0029 18.5 0.2617
that children of all ages understood that playing the△card was the dominant strategy. ‘It was the strongest’, said a 6-year old. But older children expressed deeper thinking. A 9-year old asked: ‘Why are there only two cards? What happens if there were a third kind of card?’ It also appeared that the emotional responses of younger children were much stronger than that of the older children, and they were less able to take the perspective of other person13. There were very upset 6- and 7-year olds complaining that the other child always played the△card, without realizing he himself14 was doing exactly the same thing.
(4) Hypothesis testing for short-term teaching effect.
For the same class of children, if their behavior was significantly more cooperative in Time 3 than Time 2, I would conclude that our short lecture had a positive short-term teaching effect.
Table 9 supports the existence of a positive short-term teaching effect for the first five classes15. Thep-values of fourteen out of the fifteen hypothesis testing are significant. These
statistical results confirm that after the lecture, there were more cooperative individuals, more cooperative pairs and fewer aggressive pairs for these classes of children.
The last row, however, shows that Class 11N responded differently to the lecture delivered by the experimenter. It is necessary for us to refer to the data in Table 5 to understand their behavior. When the experimenter first approached Class 11N, the mean proportion of cooperative individuals was 57 percent and the mean proportion of cooperative pairs was 31 percent in session 11N2. These numbers show that this was a highly cooperative group
13See Siegler and Thompson (1998), Karniol (1995), and Buengtal et al. (1995) for related research. 14Or she herself, but there were more complaining boys than girls.
of children. After receiving the moral lecture, the proportion of cooperative individuals increased insignificantly and the mean proportion of cooperative pairs and aggressive pairs both increased. Individual behavior did not change that much but the tendency of reciprocity increased. After the lecture treatment, it appeared that these children understood each other better. The result was more reciprocal behavior, cooperation met cooperation and aggression met aggression.
The general tendency was for more cooperation after the lecture, but there were still differences in the responses of children. For example, for both Classes 07E and 07N, the proportions of cooperative individuals increased. For Class 07E, we observe reciprocal co-operation replacing reciprocal aggression and the mean proportion of other pairs basically stayed unchanged. On the other hand, for class 07N, although the increase of individual co-operation is significant, cooperative pairs only increased slightly and insignificantly. Much of the increased individual cooperation did not meet reciprocal goodwill and the proportion of other pairs increased greatly.
Note that children played with the same person in Time 2 and 3. Intuition suggests that children might want to reward or take revenge on their partners based on their Time 2 behavior. The moral lecture given by the experimenter explained that aggressiveness is a knife with two edges that could hurt oneself. Therefore, one way to confirm the success of the moral lecture is to demonstrate that revenge seldom occurs. The current experimental data seem to support this claim. Class 09N had the lowest proportion of cooperative individual in Time 2. For this class, the proportions of cooperative individual and cooperative pair both increased significantly. There were no bad feelings for the non-cooperative behavior in Time 2. There also seem to be a tendency of rewarding cooperation with cooperation. Note that five out of the six classes had significantly more cooperative pairs in Time 3.
When studying the generosity of children, Zarbatany et al. (1985) found that ‘older children were significantly more generous than younger children only under conditions of relatively high experimenter demand’ (p. 753). They claimed that older children were more eager to please and needy of social approval, therefore, they had a higher level of conformity but not a higher level of altruistic spirit. The moral lecture of our experiment is similar to the experimenter demand of Zarbatany et al. (1985). However, our experimental evidence tells a different story. I found that younger children were also responsive to the moral lecture, and older children were generally more cooperative both before and after the lecture treatment. Therefore, social conformity can not explain the cooperation of older children.
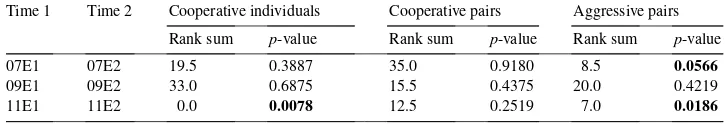
(5) Hypothesis testing for maturity effect.
Three classes of children participated in the 1995 (Time 1) session and received a short moral lecture given by the experimenter. When these children were approached again in 1996 (Time 2), most of them remembered the card game played 12 months before. The behavior of these children in Time 1 and 2 was compared to see if the children had matured and become more cooperative.
Table 10
Hypothesis Testing for Maturity Effect
Time 1 Time 2 Cooperative individuals Cooperative pairs Aggressive pairs Rank sum p-value Rank sum p-value Rank sum p-value
07E1 07E2 19.5 0.3887 35.0 0.9180 8.5 0.0566
09E1 09E2 33.0 0.6875 15.5 0.4375 20.0 0.4219
11E1 11E2 0.0 0.0078 12.5 0.2519 7.0 0.0186
Table 11
Hypothesis testing for experience effect
Experience No experience Cooperative individuals Cooperative pairs Aggressive pairs Rank sum p-value Rank sum p-value Rank sum p-value
07E2 07N2 100.0 0.3700 99.0 0.3420 101.0 0.3980
09E2 09N2 122.0 0.1090 110.0 0.3700 94.0 0.2180
11E2 11N2 89.0 0.1240 90.0 0.1400 100.0 0.3700
does not exist for the age between 6 and 7 and neither for the age between eight and nine. But for Class 11N, when we compare the behavior of the same class of children between the age of 10 and 11, the statistical result seemed to support the existence of maturity effect. At the current stage, no general conclusion could be made concerning the existence of the maturity effect. But recall that Tables 7 and 8 also report that the age difference between 7-and 9-year olds was unclear, while the difference between 9- 7-and 11-year olds was much more significant. These data seems to suggest that, compared with other age groups, the 11-year olds were in a different level of development.
(6) Hypothesis testing for experience effect.
A final perspective of the possible effect of the moral lecture could be examined by comparing the behavior of experienced versus inexperienced children. With the data of Time 2, I tested to see if the 1995 experience created behavioral differences for children of the same age.
All thep-values in Table 11 are larger than 0.10, therefore, I cannot conclude that the experience of receiving a moral lecture 12 months before caused any behavioral difference for children of the same age.
Note that the statistical tests of this section could serve to reinforce and double-check each other. For those three experienced classes, the maturity effect of Table 10 actually measures the mixed effects of maturity and experience with the game a year before. With the confirmation of Table 11 that experience effect does not exist, we could more safely assume that any change from, say 07E1–07E2, is truly due to maturity.
The sample answer sheet is given in Appendix A and complete experimental data is given in the tables in Appendix B.
4. Conclusions
of Harsanyi. I also found that the moral lecture had a positive short-term teaching effect: children were more cooperative immediately after receiving the lecture. However, the ex-perience of receiving this lecture 12 months before had no significant effect on children’s behavior.
The group reactions to the lecture treatment were different. There were generally more cooperative individuals after the moral lecture. In some classes, this resulted in more happily cooperative pairs, but for other classes, it led to one-sided, failed cooperation. I would say that the teaching was more successful for the former case. Another interesting finding was that the short-term teaching effect of the lecture treatment was smallest for the most cooperative group of children. It seems that there is a factor of aggressiveness that could not be reduced by our moral lectures.
The purpose of this research is to test statistically forbehavioral difference. Some of the findings of this experiment could be related to the developmental psychology literature. However, this current experiment was not designed to explain the reason for the existence of the behavioral difference. Many interesting issues are still left unanswered. For example, do younger children cooperate less because of their lack of reasoning ability or because the emotional response clouds their decision-making? Do they use simpler strategies and/or are they unable to put themselves into another person’s shoes? These questions are worthy of future research.
Appendix B. Complete experimental data
Sample proportion of session 07E1, subject number: 32.
Period Individual behavior Pair behavior
Cooperative Non-cooperative Cooperative Hostile Others
1 0.3438 0.6563 0.1875 0.5000 0.3125
2 0.3125 0.6875 0.2500 0.6250 0.1250
3 0.3438 0.6563 0.1875 0.5000 0.3125
4 0.4375 0.5625 0.3125 0.4375 0.2500
5 0.4063 0.5938 0.2500 0.4375 0.3125
6 0.3750 0.6250 0.2500 0.5000 0.2500
7 0.1875 0.8125 0.1250 0.7500 0.1250
8 0.5313 0.4688 0.3125 0.2500 0.4375
9 0.2813 0.7188 0.1875 0.6250 0.1875
10 0.3125 0.6875 0.2500 0.6250 0.1250
Average 0.3531 0.6469 0.2313 0.5250 0.2438
Sample proportion of session 07E2, subject number: 32.
Period Individual behavior Pair behavior
Cooperative Non-cooperative Cooperative Hostile Others
1 0.2813 0.7188 0.0000 0.4375 0.5625
2 0.2188 0.7813 0.0000 0.5625 0.4375
3 0.4375 0.5625 0.2500 0.3750 0.3750
4 0.2813 0.7188 0.1250 0.5625 0.3125
5 0.3750 0.6250 0.1875 0.4375 0.3750
6 0.3750 0.6250 0.1875 0.4375 0.3750
7 0.4688 0.5313 0.1250 0.1875 0.6875
8 0.3750 0.6250 0.0625 0.3125 0.6250
9 0.4063 0.5938 0.3125 0.5000 0.1875
10 0.5000 0.5000 0.3125 0.3125 0.3750
Average 0.3719 0.6281 0.1563 0.4125 0.4313
Sample proportion of session 07E3, subject number: 32.
Period Individual behavior Pair behavior
Cooperative Non-Cooperative Cooperative Hostile Others
1 0.5938 0.4063 0.3125 0.1250 0.5625
2 0.5938 0.4063 0.3125 0.1250 0.5625
3 0.5625 0.4375 0.3750 0.2500 0.3750
4 0.4688 0.5313 0.1875 0.2500 0.5625
Period Individual behavior Pair behavior
Cooperative Non-Cooperative Cooperative Hostile Others
6 0.4375 0.5625 0.1875 0.3125 0.5000
7 0.4688 0.5313 0.2500 0.3125 0.4375
8 0.5625 0.4375 0.3750 0.2500 0.3750
9 0.5000 0.5000 0.3125 0.3750 0.3125
10 0.6875 0.3125 0.5000 0.1250 0.3750
Average 0.5469 0.4531 0.3125 0.2250 0.4625
Sample proportion of session 07N2, subject number: 34.
Period Individual behavior Pair behavior
Cooperative Non-Cooperative Cooperative Hostile Others
1 0.3235 0.6765 0.1765 0.5294 0.2941
2 0.2353 0.7647 0.0588 0.5882 0.3529
3 0.4706 0.5294 0.2941 0.3529 0.3529
4 0.3529 0.6471 0.1765 0.4706 0.3529
5 0.3529 0.6471 0.1765 0.4706 0.3529
6 0.3824 0.6176 0.1765 0.4118 0.4118
7 0.4706 0.5294 0.2941 0.3529 0.3529
8 0.4412 0.5588 0.2353 0.3529 0.4118
9 0.4118 0.5882 0.1176 0.2941 0.5882
10 0.3824 0.6176 0.2941 0.5294 0.1765
Average 0.3824 0.6176 0.2000 0.4353 0.3647
Sample proportion of session 07N3, subject number: 34
Period Individual behavior Pair behavior
Cooperative Non-cooperative Cooperative Hostile Others
1 0.5000 0.5000 0.2353 0.2353 0.5294
2 0.6471 0.3529 0.4118 0.1176 0.4706
3 0.3529 0.6471 0.0588 0.3529 0.5882
4 0.5000 0.5000 0.1176 0.1176 0.7647
5 0.4706 0.5294 0.2353 0.2941 0.4706
6 0.5588 0.4412 0.2941 0.1765 0.5294
7 0.3529 0.6471 0.0588 0.3529 0.5882
8 0.5000 0.5000 0.2353 0.2353 0.5294
9 0.5588 0.4412 0.2353 0.1176 0.6471
10 0.5294 0.4706 0.2941 0.2353 0.4706
Sample proportion of session 09E1, subject number: 34.
Period Individual behavior Pair behavior
Cooperative Non-cooperative Cooperative Hostile Others
1 0.3235 0.6765 0.1176 0.4706 0.4118
2 0.4118 0.5882 0.1176 0.2941 0.5882
3 0.4412 0.5588 0.1176 0.2353 0.6471
4 0.3235 0.6765 0.2353 0.5882 0.1765
5 0.4706 0.5294 0.2941 0.3529 0.3529
6 0.4118 0.5882 0.2353 0.4118 0.3529
7 0.3235 0.6765 0.1176 0.4706 0.4118
8 0.4412 0.5588 0.1176 0.2353 0.6471
9 0.3529 0.6471 0.0588 0.3529 0.5882
10 0.4118 0.5882 0.1176 0.2941 0.5882
Average 0.3912 0.6088 0.1529 0.3706 0.4765
Sample proportion of session 09E2, subject number: 34.
Period Individual behavior Pair behavior
Cooperative Non-cooperative Cooperative Hostile Others
1 0.3824 0.6176 0.1176 0.3529 0.5294
2 0.3529 0.6471 0.0588 0.3529 0.5882
3 0.2941 0.7059 0.0588 0.4706 0.4706
4 0.3824 0.6176 0.1176 0.3529 0.5294
5 0.4118 0.5882 0.2941 0.4706 0.2353
6 0.3529 0.6471 0.0588 0.3529 0.5882
7 0.3529 0.6471 0.1765 0.4706 0.3529
8 0.3824 0.6176 0.1176 0.3529 0.5294
9 0.3824 0.6176 0.1176 0.3529 0.5294
10 0.4706 0.5294 0.2941 0.3529 0.3529
Average 0.3765 0.6235 0.1412 0.3882 0.4706
Sample proportion of session 09E3, subject number: 34.
Period Individual behavior Pair behavior
Cooperative Non-cooperative Cooperative Hostile Others
1 0.3824 0.6176 0.1176 0.3529 0.5294
2 0.4706 0.5294 0.1176 0.1765 0.7059
3 0.5588 0.4412 0.4118 0.2941 0.2941
Period Individual behavior Pair behavior
Cooperative Non-cooperative Cooperative Hostile Others
5 0.6176 0.3824 0.4118 0.1765 0.4118
6 0.4706 0.5294 0.0588 0.1176 0.8235
7 0.3529 0.6471 0.1176 0.4118 0.4706
8 0.4118 0.5882 0.1765 0.3529 0.4706
9 0.4118 0.5882 0.1765 0.3529 0.4706
10 0.4412 0.5588 0.1765 0.2941 0.5294
Average 0.4618 0.5382 0.2000 0.2765 0.5235
Sample proportion of session 09N2, subject number: 30.
Period Individual behavior Pair behavior
Cooperative Non-cooperative Cooperative Hostile Others
1 0.5333 0.4667 0.2667 0.2000 0.5333
2 0.2333 0.7667 0.1333 0.6667 0.2000
3 0.3000 0.7000 0.0667 0.4667 0.4667
4 0.4333 0.5667 0.1333 0.2667 0.6000
5 0.3000 0.7000 0.0000 0.4000 0.6000
6 0.3667 0.6333 0.2000 0.4667 0.3333
7 0.4000 0.6000 0.0667 0.2667 0.6667
8 0.2667 0.7333 0.0667 0.5333 0.4000
9 0.2000 0.8000 0.0667 0.6667 0.2667
10 0.1333 0.8667 0.0667 0.8000 0.1333
Average 0.3167 0.6833 0.1067 0.4733 0.4200
Sample proportion of session 09N3, subject number: 30.
Period Individual behavior Pair behavior
Cooperative Non-cooperative Cooperative Hostile Others
1 0.7000 0.3000 0.4667 0.0667 0.4667
2 0.6000 0.4000 0.2667 0.0667 0.6667
3 0.5000 0.5000 0.2000 0.2000 0.6000
4 0.4667 0.5333 0.2667 0.3333 0.4000
5 0.6667 0.3333 0.4667 0.1333 0.4000
6 0.4000 0.6000 0.2667 0.4667 0.2667
7 0.4667 0.5333 0.2667 0.3333 0.4000
8 0.4000 0.6000 0.2000 0.4000 0.4000
9 0.3667 0.6333 0.0667 0.3333 0.6000
10 0.4667 0.5333 0.2667 0.3333 0.4000
Sample proportion of session 11E1, subject number: 28.
Period Individual behavior Pair behavior
Cooperative Non-cooperative Cooperative Hostile Others
1 0.5000 0.5000 0.2143 0.2143 0.5714
2 0.3929 0.6071 0.0714 0.2857 0.6429
3 0.3214 0.6786 0.1429 0.5000 0.3571
4 0.5357 0.4643 0.2857 0.2143 0.5000
5 0.5000 0.5000 0.1429 0.1429 0.7143
6 0.4286 0.5714 0.2143 0.3571 0.4286
7 0.5357 0.4643 0.2857 0.2143 0.5000
8 0.3571 0.6429 0.1429 0.4286 0.4286
9 0.3929 0.6071 0.0000 0.2143 0.7857
10 0.3214 0.6786 0.1429 0.5000 0.3571
Average 0.4286 0.5714 0.1643 0.3071 0.5286
Sample proportion of session 11E2, subject number: 28.
Period Individual behavior Pair behavior
Cooperative Non-cooperative Cooperative Hostile Others
1 0.7500 0.2500 0.5714 0.0714 0.3571
2 0.5357 0.4643 0.1429 0.0714 0.7857
3 0.5357 0.4643 0.2143 0.1429 0.6429
4 0.5357 0.4643 0.2143 0.1429 0.6429
5 0.5000 0.5000 0.0714 0.0714 0.8571
6 0.5000 0.5000 0.2143 0.2143 0.5714
7 0.5714 0.4286 0.2857 0.1429 0.5714
8 0.5714 0.4286 0.2143 0.0714 0.7143
9 0.3929 0.6071 0.2143 0.4286 0.3571
10 0.3571 0.6429 0.0000 0.2857 0.7143
Average 0.5250 0.4750 0.2143 0.1643 0.6214
Sample proportion of session 11E3, subject number: 28.
Period Individual behavior Pair behavior
Cooperative Non-cooperative Cooperative Hostile Others
1 0.6071 0.3929 0.2143 0.0000 0.7857
2 0.6071 0.3929 0.2143 0.0000 0.7857
3 0.6071 0.3929 0.2857 0.0714 0.6429
Period Individual behavior Pair behavior
Cooperative Non-cooperative Cooperative Hostile Others
5 0.6071 0.3929 0.2857 0.0714 0.6429
6 0.5714 0.4286 0.2857 0.1429 0.5714
7 0.5714 0.4286 0.2143 0.0714 0.7143
8 0.6071 0.3929 0.2857 0.0714 0.6429
9 0.6071 0.3929 0.3571 0.1429 0.5000
10 0.5357 0.4643 0.1429 0.0714 0.7857
Average 0.5893 0.4107 0.2643 0.0857 0.6500
Sample proportion of session 11N2, subject number: 38.
Period Individual behavior Pair behavior
Cooperative Non-cooperative Cooperative Hostile Others
1 0.7632 0.2368 0.5789 0.0526 0.3684
2 0.6316 0.3684 0.3684 0.1053 0.5263
3 0.6579 0.3421 0.4211 0.1053 0.4737
4 0.5526 0.4474 0.2105 0.1053 0.6842
5 0.5526 0.4474 0.2105 0.1053 0.6842
6 0.4211 0.5789 0.1579 0.3158 0.5263
7 0.4474 0.5526 0.2105 0.3158 0.4737
8 0.5526 0.4474 0.2632 0.1579 0.5789
9 0.5263 0.4737 0.2632 0.2105 0.5263
10 0.6053 0.3947 0.3684 0.1579 0.4737
Average 0.5711 0.4289 0.3053 0.1632 0.5316
Sample proportion of session 11N3, subject number: 38.
Period Individual behavior Pair behavior
Cooperative Non-cooperative Cooperative Hostile Others
1 0.7895 0.2105 0.6316 0.0526 0.3158
2 0.6316 0.3684 0.4737 0.2105 0.3158
3 0.5789 0.4211 0.3684 0.2105 0.4211
4 0.5000 0.5000 0.3158 0.3158 0.3684
5 0.6579 0.3421 0.4737 0.1579 0.3684
6 0.6053 0.3947 0.4211 0.2105 0.3684
7 0.6579 0.3421 0.4737 0.1579 0.3684
8 0.6316 0.3684 0.4211 0.1579 0.4211
9 0.5789 0.4211 0.3684 0.2105 0.4211
10 0.5526 0.4474 0.4211 0.3158 0.2632
References
Buengtal, D.B., Lin, E.K., Sussking, J.E., 1995. Influences of affect on cognitive processes at different ages: why the change? In: Eisenberg, N. (Ed.), Social Development. Sage Publication, Thousand Oaks, CA.
Gibbons, J.D., Chakraborti, S., 1992. Nonparametric Statistical Inference. Marcel Dekker, New York. Harsanyi, J.C., 1977. Morality and the theory of rational behavior. Social Research 44, 623–656.
Karniol, R., 1995. Developmental and individual differences in predicting others’ thoughts and feelings: applying the transformation ruld model. In: Eisenberg, N. (Ed.), Social Development. Sage Publication, Thousand Oaks, CA.
Kohlberg, L., 1969. Stage and sequence: the cognitive-developmental approach to socialization. In: Goslin, E. (Ed.), Handbook of Socialization Theory and Research. Rand-McNally, Chicago.
Piaget, J., 1928. The Child’s Conception of the World. Harcourt, Brace, New York.
Siegler, R.S., Thompson, D.R., 1998. Hey, would you like a nice cold cup of lemonade on this hot day? Children’s understanding of economic causation. Developmental Psychology 34, 146–160.