Effects of climate change and elevated CO
2on cropping
systems: model predictions at two Italian locations
Francesco N. Tubiello
a,*, Marcello Donatelli
b, C. Rosenzweig
a,
Claudio O. Stockle
caNASA GISS and Columbia Uni6ersity,2880 Broadway,New York,NY10025, USA bISCI Bologna,Via di Corticella 133,40128Bologna, Italy
cDepartment of Biological Systems Engineering,WSU,Pullman,WA, USA
Received 19 February 1999; received in revised form 13 September 1999; accepted 28 November 1999
Abstract
The potential effects of future climate change were investigated, corresponding to a doubling of atmospheric CO2
from 350 to 700 ppm, on agricultural production of four different cropping systems at two Italian locations, Modena and Foggia. Climate change scenarios, derived from two general circulation models (GCMs), were used as weather input to a soil-plant growth simulator, CropSyst. This model was recently modified to include the effects of elevated CO2on crop photosynthesis and transpiration. Six different crops in total were simulated at the two Italian sites. At
Modena, a 3-year maize – maize – wheat rotation and a 2-year soybean – barley – summer sorghum rotation were studied. At Foggia, a 2-year sunflower – wheat – fallow rotation, and a 2-year wheat – fallow – spring sorghum rotation were simulated. Results suggested that the combined effects of elevated atmospheric CO2and climate change at both
sites would depress crop yields if current management practices were not modified. Specifically, predicted warmer air temperatures accelerated plant phenology, reducing dry matter accumulation and crop yields by 10 – 40%. By investigating adaptation strategies, it was found that a combination of early planting for spring – summer crops and the use of slower-maturing winter cereal cultivars succeeds in maintaining crop yields at current levels at both sites. For irrigated maize and soybean production at Modena, 60 – 90% more irrigation water was required under climate change to keep grain yields at current levels. This implies that adaptation to climate change may be limited for irrigated crops, depending on site-specific water availability. © 2000 Elsevier Science B.V. All rights reserved.
Keywords:Cropping systems; Climate change; Elevated CO2; Adaptation
www.elsevier.com/locate/eja
1. Introduction
Atmospheric CO2 concentration has risen by
more than 30% since pre-industrial times, from equilibrium levels of about 280 ppm in 1880, to the currently observed levels of 365 ppm. This * Corresponding author. Tel.: +1-212-6785585; fax: +
1-212-6785552.
E-mail address:[email protected] (F.N. Tubiello).
increase is the direct result of human activities, primarily fossil fuel burning, cement production, and modified land-use patterns (IPCC, 1996).
Current anthropogenic CO2 emissions into the
atmosphere are about 8 GT C year−1, with
atmo-spheric levels increasing by almost 0.5% per year. If present emission patterns continue in the fu-ture, atmospheric CO2will be doubled by the end
of the 21st century. Simulations with global cli-mate models (GCMs) suggest that the projected increases in CO2 — the major greenhouse gas
after water vapour — will modify the global climate, by causing widespread rising of surface air temperatures; by altering precipitation pat-terns and the global hydrologic cycle; and by increasing the frequency of severe weather events, such as drought spells and flooding (IPCC, 1996). Agricultural crop production is one of the key human sectors that might be significantly affected by changes in climate and rising atmospheric CO2
concentrations, with consequences to global food supply (Rosenzweig and Hillel, 1998). Whereas elevated atmospheric CO2 increases plant
photo-synthesis rates and thus crop yields (Kimball, 1983), GCM-predicted increases in temperature and related precipitation changes may also affect crop photosynthesis, plant development rates, as well as water and nutrient budgets in the field (Long, 1991). Ultimately, the net effects of in-creased CO2 and climate change on crop yields
will depend on local conditions. For example, warmer spring – summer air temperatures might be beneficial to crop yields at northern temperate latitudes, where the length of growing seasons could increase. However, increased temperatures would likely be negative in Mediterranean-type environments, where high summer temperature and water stresses already limit crop production (Rosenzweig and Tubiello, 1997).
The response of agricultural systems to future climate change also depends strongly on manage-ment practices, such as the type and levels of water and nutrient applications. It is well-known that water limitation tends to enhance the positive crop response to elevated CO2, compared to
well-watered conditions (Chaudhuri et al., 1990; Kim-ball et al., 1995). The contrary is true for nitrogen limitation: well-fertilised crops respond more
posi-tively to CO2than less fertilised ones (Sionit et al.,
1981; Mitchell et al., 1993).
In cropping systems, a wide range of adapta-tions to climate change may exist, to maintain or even increase crop yields under future climate change compared to current conditions. After all, farmers are able to respond to changes in environ-mental conditions by choosing the most fa-vourable crops, cultivars, and cropping systems. Assessment studies should indicate which strate-gies might have a better chance to succeed in the future, and which specific climate conditions might represent a threshold for adaptation. Such thresholds may identify points of ‘no return’, where management adaptation strategies would not succeed at maintaining crop yields at present levels.
There are many factors that determine the re-sponse of crops to changes in climate conditions and to elevated CO2 concentration. Hence,
com-puter simulations have been widely used to analyse crop responses and adaptation strategies to future climate change. Several authors have pioneered the use of GCM output within crop models, in order to assess climate change impacts on world agriculture (e.g. Rosenzweig and Parry, 1994; Wolf and Van Diepen, 1995).
The objective of this work was to study the effects of climate change and elevated CO2 on
crop production at two Italian locations, Modena and Foggia. Yield responses were analysed and potential management adaptation strategies across the north – south gradient spanned by these two sites were studied. The analyses focused on local cropping systems at the two sites. Such an approach is useful because, for any given climate, cropping systems — and not single crops — constitute the fundamental units controlling the movement of nutrients and the patterns of water use, upon which crop productivity and farm vi-ability depend.
2. Material and methods
were the GISS model, developed at the NASA Goddard Institute for Space Studies (Hansen et al., 1988); and the GFDL model, developed at the Princeton Geophysical Fluid Dynamics Labora-tory (Manabe and Weatherland, 1987). Both models simulate atmospheric circulation and land-surface dynamics, with seasonal sea-surface temperatures specified as boundary conditions. Numerical resolution for both was 4°×5° lati-tude – longilati-tude (corresponding to average linear dimensions for each model grid-box of about 500 km), with nine vertical atmospheric layers. The GCM simulation outputs employed for this study corresponded to ‘doubled CO2 equilibrium
simu-lations’. In such experiments, the GCM is first run to equilibrium under current climatic conditions. Atmospheric CO2is then doubled instantaneously
and the model is run again until a new equi-librium is reached. The climate sensitivity to CO2
was similar for the two GCMs, i.e. both predicted an increase of roughly 4°C in global mean annual surface temperature for a doubling of atmospheric CO2.
Doubled CO2 equilibrium scenarios do not
provide information about the timing of the pro-jected climate change. Transient GCM scenarios, which simulate climate change as a function of time-dependent increases in CO2 concentration,
indicate that at current fossil fuel emission rates, the warming predicted with the equilibrium simu-lations could be realised by the end of the next century (IPCC, 1996).
2.1. Climate data and climate change scenarios
Observed meteorological data were collected at Modena (44.4 N, 10.55 E; years 1968 – 95) and Foggia (41.27 N, 15.34 E; 1952 – 91), representing complete time-series of daily maximum/minimum air temperature and precipitation. The weather generator ClimGen (Stockle et al., 1998; Stockle and Nelson, 1999a) was used to generate a 50-year ‘baseline’ climate scenario from the observed daily data. For the generation of precipitation and temperature, ClimGen follows a similar ap-proach to that introduced by Richardson and Wright (1984). Precipitation occurrence (wet or dry day), determined by using a first order
Markov chain, is the primary variable condition-ing the maximum and minimum temperature. The temperature generation process is based on serial and cross-correlation (maximum temperature, minimum temperature, and solar radiation) 3×3 matrices whose coefficients are locally calibrated. ClimGen allows for the reduction of these ma-trices to a 2×2 dimension so as to generate temperature at locations where no radiation data are available. Observed solar radiation data at both sites were available for short periods of time (4 years). The model of Donatelli and Camp-bell (1998), based on Bristow and CampCamp-bell (1984) and modified to improve the estimation of peak values of daily radiation, was used to esti-mate solar radiation from temperature for the remaining datasets.
‘Climate change’ (CC) scenarios were generated at each site using output of two atmospheric GCMs, using GCM data distributed by the US National Climate and Atmospheric Center (NCAR). Standard scenario generation method-ologies were followed, as discussed in Rosenzweig and Tubiello (1997). First, climatic data relative to baseline and ‘doubled-CO2’ GCM scenarios
were downscaled to each of the study sites by linear interpolation, using the four grid points nearest to the study site. Second, differences of mean monthly temperature and ratios of mean monthly precipitation and solar radiation were calculated between ‘doubled CO2’ and baseline
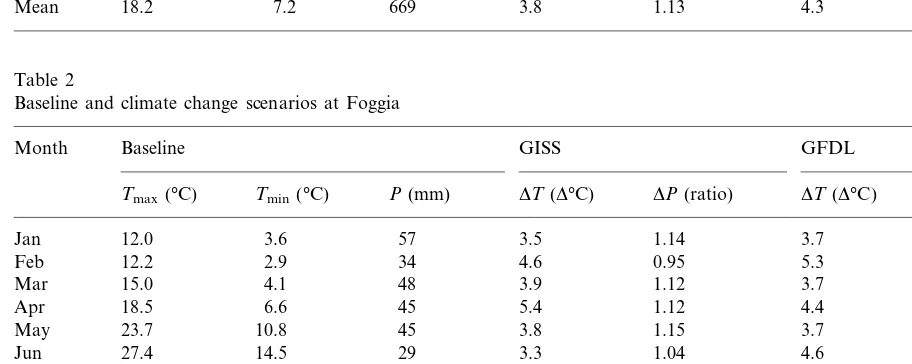
GCM simulations. Third, calculated temperature differences, and precipitation and solar radiation ratios, were applied to the baseline observed cli-mate files to generate the clicli-mate change scenar-ios. Tables 1 and 2 show values for observed climatic variables at both sites, along with the GCM-predicted changes in mean daily tempera-ture and precipitation. Changes in solar radiation were smaller than those shown for the latter two variables, and were not included in the tables.
model, which predicted precipitation increases for virtually all months at both sites, the GFDL model predicted up to 30% decrease in some spring and summer months.
Atmospheric CO2 concentrations were set at
350 ppm for the baseline simulations, and to 700 ppm for the climate change simulations. In GCM simulations for climate change, the forcing CO2
concentrations are often referred to as ‘effective’ concentrations, describing the radiative effects of
CO2 alone, or of CO2 plus a mix of other
green-house gases. The two CO2 values specified in the
GCM simulations were used by the authors ‘as is’, to avoid uncertainty in defining future composi-tion of other greenhouse gases. Lower CO2
con-centrations than used herein might also be consistent with the above GCM scenarios. The choices may tend to overestimate positive effects of CO2on crop growth and water use efficiency in
the simulations.
Table 1
Baseline and climate change scenarios at Modena
Baseline GISS GFDL
Baseline and climate change scenarios at Foggia
Month Baseline GISS GFDL
Table 3
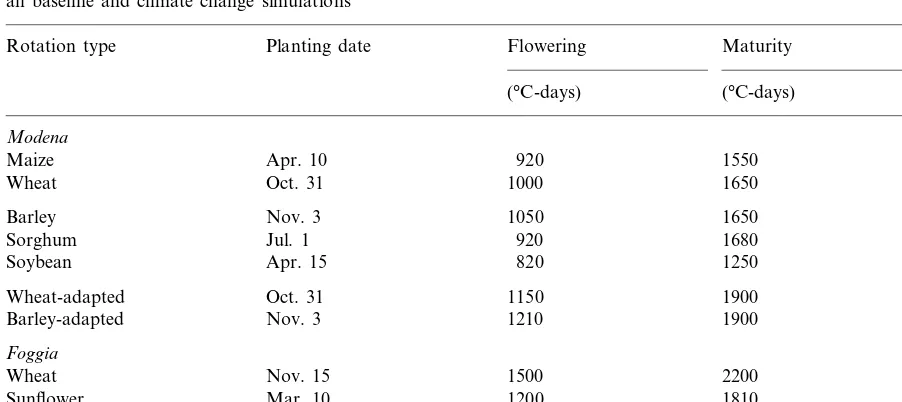
Rotation types, planting dates, temperature sum for phenological development from emergence until the indicated stage, as used in all baseline and climate change simulations
Flowering
Rotation type Planting date Maturity Irrigation
(°C-days) (°C-days)
Modena
920 1550
Apr. 10 Yes
Maize
Oct. 31
Wheat 1000 1650 No
1050
Barley Nov. 3 1650 No
Sorghum Jul. 1 920 1680 Yes
820 1250 Yes
Soybean Apr. 15
1150
Wheat-adapted Oct. 31 1900 No
Barley-adapted Nov. 3 1210 1900 No
Foggia
Nov. 15
Wheat 1500 2200 No
1200 1810
Mar. 10 No
Sunflower
850 1450
Spring sorghum Apr. 25 No
1770 2600
Nov. 15 No
Wheat-adapted
2.1.1. Crop model and equations for crop growth under ele6ated CO2
Baseline and climate change scenarios were used as weather inputs into a crop simulator. CropSyst was used (Stockle et al., 1994; Stockle and Nelson, 1999b), a crop simulator that com-putes water and nitrogen movement through the soil-plant continuum, crop phenological develop-ment, dry matter accumulation and crop yield, and which allows for multi-year, sequential simu-lations of cropping systems. The performance of the model has been evaluated for diverse environ-ments (e.g. Pala et al., 1996; Stockle et al., 1997; Pannkuk et al., 1998), including Northern and Central Italy (Donatelli et al., 1997).
CropSyst calculates dry matter accumulation as a function of daily intercepted solar radiation and daily crop transpiration, using constant coeffi-cients of radiation-use efficiency,RUE(Monteith, 1981), and transpiration efficiency,K(Tanner and Sinclair, 1983). Modifications were introduced to CropSyst in order to account for the effects of atmospheric CO2 concentration on plant growth
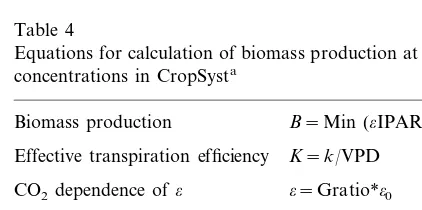
and water use. These modifications are similar to those presented by Stockle et al. (1992), and are summarised in Table 4. For more information on CropSyst growth and water-use calculations, the
reader is referred to Stockle et al. (1994) and Jara and Stockle (1999).
For selecting values ofGratio, a coefficient used to increase daily crop RUE (Table 4), one differ-entiated between C3 (wheat, barley, sunflower, and soybean) and C4 crops (maize and sorghum), but assumed the same response for crops within each of the two classes. For a doubling of atmo-spheric CO2 from 350 to 700 ppm, potential crop
growth was specified to increase by 25% for C3 crops, and by 10% for C4 crops.
2.2. Cropping systems simulations
At Modena, a 3-year maize – maize – wheat rota-tion and a 2-year soybean – barley – summer sor-ghum rotation, and at Foggia, a 2-year sunflower – wheat – fallow and a 2-year sunflower – wheat – fallow rotation were simulated (Table 3). CropSyst had been previously validated for the two sites by using meteorological and agronomic data observed in crop rotations similar to those simulated in this work (Donatelli et al., 1997).
of 50% plant available water in the upper 0.7 m of the soil profile. Irrigation water is readily avail-able in Modena for spring – summer crops such as sorghum, soybean and maize. In Foggia, no irri-gation was simulated, as water at this location is used preferentially to grow better-yielding, and more valuable vegetable crops, such as tomatoes.
2.3. Adaptation strategies
In addition to the baseline and climate change scenarios, crop simulations were performed for a ‘Climate Change plus Adaptation’ scenario at each site, based on the same weather inputs as the climate change scenario, but with different crop-ping practices.
One did not seek to maximise rotation yields under the future scenarios, but rather to investi-gate the effects of simple adaptation solutions, largely available to the farmer even today. These
adaptation strategies, tested in previous assess-ments of climate change and agriculture (Rosen-berg, 1993; Rosenzweig and Parry, 1994), include earlier planting of spring crops and adoption of slow maturing winter crop cultivars.
Early planting of spring crops helps to avoid plant drought and heat stress during the hotter and drier summer months predicted under climate change. Slower-maturing winter cultivars are needed to counterbalance the reduction of poten-tial crop yield due to accelerated phenological development in a warmer climate.
For the adaptation scenarios, planting of spring-sown crops (maize, sunflower, and sor-ghum) was anticipated by 2 weeks with respect to the baseline case. This choice roughly corre-sponded to having similar air temperatures at planting for both the climate change and the baseline simulations. ‘New’ adapted genotypes were used for simulating winter cereals like wheat and barley. Total required temperature sum to maturity was increased by 20%, while the dura-tion of vegetative and grain-filling periods were maintained in similar proportions to those defined in the original cultivars (Table 3). With this choice, the life-cycle of the adapted crop, under the warmer temperatures of the climate change scenarios, was comparable in length to that of the cultivars used for the baseline simulations.
3. Results and discussion
3.1. Baseline simulations
Baseline simulation results show the differences in climate and typical management practices be-tween Modena, a site characterised by a temper-ate, continental climtemper-ate, and Foggia, having a Mediterranean climate with low summer precipi-tation. Wheat yields were, on average, 60% higher in Modena (5.0 t DM ha−1) than in Foggia (3.3
t DM ha−1), due mostly to more favourable
water regimes and, to a smaller extent, slightly longer growing periods (Tables 5 and 6). The ratios of actual versus potential cumulative evapo-transpiration was 0.70 in Modena, compared to 0.61 in Foggia. Sorghum yields were similar at the Table 4
Equations for calculation of biomass production at given CO2 concentrations in CropSysta
Biomass production B=Min (oIPAR,KT)
K=k/VPD Effective transpiration efficiency
CO2dependence ofo o=Gratio*o0
CO2dependence ofk k=Gratio*k0/F
CO2dependence ofr r=r0*([CO2]/350)/Gratio
CO2dependence ofF F=(d+g(r0+ra)/ra)/ (d+g(r+ra)/ra)
Table 5
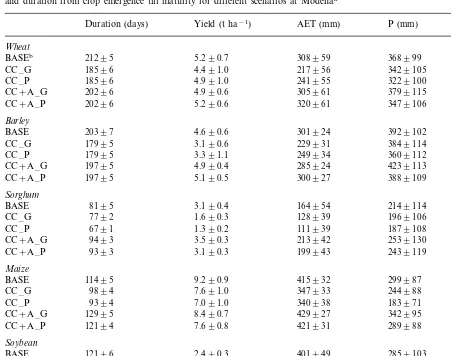
Yield (grain dry weight), actual cumulative evapotranspiration (AET), precipitation during the growth period (P), irrigation (Irr), and duration from crop emergence till maturity for different scenarios at Modenaa
Yield (t ha−1)
Duration (days) AET (mm) P (mm) Irr (mm)
Wheat
5.290.7
BASEb 21295 308959 368999
CC –G 18596 4.491.0 217956 3429105
4.991.0 241955
18596 3229100
CC –P
4.990.6 305961 3799115
CC+A –G 20296
5.290.6 320961 3479106
20296 CC+A –P
Barley
4.690.6 301924
20397 3929102
BASE
17995
CC –G 3.190.6 229931 3849114
17995
CC –P 3.391.1 249934 3609112
4.990.4 285924
19795 4239113
CC+A –G
CC+A –P 19795 5.190.5 300927 3889109
Sorghum
3.190.4
BASE 8195 164954 2149114 7921
1.690.3
CC –G 7792 128939 1969106 40923
1.390.2 111939
6791 1879108
CC –P 40922
9493
CC+A –G 3.590.3 213942 2539130 53929
3.190.3 199943 2439119 53931
9393 CC+A –P
Maize
9.290.9
BASE 11495 415932 299987 67935
7.691.0 347933
9894 244988
CC –G 28930
7.091.0 340938
CC –P 9394 183971 35930
8.490.7 429927
12995 342995
CC+A –G 97942
7.690.8 421931 289988 107941
CC+A –P 12194
Soybean
2.490.3
BASE 12196 401949 2859103 69950
1.790.3
CC –G 11194 362934 2749104 35930
1.690.2 369929
11093 2269100
CC –P 44927
12494
CC+A –G 2.790.3 430931 3519121 133959
CC+A –P 12293 2.790.3 476939 3169115 180950
aMean of 50 years and S.D.s. b
Simulation symbols: BASE: results from baseline simulations; CC –G: results from climate change simulations, GISS model; CC –P: results from climate change simulations, GFDL model; CC+A: results from climate change simulations, with adaptation.
two sites, although the use of irrigation in Mod-ena resulted in more stable yields (coefficient of variation, CV=13%) compared to rain-fed sor-ghum in Foggia, with twice as high CV coeffi-cients. Spring – summer crops like sorghum, sunflower, maize, and soybean received more pre-cipitation in Modena than in Foggia.
3.2. Climate change without adaptation
Effects of climate change and elevated CO2 on
crop yields were similar for both GCM climate
change scenarios, but strongly different among crop type and location (Tables 5 and 6). Without adaptation of management and genotype, the neg-ative effects on crop yields of warmer tempera-tures in the changed climate were stronger than the positive effects of elevated CO2. As shown in
de-Table 6
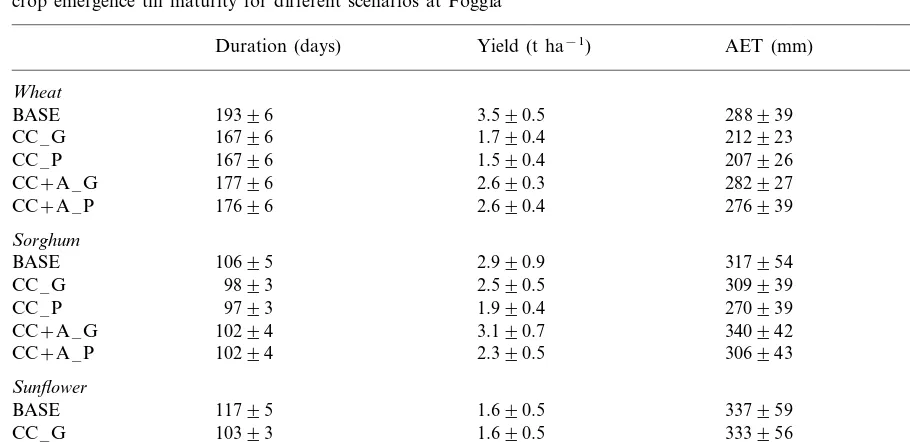
Yield (grain dry weight), actual cumulative evapotranspiration (AET), precipitation during the growth period (P), and duration from crop emergence till maturity for different scenarios at Foggiaa
Yield (t ha−1) AET (mm) P (mm)
Duration (days)
Wheat
3.590.5 288939
19396 3409102
BASE
1.790.4 212923
CC –G 16796 3419114
1.590.4 207926
16796 3359112
CC –P
CC+A –G 17796 2.690.3 282927 3589113
2.690.4 276939
17696 3529109
CC+A –P
Sorghum
2.990.9 317954
10695 149956
BASE
CC –G 9893 2.590.5 309939 149949
1.990.4 270939
9793 121946
CC –P
10294
CC+A –G 3.190.7 340942 167949
2.390.5
CC+A –P 10294 306943 125939
Sunflower
1.690.5 337959 190956
BASE 11795
1.690.5 333956
10393 186957
CC –G
1.590.5
CC –P 10493 305955 143949
1.990.5 352961
10993 212960
CC+A –G
11093
CC+A –P 1.890.5 326961 169951
aMean of 50 years and S.D.s. Simulation symbols are the same as in Table 5.
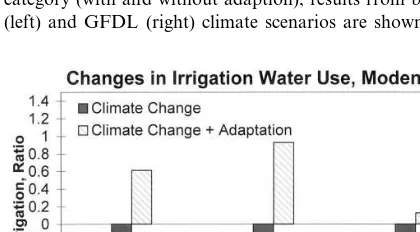
creased with climate change by 30 – 50% (Fig. 2). Sorghum yields decreased by 10 – 30%, whereas sunflower yields did not change.
Sunflower yields were similar at Foggia for both climate change scenarios, despite pro-nounced differences in precipitation predictions with the two GCMs during spring and summer (Table 2). This was likely an effect of the August – March fallow period, which preceded sunflower planting in the simulations. The replenishment of the soil – water profile in the fallow period buffered differences in precipitation between the two climate change scenarios during crop growth, from mid-March to mid-July. Similar results were not found for sorghum, perhaps due to the later planting compared to the sunflower crop, which translated into higher temperature and water stresses, and thus created higher crop vulnerabil-ity to precipitation regimes.
The decreases in crop yields under climate change were largely caused by shortened growth periods, due to accelerated phenology under in-creased air temperatures. All crops matured 2 – 4
weeks earlier compared to the baseline climate. Shorter growth periods resulted in less irrigation water was used at Modena for sorghum, maize, and soybean (Table 5 and Fig. 3). CV of yield, a measure of farming risk, increased significantly with climate change for all crops and both sites, with the largest increase in CV (60%) for wheat.
Fig. 2. Changes in crop yields at Foggia, as simulated with CropSyst. Graph shows the ratio of climate change scenarios, with and without adaptation, to baseline yields. Within each category (with and without adaption), results from both GISS (left) and GFDL (right) climate scenarios are shown.
efficiency, defined as seed dry matter yield pro-duced per irrigation water used (g DM l−1),
significantly decreased with climate change.
3.4. Limitations and uncertainties of modeling study
GCM predictions of climate change are not very reliable at small regional scales. Nonetheless, they are based on detailed descriptions of the major physical processes controlling climate, and provide coherent physical realizations of possible future changes in climate (Tubiello, 1997). In the growth simulations, however, one only considered predicted changes in mean temperature, precipita-tion, and solar radiaprecipita-tion, maintaining their daily and interannual variability at present values. Had a larger variability of temperature and precipita-tion been included under climate change, as cur-rent studies indicate, the study might have resulted in more negative effects of climate change on simulated crop yields (Mearns et al., 1992).
Secondly, it is possible that the equations used in this model to predict the effects of elevated CO2on crop yield, based on the concept of
radia-tion-use efficiency and performed in daily time-steps, are too simplistic to provide realistic predictions of yield. Some authors have argued that mechanistic feedbacks between photosyn-thetic rates and leaf stomatal conductance must be resolved, and that to this end smaller comput-ing time-steps are necessary (Grant et al., 1999). Others have used simple photosynthetic equations in a daily time-step crop model to reproduce observed yield under elevated CO2 in the field
(Tubiello et al., 1999).
In general, crop response to CO2 in the field
may be small compared to model predictions, usually parameterised with results from controlled experiments. Factors limiting crop response may include plant adaptation to CO2, source-sink
rela-tionships, pest-crop interactions, and site-specific characteristics such as soil structure, stoniness, salinity, etc. (e.g. Patterson and Flint, 1990). If these factors were incorporated in the simulation study, model predictions of crop response to ele-vated CO2 and climate change might have
pre-dicted more negative effects of climate change on crop yields.
Fig. 3. Changes in irrigation water use at Modena, expressed as ratios of climate change scenarios, with and without adap-tation, to baseline irrigation. Values have been averaged for the two general circulation model (GCM) simulations.
3.3. Climate change with adaptation
For the climate change scenarios with adapta-tion, yields for all crops were similar to those in the baseline climate, apart from maize, which were 13% lower than baseline yields (Table 5). For winter cereal crops like barley and wheat, the growth period duration of the adapted cultivars was, despite the warmer temperatures in the changed climate, only slightly smaller than that of the present varieties in the baseline climate.
4. Conclusions
Results from this study show that the negative effects of climate change in the coming century on existing cropping systems in Italy may be strong, but that they could be attenuated by using simple adaptation strategies involving both management and breeding techniques. The first adaptation is to advance the sowing date of spring-sown crops. The effectiveness of this strategy, however, de-pends on the level of solar radiation in spring, which quickly decreases early in the year at north-ern latitudes, eventually becoming limiting to veg-etative crop growth. Second, for winter-sown cereals (in this case wheat and barley), the yield of adapted, slower-maturing cultivars in a changed climate remained identical to yields of current cultivars in the baseline climate. Such positive effects of adapted cultivars may be significantly reduced by the onset of pest infestations, more likely under the longer crop exposure to warm temperatures, and which were not included in the simulations.
Results show that, despite the success in main-taining yields at baseline levels using adaptation, irrigation-use efficiency may strongly decrease un-der future climate change, due to the increased evaporative demands linked to higher tempera-tures. In the ‘climate change with adaptation’ simulations, 60 – 90% more irrigation water was required to maintain grain yields at current levels for maize and soybean.
These findings suggest that assessments of agri-cultural production should consider not only lev-els of crop yield, but should also include the trade-offs between crop production and resource availability, which influence farmer decision-mak-ing and profitability.
Acknowledgements
We thank two anonymous reviewers for several comments and suggestions, which improved the clarity and quality of this work. Francesco Tubiello and Cynthia Rosenzweig wish to ac-knowledge the Italian Ministry of the Environ-ment for funding that made this study possible.
Partial support for Marcello Donatelli was pro-vided by the PANDA project of the Italian Min-istry of Agriculture and Forestry. Francesco Tubiello was also sponsored in part by a grant from the Earth Institute of Columbia University.
References
Bristow, K., Campbell, G.S., 1984. On the relationship be-tween incoming solar radiation and daily maximum and minimum temperature. Agric. For. Meteorol. 31, 159 – 166. Chaudhuri, U.N., Kirkam, M.B., Kanemasu, E.T., 1990. Root growth of winter wheat under elevated carbon dioxide and drought. Crop Sci. 30, 853 – 857.
Donatelli, M., Campbell, G.S., 1998. A simple model to estimate global solar radiation. Proceedings of the 5th ESA Congress, Nitra, Slovak Republic, pp. 133 – 134.
Donatelli, M., Stockle, C.O., Ceotto, E., Rinaldi, M., 1997. Evaluation of CropSyst for cropping systems at two loca-tions of northern and southern Italy. Eur. J. Agron. 6, 35 – 45.
Grant, R.F., Wall, G.W., Kimball, B.A., Frumau, K.F.A., Pinter, P.J., Hunsaker, D.J., LaMorte, R.L., 1999. Crop water relations under different CO2and irrigation: testing of ecosys with the free air CO2enrichment (FACE) exper-iment. Agric. For. Metereol. 95, 27 – 51.
Hansen, J., Fung, I., Rind, D., Lebedeff, S., Ruedy, R., Russel, G., 1988. Global climate changes as forecast by the Goddard Institute for Space Studies three-dimensional model. J. Geophys. Res. 93 (D8), 9341 – 9364.
IPCC, Climate Change 1995: The science of Climate Change, 1996. In: Houghton, J.T., Meira Filho, L.G., Callander, B.A., Harris, N., Kattenberg, A., Maskell, K. (Eds.), Cam-bridge University Press, CamCam-bridge, p. 572.
Jara, J., Stockle, C.O., 1999. Simulation of corn water uptake using models with different levels of process detail. Agron. J. 91, 256 – 265.
Kimball, B.A., 1983. Carbon dioxide and agricultural yield: an assemblage and analysis of 430 prior observation. Agron. J. 75, 779 – 786.
Kimball, B.A., Pinter, P.J. Jr, Garcia, R.L., LaMorte, R.L., Wall, G.W., Hunsaker, D.J., Wechsung, G., Wechsung, F., Kartschall, T., 1995. Productivity and water use of wheat under free-air CO2 enrichment. Global Change Biol. 1, 429 – 442.
Long, S.P., 1991. Modification of the response of photosyn-thetic productivity to rising temperature by atmospheric CO2 concentrations: has its importance been underesti-mated? Plant Cell Env. 14 (8), 729 – 739.
Manabe, S., Weatherland, R.B., 1987. The effects of doubling the CO2concentration on the climate of a general circula-tion model. J. Atmos. Sci. 44, 1211 – 1235.
CERES-Wheat yields: sensitivity and 2×CO2 general circulation model studies. Agric. For. Meteorol. 62, 159 – 189. Mitchell, R.A.C., Mitchell, V.J., Driscoll, S.P., Franklin, J.,
Lawlor, D.W., 1993. Effects of increased CO2 concentra-tion and temperature on growth and yield of winter wheat at two levels of nitrogen application. Plant Cell Env. 16, 521 – 529.
Monteith, J.L., 1981. Climatic variations and the growth of crops. J. R. Met. Soc. 107, 749 – 774.
Patterson, D.T., Flint, E.P., 1990. Implications of increasing carbon dioxide and climate change for plant communities and competition in natural and managed ecosystems. In: Kimball, B.A., Rosenberg, N.J., Allen, L.H. Jr (Eds.), Impact of Carbon Dioxide, Trace Gases, and Climate Change on Global Agriculture. ASA Special Publication 53, Madison, Wisonsin, pp. 83 – 111.
Pala, M., Stockle, C.O., Harris, H.C., 1996. Simulation of durum wheat (triticum durum) growth under differential water and nitrogen regimes in a mediterranean type of environment using CropSyst. Agric. Syst. 51, 47 – 163. Pannkuk, C.D., Stockle, C.O., Papendick, R.I., 1998.
Valida-tion of CropSyst for winter and spring wheat under differ-ent tillage and residue managemdiffer-ent practices in a wheat-fallow region. Agric. Syst. 57, 121 – 134.
Richardson, C.W., Wright, D.A,1984. WGEN: A model for generating daily weather variables. U.S. Department of Agriculture, Agricultural Research Service, ARS-8, p. 83. Rosenberg, N.J., 1993. Towards an integrated assessment of
climate change: the MINK study. Clim. Change 24, 1 – 175. Rosenzweig, C., Hillel, D., 1998. Climate Change and the
Global Harvest. Oxford University Press, Oxford, UK. Rosenzweig, C., Parry, M.L., 1994. Potential impact of climate
change on world food supply. Nature 367, 133 – 138. Rosenzweig, C., Tubiello, F.N., 1997. Impacts of future
cli-mate change on Mediterranean agriculture: current methodologies and future directions. Mitig. Adapt. Strate-gies Clim. Change 1, 219 – 232.
Sionit, N., Mortensen, D.A., Strain, B.R., Hellmers, H., 1981. Growth response of wheat to CO2enrichment and differ-ent levels of mineral nutrition. Agron. J. 73, 1023 – 1027.
Stockle, C.O., Nelson, R., 1999. ClimGen, a weather generator program. Biological Systems Engineering Dept., Washing-ton State University, Pullman, WashingWashing-ton, USA. Stockle, C.O., Nelson, R., 1999. CropSyst, a cropping systems
simulation model. Biological Systems Engineering Dept., Washington State University, Pullman, Washington, USA. Stockle, C.O., Williams, J.R., Rosenberg, N.J., Jones, C.A., 1992. A method for estimating the direct and climatic effects of rising atmospheric carbon dioxide on growth and yield of crops: Part I. Modification of the EPIC model for climate change analysis. Agric. Syst. 38, 225 – 238. Stockle, C.O., Martin, S., Campbell, G.S., 1994. CropSyst, a
cropping systems model: water/nitrogen budgets and crop yield. Agric. Syst. 46, 335 – 359.
Stockle, C.O., Cabelguenne, M., Debaeke, P., 1997. Validation of CropSyst for water management at a site in southern France using submodels of different complexity. Eur. J. Agron. 7, 89 – 98.
Stockle, C.O., Bellocchi, G., Nelson, R., 1998. Evaluation of the weather generator ClimGen for several world locations. Seventh International Congress for Computer Technology in Agriculture, Florence, Italy, 15 – 18 November, 1998. Tanner, C.B., Sinclair, T.R., 1983. Efficient water use in crop
production: research or re-search? In: Taylor, H.M., Jor-dan, W.R., Sinclair, T.R. (Eds.), Limitations to Efficient Water Use in Crop Production. Am. Soc. Agron. Crop Sci. Soc. and Soil Sci. Soc. Am., Madison, WI, USA, p. 154. Tubiello, F.N., 1997. Global climate models. 3-D
representa-tions of the earth’s climate system. In: Cross, B. (Ed.), World Directory of Environmental Testing, Monitoring and Treatment 1997/98. James&James, London, UK, pp. 110 – 114.
Tubiello, F.N., Rosenzweig, C., Kimball, B.A., Pinter, P.J. Jr, Wall, G.W., Hunsaker, D.J., Lamorte, R.L., Garcia, R.L., 1999. Testing CERES-Wheat with FACE data: CO2 and water interactions. Agron. J. 91, 1856 – 1865.
Wolf, J., Van Diepen, C.A., 1995. Effects of climate change on grain maize yield potential in the European Community. Clim. Change 29 (3), 299 – 331.