MULTI-WAVELENGTH AIRBORNE LASER SCANNING FOR ARCHAEOLOGICAL
PROSPECTION
Christian Briese a,b *, Martin Pfennigbauer c, Andreas Ullrich c, M. Doneus d, b
a
Department of Geodesy and Geoinformation (GEO), Vienna University of Technology, Austria [email protected]
b LBI for Archaeological Prospection and Virtual Archaeology, Vienna, Austria c RIEGL Laser Measurement Systems GmbH, Horn, Austria
(mpfennigbauer, aullrich)@riegl.com
d VIAS – Vienna Institute for Archaeological Science, University of Vienna, Franz-Klein-Gasse 1, 1190 Vienna, Austria [email protected]
KEY WORDS: Airborne, Laser scanning, LIDAR, Radiometry, Calibration, Archaeology
ABSTRACT:
Airborne laser scanning (ALS) is a widely used technique for the sampling of the earth’s surface. Next to the widely used geometric information current systems provide additional information about the signal strength of each echo. In order to utilize this information, radiometric calibration is essential. As a result physical observables that characterise the backscatter characteristic of the sensed surface are available. Due to the active illumination of the surfaces these values are independent of shadows caused by sunlight and due to the simultaneously recorded 3D information a single-channel true orthophoto can be directly estimated from the ALS data. By the combination of ALS data utilizing different laser wavelengths a multi-wavelength orthophoto of the scene can be generated. This contribution presents, next to the practical calibration workflow, the radiometric calibration results of the archaeological study site Carnuntum (Austria). The area has been surveyed at three different ALS wavelengths within a very short period of time. After the radiometric calibration of each single ALS wavelength (532nm, 1064nm and 1550nm) a multi-channel ALS orthophoto is derived. Subsequently, the radiometric calibration results of the single- and multi-wavelength ALS data are studied in respect to present archaeological features. Finally, these results are compared to the radiometric calibration results of an older ALS data acquisition campaign and to results of a systematic air photo interpretation.
* Corresponding author.
1. INTRODUCTION
Airborne laser scanning (ALS resp. airborne LIDAR) is a widely used technique for the three-dimensional sampling of large (a few km² up to whole countries) landscape areas. The geometric information that can be extracted from the recorded ALS point cloud can be utilised for a lot of different applications (cf. Vosselman and Maas, 2010). One of the interesting application areas is archaeology where ALS turned out to be an extremely useful prospection technique (Cowley, 2011; Opitz and Cowley, 2013). Next to the geometric information, current ALS systems offer the recording of the signal strength of each echo. However, in order to estimate radiometric quantities that describe the backscatter characteristic of the sensed surfaces based on these recordings radiometric calibration is essential (Höfle and Pfeifer, 2007). While relative radiometric calibration tries to minimise radiometric differences within the neighbouring ALS strips, absolute radiometric correction allows the determination of mission independent radiometric quantities (cf. Briese et al., 2008; Kaasalainen et al., 2009).
Nowadays a wide range of different ALS sensors is available. The individual sensor properties (e.g. measurement range, instrument size, laser wavelength) are selected in respect to different application areas (small and large topography projects, bathymetric applications, or glaciography) and therefore ALS instruments with different laser wavelengths (typically 532nm,
1064nm and 1550nm) are available (Pfennigbauer and Ullrich, 2011). In order to study the different backscatter behaviour of these instruments Briese et al. (2012) presents a first study for the absolute radiometric calibration of multi-wavelength ALS data.
This paper presents the actual status of the on-going research in the field of radiometric calibration of ALS data (cf. Wagner et al., 2006; Briese et al., 2008; Lehner and Briese, 2010; Roncat et al. 2012; Briese et al. 2012). In the following section the basic theory and practical workflow for the calibration of monochromatic ALS data based on in-situ reference surfaces is summarised shortly. In contrast to the paper Briese et al. (2012), where the multi-wavelength ALS data was acquired by three independent flight missions that cover a time span of approximately three months, the data of this archaeological study over the Roman site of Carnuntum (Austria) was acquired by two flight missions (both flights with an aircraft equipped with two ALS sensors) within four days (cf. section 3). This very short time period should guarantee a more or less stable reflectance behaviour of the sensed study site for all utilized wavelengths. The practical mono- and multi-wavelength calibration results are presented in section 4. Furthermore, this section includes a study of archaeological features sensed by the different wavelengths. Additionally, a further comparison to an older ALS flight mission and to the results of a systematic air photo interpretation is provided. Finally, the paper is summarised and an outlook into further work is provided. International Archives of the Photogrammetry, Remote Sensing and Spatial Information Sciences, Volume XL-5/W2, 2013
2. RADIOMETRIC CALIBRATION OF ALS DATA
2.1 Theoretical remarks
The physical basis of the radiometric calibration of ALS data is the radar equation (Jelalian, 1992; Wagner, 2010). It describes the relation of the transmitted laser power Pt and the detected
power of its echo Pr. Based on this equation the backscatter
properties of extended single laser echoes can be estimated with the help of the ALS observations (Range, Amplitude and Echo width) and a so-called calibration constant Ccal. Ccal may include sensor specific factors as well as the atmospheric attenuation of the laser signal and is considered to be constant for one flight mission with a certain ALS instrument. In order to estimate the value for Ccal in-situ reference targets with known reflectance behaviour for the utilised ALS wavelenght are essential. Based on all ALS echoes within the reference areas Ccal can be determined. When utilising the radar resp. laser equation the backscatter cross section (unit: m²) can be directly estimated for each single echo. The subsequent consideration of the individual range dependent laser footprint area yields the backscatter coefficient (unit: m²m-²). Furthermore, Lehner and Briese (2010) propose the usage of the diffuse reflectance measure d (unit: m²m-²) that assumes a local Lambertian
reflectance behaviour of the sensed surface. Further details can be found in the paper Briese et al. (2012).
2.2 Practical workflow
For the practical radiometric calibration the ALS trajectory, the ALS observations (Range, Amplitude and Echo width) and in-situ reference targets are essential. Based on the reference targets and the ALS observations Ccal can be determined for a specific flight mission. Subsequently, in order to calculate d for
each single ALS echo the local incidence angle (based on the
1. Selection of the in-situ reference targets based on the ALS flight plan
2. Determination of the incidence angle dependent reflectance d of the reference surfaces utilising a
spectrometer or reflectometer (cf. Briese et al., 2008) that operates at the same ALS wavelength
3. Recording of meteorological data (aerosol type, visibility, water vapour, etc. for the estimation of an atmospheric model) during the flight mission in order to estimate the atmospheric transmission factor (if not available this term can be included in Ccal)
4. Full-waveform decomposition (echo extraction and estimation of echo parameters)
5. Direct georeferencing of the ALS echoes and maybe strip adjustment in order to get an advanced relative and absolute georeferencing of the ALS data
6. Estimation of the local surface normal in order to consider the local incidence angle
7. Estimation of Ccal based on the ALS echoes within the in-situ reference targets (e.g. defined by a polygon area) 8. Radiometric calibration of all echoes based on the
determined value of Ccal. This leads to the additional echo attribute d for each single ALS echo.
3. DATA ACQUISITION
3.1 General remarks
Due to several technical and commercial restrictions, no compact multi-wavelength ALS system is currently commercially available (cf. Pfennigbauer and Ullrich, 2011). Therefore, different ALS sensors have to be utilised in order to acquire multi-wavelength ALS data. In contrast to the previous study in Briese et al. (2012) a flight campaign with two simultaneously operating ALS sensors mounted in one aircraft (in a nose pod) could be performed. Therefore, only two flight missions (mission 1: RIEGL VQ-820-G (532nm) and RIEGL VQ-580 (1064nm); mission 2: RIEGL VQ-820-G (532nm) and RIEGL VQ-480i (1550nm)) for the acquisition of three different ALS wavelengths were necessary. Furthermore, the data acquisition time frame could be reduced from three month to just 4 days.
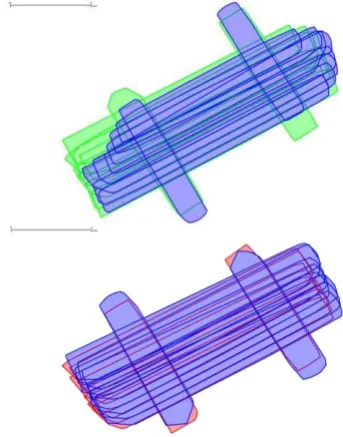
For both flight missions the same flight plan was utilised. In order to study the multi-wavelength ALS data for the application in archaeological prospection the Roman site of Carnuntum, once capital of the Roman province Pannonia, was selected. Here the buried Roman remains of two cities (the Canabae legionis around the legionary fortress and the civil town west of it) often become visible due to difference in vegetation growth on top of the arcchaeological remains (so called cropmarks - see also Doneus et al. 2013). In the following subsections a brief description of the individual flight missions is provided. Figure 1 provides an overview of the boundaries of each acquired ALS strip (colour coded per ALS system) per flight mission. In both flights two scanners share the same flight trajectory, but due to the different viewing angle of the RIEGL VQ-820-G to the other two nadir looking instruments slightly different boundary areas can be recognised. For the in-situ reference surfaces two asphalt regions and an area with a bright pavement in the western part of the project area were selected.
Figure 1. 2D overview of the ALS flight missions of the study area Carnuntum (Austria); the length of the displayed scale bar
is 2 km; Upper image: boundaries of the ALS strips of flight mission 1: RIEGL VQ-820-G (blue); RIEGL VQ-580 (green); Lower image: boundaries of the ALS strips of flight mission 2:
RIEGL VQ-820-G (blue); RIEGL VQ-480i (red). International Archives of the Photogrammetry, Remote Sensing and Spatial Information Sciences, Volume XL-5/W2, 2013
3.2 Flight missions
The first flight mission with the ALS instruments RIEGL VQ-820-G (laser wavelength: 532nm) and RIEGL VQ-580 (1064nm) was performed on the 24th of Mai 2013. All in all 10 flight strips (including two cross strips) were acquired over the area of Carnuntum. Due to an optimised scan pattern of the ALS instrument RIEGL VQ-820-G for hydrographical data acquisition (see Riegl, 2013) the begin and end of each ALS strip is, in contrast to the strip boundaries of the two other ALS systems, a curved boundary line section (cf. blue boundaries in Fig. 1). Additionally, the RIEGL VQ-820-G strips in the northern western region are shorted. The overlap of the strips was approx. 80% and the overall point density (last echo) of both data sets is more than 20 points per m².
The data of the second flight mission with the ALS instruments RIEGL 820-G (laser wavelength: 532nm) and RIEGL VQ-480i (1550nm) was acquired on the 28th of Mai 2013. For the data acquisition the same flight plan was selected. Similar to the first flight mission the point density of both ALS sensors is more than 20 points per m².
4. RESULTS AND DISCUSSION
This section summarises the radiometric calibration results of the two flight missions (section 3) and the multi-wavelength ALS orthophoto is presented (subsection 4.1). Additionally, the archaeological features in one area of the study site are studied in detail in subsection 4.2. Furthermore, this section provides a comparison to a further older ALS flight mission (1550nm) and a comparison with an a systematic air photo interpretation of the test area.
4.1 Radiometric calibration results
The radiometric calibration results of the whole area from flight mission 1 are presented in Figure 2, while the results of flight mission 2 can be inspected in Figure 3.
Figure 2. Calibrated radiometric reflectance of flight mission 1; Upper image: 1064nm; Lower image: 532nm; both are linear
scaled from 0 (black) to 0.5 (white).
Figure 3. Calibrated radiometric reflectance of flight mission 2; Upper image: 1550nm; Lower image: 532nm; both are linear
scaled from 0 (black) to 0.5 (white).
Compared to the other wavelengths the calibrated 532nm flights are quite dark (typical values below 0.25). The 1064nm and 1550nm values are typically in the range of 0 to 0.5. When comparing both wavelengths it can be seen that the data set acquired with 1064nm is significantly brighter than the one with 1550nm. The subsequent Figure 4 presents a multi-wavelength visualisation of the study area. The image is generated by the fusion of the different channels (for the 532nm data set the calibration results of flight mission 1 are selected). In order to enhance the 532nm information the data set is scaled in the range of 0 to 0.25. Figure 5 presents further details of the multi-wavelength image.
Figure 4. Active multi-wavelength reflectance image estimated from radiometrically calibrated ALS data sets; 532nm (linear scale from 0 (black) to 0.25 (blue)); 1064nm (linear scale from 0 (black) to 0.5 (green)) and 1550nm (linear scale from 0 (black) to 0.5 (red)).
Figure 5. Two detail visualisations of Figure 4 (same linear scale); Upper image: archaeological park in Carnuntum; Lower image: area in the vicinity of the military amphitheatre (south-west corner) with an archaeological relevant Roman road from the amphitheatre to north-east.
Figure 5 shows that different field systems can easily be identified. Furthermore, asphalt streets, trees, and buildings can easily be identified.
4.2 Archaeological features observed with different wavelengths
The two flight missions allow the analysis of the different reflectance behaviour of archaeological features at three different laser wavelengths. For the analysis a small test area in the western part of the study area (approx. 380m by 220m) was selected (see Figure 6).
As it can be seen in the multi-wavelength visualisation, differences in vegetation growth (so called cropmarks) outline a Roman road crossing the area from the south-west to the north-east direction. Furthermore, linear features perpendicular to the street can be identified. They can be interpreted as foundations of Roman houses on both sides of the road. In order to study the contribution of the individual wavelength the further visualisations in Figure 6 can be utilised. While the street is nicely visible in the calibrated 532nm and 1550nm ALS reflectance images, the feature completely disappears in the 1064nm data set. Especially in the 1550nm data set many further linear details can be identified. It can be clearly seen that the presence of features is significantly related with a specific wavelength (1550nm is especially sensitive for the presence of water). It has to be stressed that all the visualisations are linear
scaled and a different scaling might help for the archaeological interpretation to improve the contrast of the actual features.
Figure 6. Archaeological features in the western part of the study area Carnuntum (approx. size 380m*220m); Upper image: multi-wavelength image (scaling figure 4); Upper middle image: 532nm (scaling Figure 2); Lower middle image: 1064nm (scaling Figure 2); Lower image: 1550nm (scaling Figure 3).
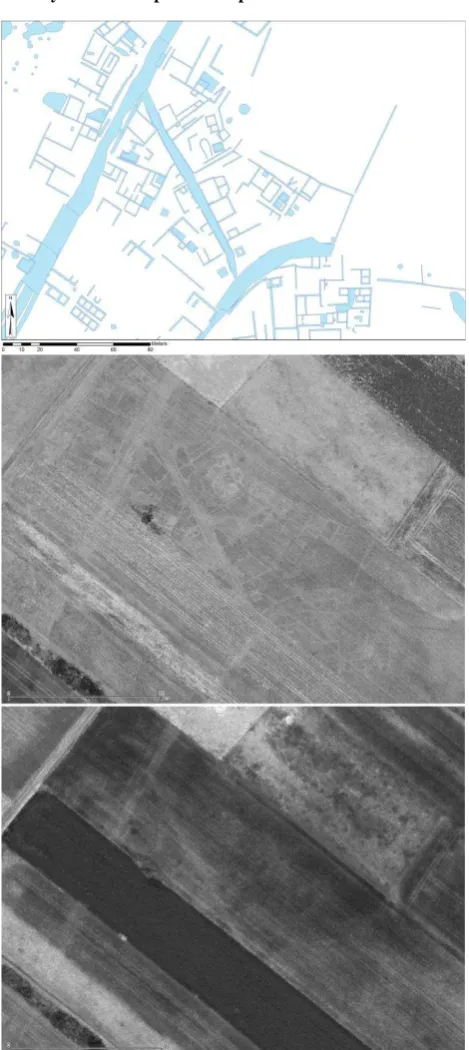
4.3 Comparison to a different ALS data sets with a systematic air photo interpretation
Figure 7. Archaeological features in the eastern part of the study area Carnuntum (approx. size 240m*180m)); Upper image: systematic air photo interpretation of archaeological features; Middle image: calibrated 1550nm image (flight: 18th of June 2012); Lower image: calibrated 1550nm image (flight: 28th of Mai 2013).
This section is intended to compare the features of the presented second flight mission (calibrated 1550nm reflectance image) with a further ALS flight (data acquisition at the 18th of June 2012 with a RIEGL Q680i) of the study area with the same ALS wavelength. Furthermore, the results of a systematic air photo interpretation are available (Doneus et al. 2013). The results of one test area in the eastern part of the study site (approx.
240m*180m) can be inspected in Figure 7. While the calibrated 1550nm ALS data set acquired in the year 2012 presents a huge variety of archaeological features, the ALS data set from 2013 does only indicate the main road features.
This example nicely illustrates that next to the selected wavelength the time of data acquisition and the current status of the surface resp. vegetation on top of the surface has a significant impact on the reflectance behaviour. While ALS reflectance can be acquired independently from the sun light the actual surface properties play an important role for archaeological prospection.
5. SUMMARY AND OUTLOOK
This paper shortly summarises the procedure of radiometric calibration of ALS data. The calibration procedure is applied for three different ALS wavelengths in order to study the possibilities of archaeological prospection based on ALS reflectance data. Next to mono-wavelength visualisations of the calibrated reflectance data, multi-wavelength images are presented. The analysis of two different small areas with archaeological features within the study site concludes the paper.
It is demonstrated that the developed framework for radiometric calibration can be applied in practice for different ALS wavelengths (see also Briese et al., 2012). Section 4 illustrates the different reflectance behaviour dependent on the selected laser wavelength. While the reflectance of 532nm is in general comparable low, the 1064nm and 1550nm results significantly differ in certain areas. While in the first test area (Figure 6) the 1550nm data set nicely allows to extract archaeological features, in the second example (Figure 7) the number of visual features is - compared to the results of the year 2012 (same wavelength) - quite low. This example clearly illustrates the importance of the actual surface properties for the delineation of archaeological features. Next to the selection of the appropriate wavelength the consideration of the actual surface status is essential for archaeological prospection.
Our future research will focus on the further development of the radiometric calibration process in order to reduce some remaining systematic radiometric strip differences. Furthermore, more practical experiences have to be gained in order to understand the different reflectance behaviour for the different laser wavelengths in more detail. A systematic analysis of the results (e.g. with ground truth data and/or simultaneous acquired aerial images or aerial image spectroscopy data) should allow to understand the resulting radiometric quantities in a better practical manner.
All in all the paper presents the practical potential of calibrated radiometric information from ALS data for the prospection of archaeological features. Furthermore, it provides calibrated multi-wavelength information (acquired within a very short time period) and might provide first ideas for the future usage of multi-wavelength ALS data for different application areas.
ACKNOWLEDGEMENTS
The Ludwig Boltzmann Institute for Archaeological Prospection and Virtual Archaeology (archpro.lbg.ac.at) is based on an international cooperation of the Ludwig Boltzmann Gesellschaft (A), the University of Vienna (A), the Vienna University of Technology (A), the Austrian Central Institute for International Archives of the Photogrammetry, Remote Sensing and Spatial Information Sciences, Volume XL-5/W2, 2013
Meteorology and Geodynamic (A), the office of the provincial government of Lower Austria (A), Airborne Technologies GmbH (A), RGZM-Roman- Germanic Central Museum Mainz (D), RAÄ-Swedish National Heritage Board (S), IBM VISTA-University of Birmingham (GB) and NIKU-Norwegian Institute for Cultural Heritage Research (N). The authors thank Dr. Geert Verhoeven and Martin Wieser for the acquisition and processing of the spectrometer resp. reflektometer data.
REFERENCES
Briese, C., Höfle, B., Lehner, H., Wagner, W., Pfennigbauer, M., Ullrich, A., 2008. Calibration of full-waveform airborne laser scanning data for object classification. In: Turner, M.D., Kamerman, G.W. (Eds.), Proceedings of SPIE Laser Radar Technology and Applications XIII, vol. 6950, pp. 0H1–0H8.
Cowley, David (Hg.), 2011. Remote Sensing for Archaeological Heritage Management. Proceedings of the 11th EAC Heritage Management Symposium, Reykjavik, Iceland, 25-27 March 2010. Budapest: Archaeolingua; EAC (Occasional Publication of the Aerial Archaeology Research Group, 3).
Doneus, M., Gugl, C., Doneus, N., 2013. Die Canabae von Carnuntum. Eine Modellstudie der Erforschung römischer Lagervorstädte ; von der Luftbildprospektion zur siedlungsarchäologischen Synthese. Wien: Verl. der Österr. Akad. d. Wiss. (47).
Höfle, B., Pfeifer, N., 2007. Correction of laser scanning intensity data: Data and model-driven approaches. ISPRS Journal of Photogrammetry and Remote Sensing 62(6).
Jelalian, A. V., 1992. Laser Radar Systems. Artech House, Boston.
Kaasalainen, S., Hyyppa, H., Kukko, A., Litkey, P., Ahokas, E., Hyyppa, J., Lehner, H., Jaakkola, A., Suomalainen, J., Akujarvi, A., Kaasalainen, M., Pyysalo, U., 2009. Radiometric calibration of lidar intensity with commercially available reference targets. IEEE Transactions on Geoscience and Remote Sensing 47(2), pp. 588-598.
Lehner, H., Briese, C., 2010. Radiometric calibration of full-waveform airborne laser scanning data based on natural surfaces. In: ISPRS Technical Commission VII Symposium 2010: 100 Years ISPRS – Advancing Remote Sensing Science. International Archives of the Photogrammetry, Remote Sensing and Spatial Information Sciences 38 (Part 7B), Vienna, Austria, pp. 360– 365.
OPALS, 2013. http://www.geo.tuwien.ac.at/opals/. Homepage of the software OPALS, TU Vienna, accessed: July 2013.
Opitz, Rachel S.; Cowley, David (Hg.), 2013: Interpreting archaeological topography. Airborne laser scanning, 3D data and ground observation. Oxford: Oxbow Books (Occasional Publication of the Aerial Archaeology Research Group, 5).
Pfennigbauer, M., Ullrich, A., 2011. Multi-Wavelength Airborne Laser Scanning. ILMF 2011, New Orleans, February 7-9, 2011.
Riegl, 2013. www.riegl.com. Homepage of the company RIEGL Laser Measurement Systems GmbH, accessed: July 2013.
Roncat, A, Pfeifer, N., Briese, C., 2012. A linear approach for radiometric calibration of full-waveform Lidar data ", Proc. SPIE 8537, Image and Signal Processing for Remote Sensing XVIII, 853708 (November 8, 2012); doi:10.1117/12.970305
Vosselman and Maas, 2010. Airborne and Terrestrial Laser Scanning, Whittles Publishing, ISBN: 978-1904445876, 336 pages.
Wagner, W., 2010. Radiometric calibration of small footprint full-waveform airborne laser scanner measurements: Basic physical concepts. ISPRS Journal of Photogrammetry and Remote Sensing 65 (6 (ISPRS Centenary Celebration Issue)), pp. 505–513. International Archives of Photogrammetry, Remote Sensing and Spatial Information Sciences 38, Part 7B, pp. 360-365.
Wagner, W., Ullrich, A., Ducic, V., Melzer, T. and Studnicka, N., 2006. Gaussian decomposition and calibration of a novel small-footprint full-waveform digitising airborne laser scanner. ISPRS Journal of Photogrammetry and Remote Sensing 60(2), pp. 100–112.