SOCIO-ECONOMIC AND ECOLOGICAL TRANSFORMATIONS OF THE PERI-URBAN
REGION OF GURGAON: AN ANALYSIS OF THE TRICKLE-DOWN EFFECT IN THE
POST GLOBALIZATION ERA
A.Yadav a, *, M. Punia b
a Research Scholar, Centre for the Study of Regional Development Jawaharlal Nehru University (JNU) New Delhi – [email protected]
b Professor, Centre for the Study of Regional Development Jawaharlal Nehru University (JNU) New Delhi– [email protected]
KEY WORDS: Urbanization, Globalization, Socio-economic development, Trickle-down effect, Poverty and Vulnerability, Land use land cover change
ABSTRACT:
Economic processes are a manifestation of dynamic complex interdependent array of factors which involves resources, technology and an acting innovative human mind. Production, growth and development are the processes which has vast number of complex drivers, determinants and factors. Innovation, research, diffusion and dissemination are vital instrument of the economic processes of production, which are part of education. Whereas ecological transformations can be corroborated and analyzed by integrating remote sensing based information related to expansion of built-up area beyond city boundaries, extending to peripheries. City reflect economic, environmental, technological and social processes in their change, yet all are in turn profoundly driven by the urban spatial expansion. Metropolitan cities reflects expansion of existing urban and peri-urban areas with a significant socio-ecological transformation in terms of employment, education, and work force participation and land use changes. From the point of view of New Economic Geography (NEG) Theory 2009, the growth dynamic of metros is influenced by their proximity and dependence to a metropolis and the probable spillover effect. Entry point of discussion is the change in production of space in the post globalization era. It attempts to understand city morphology by using remote sensing datasets of LISS IV, IRS-P6 of 5.8 m spatial resolution for 2008 and 2013 and used Gurgaon Municipal Corporation’s (GMC) ward boundary to represent socio-political meaning of this expansion and ways of life within the suburb. To understand how city works, detailed analysis related occupational structure, education and informality of ward 31 of Gurgaon and two villages namely Behlpa, Fazalwas and ward 11 of Nuh ( Mewat) along with the village Gabsanpur is attempted as the spatial units of study.
* Corresponding and First Author.
1. INTRODUCTION
1.1 Contextualizing the Economic Space in Question
Human beings interact with the physical environment and construct their cultural landscape, this socio-economic interplay is an effort to make their lives better, and human beings economic activity is to fulfil their aspiration for better life. In pursuit of this betterment human being draw and redraw their pathways, pursuits, action and endeavours to achieve the desired outcome. But this want for betterment sometimes possess challenges to the ways, suspects their sustenance and question their outcomes. Human history is full of this questioning the existing and want for better this dialectics leads to partial change or sometime transformation in the socio-economic structure.one such structure is the human habitation .in traditional society the human habitation was predominantly rural, division of labour was primitive and means of production was rudimentary. But with advancement of technology the economic space is changing rapidly, differentiation and specialisation is the other name of modern division of labour. However the rural life in India is still characterized by farming, community life, social cohesion and a life which is predominantly governed by customs tradition and localized institutional structure. But with the advent of modernity the rural life is altered moulded, disturbed, and shaped by the processes emanating from urban core. Today the rural-urban both spatial units share a dynamic relation of economic and
social processes. In a rapidly expanding economy this interdependence of rural-urban has a vital role as most of the processes like migration, pressure on urban area and other important aspects are shaped by this relationship. With this dynamic relation of rural-urban interaction in terms of flows of goods and services the limits and boundaries of the two spatial units has been blurred in immediate past. Urban and urbanity has encroached in to views, expression and choices of rural life. Sometimes the rural landscape s is surrounded by hyper urban form structure and processes
Indian economy in the immediate past has emerged rapidly and globalizing very fast (Panagariya, 2008b). Opening up of world trade, development of advanced means of communication, internationalization of financial markets, increased mobility of persons, goods, capital, trade and transaction and world views has transformed the production of space of Gurgaon and its periphery.
Scholars of economics of agglomeration and development also assess contemporary economic landscape of India and projects its performance and challenges in various fascinating dimensions. Some see it as 'shinning India', 'amazing India', 'Make in India' or 'emerging giant' and the country’s 8% plus growth scenario during the Tenth Plan to recent times made the people more optimistic. Though the euphoria didn’t/may not last longer. But during these phases a lot changed in the economy of Gurgaon and in the fringes of it. Gurgaon which was selectively benefited by state led interventionist liberalized The International Archives of the Photogrammetry, Remote Sensing and Spatial Information Sciences, Volume XL-8, 2014
agenda, has experienced the forces of globalization. The
socio-Development which is largely considered a normative value laden, dynamic concept and carries different meanings for different people. In fact there is no agreement on the meaning of development among planners and thinkers either. Some people say it means increase in income, others lay emphasis on employment, income, quality of life, happiness and so on. Still others give stress on meeting the basic needs of the life of people. It is indeed so many things to so many people. The only thing on which everyone agrees is that, development is necessary and everyone wants it although in his own image and perhaps in his own way. As society is not a static thing so is its ideas, the change in society from traditional to modern is also a change in the ideas of disciplines. Development and its meaning has a spatial-temporal aspect, it has changed along with the change in societies. Human society has made a long journey through different stages. Along with this journey views, perspectives, concepts, ideas also changes and so is the meaning of development. For centuries it was understood as progress, as growth, as change or transformation as modernization and so on. In earliest time development was seen more as a progress purely economic progress, But over a time the notion of mere growth and economic progress as development faded away and development was seen in a more comprehensive way and economic progress and development were partitioned. One of the earliest inquiry was from Dudley Seers posed three basic questions about the meaning of development, what has been happening to poverty? What has been happening to unemployment? What has been happening to inequality? If all three of these have declined from high level, then the country is experiencing a phase of development. However Todaro (Todaro,2004) looks at development from a different vantage point according to him, development must be conceived of as a multi-dimensional process involving major changes in social structures, popular attitudes and national institutions as well as the acceleration of economic growth, the reduction of inequality and the eradication of absolute poverty. Dreze and Sen, 2005 has a different humanistic stand and looks at development in terms of the expansion of the real freedom that citizens enjoy to pursue the objectives they have and in this sense the expansion of human capability can be, broadly seen as the central feature of the process of development. Thus development is multi-dimensional phenomenon. Here we are looking at development through some of it components i.e. education, occupational structure, level of deprivation and vulnerabilities.
1.3 Philosophical outline and Methodology
The present work has adopted an inductive route of explanation.it generalize the peri-urban space from selected spatial units of analysis. Its vantage point is the change in production of space in the post globalization era. To assess the trickle down it uses the indicators of development and peep in to the level of poverty and vulnerabilities. Ecological aspect has been dealt in objective framework as it is more of a physical phenomenon or natural reality which is objective, has a pattern therefore the ontological approach is on discovering the patterns and generalization, and the episteme stands analytic. However in case of social reality which is multi-layered, vast,
unorganized, chaotic and dichotomous the ontology is understanding the human interaction and episteme is synthetic and the outcome may have high infallibility for universal application, since the outcome is heuristic in nature as the subject matter (human interactions) in question is dynamic, unpredictable and it is difficult to generalize therefore required to conceptualize.
Therefore a combination of qualitative and quantitative techniques has been used to sense the intricacies of changing ecological and cultural landscape. This study attempts to understand city morphology by using remote sensing datasets of LISS IV, IRS-P6 of 5.8 m spatial resolution for 2008 and 2013 and used Gurgaon Municipal Corporation’s (GMC) ward boundary to represent socio-political meaning of this expansion and ways of life within the suburb. To understand how city works, detailed analysis related occupational structure, education and informality, deprivation, poverty and vulnerability of ward 31 of Gurgaon and two villages namely Behlpa, Fazalwas and ward 11 of Nuh ( Mewat) along with the village Gabsanpur is attempted as the spatial units of study. This study attempts a multidisciplinary approach from remote sensing, geographic information system and social science disciplines to extract built-up area, to do spatial analysis and to understand sub-urbanism using remote sensing datasets and Socio-Economic Caste Census (SECC) survey 2011 datasets respectively.to look in to the informality NCEUS definition is adopted for industrial grouping National Industrial Classification (NIC) was applied on the SECC 2011 household level data. For occupational structure NCO at two digit level was explored. Various composite indices constructed by assigning weights for comparability.
1.4 Study Area
Spatial units of analysis chosen from both rural and urban area in a linear fashion from Gurgaon towards Mewat. Starting from one ward of Gurgaon and then two village of Gurgaon and one ward and village from Mewat therefore it covers the SW NCR region in linear fashion. The study look into the spatiality of the select indicators of development and their correlates.
2. SOCIO-ECONOMIC PROFILING
2.1 Education, occupation and informality
Education which is considered as one the deep determinants of growth and development, provides skill set prepare the human resource and creates employability.it is evident and widespread recognition that education is a major driver of economic competitiveness in an increasingly knowledge driven global economy.the role of technological capacity in development is coming to be viewed as central to the industrializing effort and as the driving factor in shaping economic development .However education is not the lone factor which create and shape the choice of occupation in India, child learn skills from his father and he passed on this to the posterity and it continues
.
Thus there is an effect of the caste system on occupational choice. But with the advent of modernity, education and skills set is shaping the choices and determining the occupational character of the young India. Gurgaon which is often projected and celebrated as a 'growth engine', 'hub of industry',' cyber city' but this kind of rosy picture and hyper- euphoric argument does not holds truth in terms of indicators of social The International Archives of the Photogrammetry, Remote Sensing and Spatial Information Sciences, Volume XL-8, 2014development like education.in terms of economic growth the city would have perform well above the expectations as it was an era of liberalization. Privatization gave tremendous boost by the introduction of new economic policy in 1991 that allowed de-licensing, relaxing entry restrictions. This heightened the competition among the industries that were monopolized by the public sector earlier. But this kind of market driven development has pocketed certain inlets in Gurgaon. Market led development has not provided a boost to sectors like education. Though the condition of education in comparison to mewat it looks comparatively better, since Mewat is one of the backward cultural region of Haryana its performance in almost all the indicators stands at bottom.
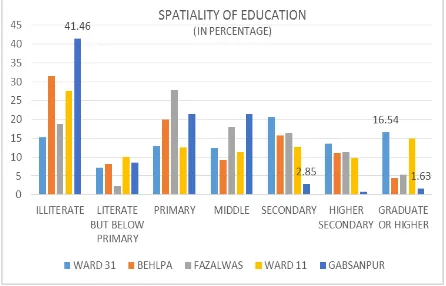
Figure 1. Figure spatial connotation of Education
Illiterate are highest in the village of mewat districts that is nearly 42% which speaks about the stark reality of development gap between the two districts of the state.one interesting and noteworthy point here is the in the ward of Gurgaon there is nearly 15% people who are illiterate. Gurgaon is considered as growth centre and its two decades that has passed but the districts adjacent to it and which was part of it earlier seems lagging behind and not experiencing the fruits of growth. Though in case of India it is considered that there is an effect of the caste system on occupational choice. According to a group of scholars, caste not only prescribes for each person a hereditary occupation but also discourages his attempts to surmount the occupational barriers existing for his group. Though absolute immobility in occupational status horizontally or vertically is a practical impossibility in any society.as there is always a scope for choosing the occupation as per the skill set. Every society has both the element of rigidity and flexibility in their own way and context, no society is fully closed open. Further social institutions affect the occupational choices but it is also a function of economic processes. Here if we look into the national classification of occupations one digit level classification. Highly paid, professional and managerial job, occupied by population is high in ward 31 and as we move away from the urban towards rural its nil which speaks of their engagement in informal, agricultural and elementary occupations. Occupation classification of villages at one digit level also brings picture more clear regarding the development gap there is a clustring only at the elementry occuptions in all the villages.
Table 1. Occupational structure as per NCO
But within that the share of gabsanpur is highest it can be infer from this that village of mewat’s people has a low level of skill profile as compare to the villages of gurgaon.There are no people in gabansupur in the legislator and managerial jobs.However in case of gurgaon’s villages some people are there in the high order skill level jobs.
Worker ward
Work force is always an important human resource,developing country like india it is the demographic divident that if properly materlized can lead to economic development.if we see the work force participation rate from gurgaon towards
Figure 2. Work Force Participation Rate
mewat it shows a marked decrease which in turn reveals the stark reality of development gap between the districts.it is vivid from the graph that ward 31 has the highest wark participation rate that is 32%wher is its counterpart mewat’s ward has 28% which shows the gap.Gap in work force is not just a gap in work participation it is a manifestation of level of economy,and oppurtinites avilable to enrich the skill profile which is a function of economic development level.
Table 2. Workers by Age-Group
working Age group reflect on various facets of socio-economic dynamics. More than 90% working age people are in the age group of 15-59 this could be a great human resource, an asset or not tapped timely it could turn into liability. Population in the age group of 0-14 speaks of child labour prevalence even after a strong legislation.
Further if we looking into the sectorisation of workforce (see table 3.), the significance of the rural non-farm sector can hardly be denied when seen in relation with the increasing saturation in growth of agricultural employment and the growing rural-urban divide in a globalizing India. The generation of employment in the rural non-farm employment is important not only with respect to poverty alleviation, and rural development, but is also known to enhance sustainability of use of natural resources and food security in rural areas (Bhalla, 2002). By creation of in-situ jobs, it opens up opportunities for women in particular, as the patriarchal structure curtail their free mobility in rural India. Thus rural non-farm employment could be the vehicle for reduction of gender gaps in the rural India higher employment in the employment is also known to have a positive externality impact on urban areas by limiting rural to urban migration, which if unaddressed, could lead to unsustainable urban growth, on the one hand, and increased vulnerability of the migrating rural population on the other hand. (Kundu 2011).amongst policy-makers there is
considerable interest in understanding how the non-farm sector contributes to economic growth and what is its role in alleviating rural poverty. Can promotion of rural non-farm sector lead to reduction of migration from rural to urban could be an interesting hypothesis. Traditionally it is believed that rural household in India is engaged in agriculture, this paper reflects the varied nature of employment even in rural spatial units. Important point here is whether this declining share of agriculture in employment is due to positive forces in the economy or a reflection of adverse condition of agriculture sector. The working-age population of India is growing in size, the labour force is shifting away from agriculture and, with higher education, and workers are also seeking better-quality non-agricultural jobs. Construction has virtually become an area where major workforce is concentrated.it probably the in migration stream in search of work which is absorbed by real estate sector. Mining is another area where workforce is concentrated but interestingly the Aravali region where mining is actually practiced is nearest to the Behlpa and Fazalwas village but the worker probably reside in Gurgaon ward 31 and these worker are often migrated from other state. There is very low worker population in agriculture sector, there must be strong factors that have pushed workers out of agriculture, in recent years agriculture has become non-remunerative in many parts of the country. At the same time, there must be pull factors that caused workers to move away from agriculture. Important point here is the expansion of casual employment
2.2 Poverty, Deprivation and Vulnerability
Poverty is an extremely complex dynamic and perplexing question.it is manifested in a range of overlapping, interdependent, interwoven political, economic and social deprivations.it may be low income, hunger ,insecurity, social exclusion, poor health or it can be political powerlessness. These all dimensions has been capture by various criteria’s, approaches and ,methodologies this section is an attempt to explore poverty in some of the peri -urban villages of Gurgaon and mewat through the new criteria of socio economic caste census for rural spatial units and Hasim committee criteria for urban areas and tries to capture the trickle-down effect.
Note visit: www.secc.gov.in for complete info on criteria and methodology for poverty estimation.
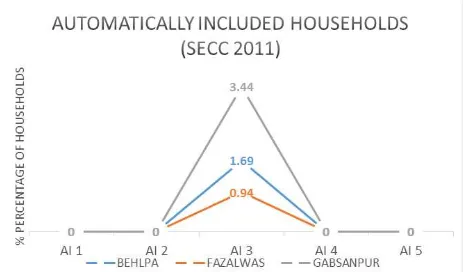
Figure 3. Automatically included (AI) household
Poverty is estimated as per the criteria of SECC 2011,and the results depicts that as we move away from the core the level of poverty increases therefore the notion of trickle-down seems quite mythical here.
Workers by Age-Group
Age Group
Ward 31
Ward 11
Behlpa Fazalwas Gabsanpur
0-14 0.53 4.57 1.75 2.69 8.51
15-59 93.81 86.85 91.84 89.69 87.23
60 + 5.66 8.57 6.41 7.62 4.25
Table 3. Industrial grouping of workforce
2.2.1 Deprivation
Further we look in to the level of deprivation the story gets repeated as per other variable. The level of deprivation has been calculated on the basis of assigning weights and then computing an index of deprivation and classifying it into categories.
Table 4. Categorisation of households
Reveals that abject deprivation is missing in the ward of mewat however there are as much as 30 household living in the abject deprivation. Even in the moderate deprivation there are no household in the ward 11 which is of mewat. This speaks of uneven development of Gurgaon. However the ward of mewat’s condition is also not very gloomy as there are nearly 75% household just above the abject deprivation and there are only 26 %household which are well above deprivation. This speaks that there is a huge range population living in Gurgaon’s ward from poorest to richest. However in terms of mewat’s ward it is concentrated around just above the deprivation. Though the condition of mewat’s ward does not seems good but the rosy of Gurgaon’s development doesn’t hold water the hyper euphoric claim of Gurgaon development seems hollow it seems Gurgaon has experiences uneven-development.
2.2.2 Social, occupational and residential Vulnerabilities
Use of the term “vulnerability” has proliferated in recent times, the term refers to the relationship between poverty, risk, and efforts to manage risk. Social Risk Management (SRM) is a new means of looking at poverty, risk, and risk management that has recently been presented in the World Bank’s Social Protection strategy. The SRM perspective addresses how vulnerable households can be helped to better manage risks and become less susceptible to welfare losses. There is a great inclination among scholars to look at poverty through vulnerabilities. Vulnerability as, ‘the insecurity of the well-being of individuals, households, or communities in the face of a changing environment’. They note that since people move in and out of poverty the concept of vulnerability better captures processes of change than static measures. The idea that poor are more vulnerable is an idea which is well accepted in the literature. Poverty and vulnerability are not synonymous, but are closely related many households that are now not poor are certainly vulnerable to falling into poverty. But vulnerability to poverty, using common economic definitions of poverty, is not the only form of vulnerability that exists. Many non poor are vulnerable to poverty and also
to other negative outcome
.
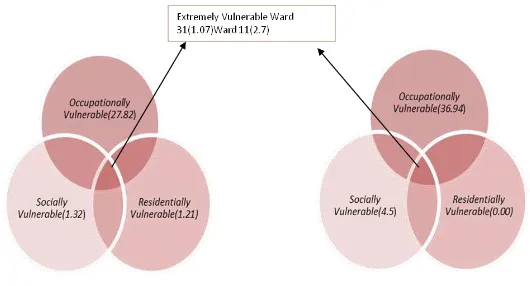
Here we are using the criteria of Hasim committee to define vulnerabilities and the indices suggested by him.
Note: vulnerabilities are assessed as per the Hasim committee criteria Figure 4.Spatially distinctive vulnerabilities
Level of development seems contrasting in Gurgaon and Mewat. Occupation which speaks of level of economic development and many other socio-economic processes revealing here that nearly 80 per cent people in ward 11 are occupationally vulnerable. In ward 11 workers are more in to casual and informal work, which make them insecure, fragile, prone and vulnerable to poverty traps. However Gurgaon is often projected as a developed districts but a nearly 45% household occupationally vulnerability makes the claim hollow. Since the real estate got a boom in the near past in Gurgaon more in migration of labourer in construction sector took placed. A high concentration of household in casual work and more occupational vulnerability even in Gurgaon may be attributed to these migrant construction which used to migrate to Delhi is probably absorbed by Gurgaon
INDUSTRY GROUP Ward 31
Behlpa Fazalwas Ward 11
Gabsanpur
Agriculture 3.80% 11.07% 8.82% 2.65% 2.17%
Mining 12.76% 0.00% 0.83% 1.99% 0.00%
Manufacturing 2.34% 0.00% 5.51% 1.32% 0.00%
Construction 38.05% 67.75% 54.82% 43.05% 82.61%
Trade 11.27% 9.77% 14.05% 41.06% 0.00%
Machine Operators And Assemblers
15.14% 0.00% 4.96% 0.00% 0.00%
Hotels And Restaurants 0.93% 0.98% 3.31% 0.66% 0.00%
Transport And Storage 7.05% 3.91% 4.68% 4.64% 0.00%
Defense 3.09% 2.61% 1.10% 2.65% 0.00%
Other Community, Social And Personal Services
0.38% 0.00% 0.00% 0.00% 0.00%
Personal Household Works
5.19% 3.91% 1.93% 1.99% 15.22%
CATEGORISATION WARD 31 WARD 11
Abject Deprivation (AD) 30
(0.41)
-
Moderate Deprivation (MD) 267
(3.7)
-
Just Above Deprivation (JAD) 2872 (39.6)
82 (73.9) Well Above Deprivation (WAD) 4084
(56.3)
29 (26.13)
TOTAL HOUSEHOLDS 7253
(100)
111 (100)
3. ECOLOGICAL LANDSCAPE OF THE PERI-URBAN GURGAON
Emerging economy of India and changing production of space has led to the breakdown of old social relation and the new relation are governed by the market forces. With the advent of modernisation and urbanisation, the cultural and ecological landscape are undergoing are rapid change, this section is an attempt to glance through that.
3.1 Urban growth, land use and development
Pattern of urban development is one among many ways of describing the spatial structure and relationship of fixed activities in an urban region. (Owens, 1986) noted that different aspects of spatial structures become important as we move across various scales. At metropolitan scale different aspects of spatial structure could be form, density, grain and connectivity. The third element grain, indicates the diversity of functional land use such as residential, commercial, industrial and institutional.
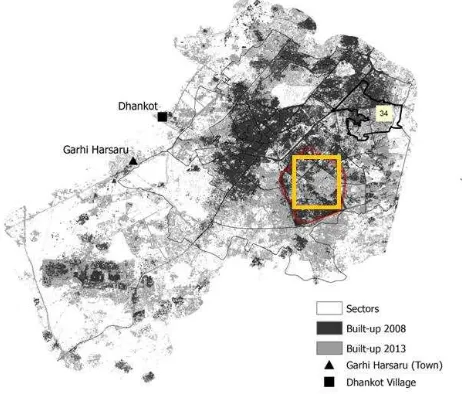
To look in to the ecological dimension of the changing economic space and land use changes in Gurgaon Millennium city, earth observation datasets of LISS IV, IRS-P6 of 5.8 m spatial resolution is examined for 2008 and 2013. The extracted built area, a proxy for settlements (urban) representing land use class as an outcome for demand from commercial, industrial, housing and infrastructure footprints. For extracting information at administrative unit, Gurgaon Municipal Corporation’s boundary is considered along with extra five kilometres of buffer to the GMC boundary ( refer Figure 5 ) . Reported land use change for built up for year 2010 to 2013 is of 89.7 km2 and thus in contrary reported loss of 81.1 km2 of agricultural land ( refer Table Number 5). This amounts to about 8.7% of total geographical area of GMC. Majority of land transformed from agriculture to built-up was brought through various land acquisitions from farmers of neighbouring villages.
In Sq.Km 2008 2013 Difference
Water 4.9194 4.048 0.87
Built-up Land
205.31(19.9%) 295.08 (28.6%) 89.7
Vegetation 204.83 201.10 -2.26
Crop land 505.58 (49%) 424.41 (41%) -81.1
Waste Land 13.22 11.51 -1.71
Fellow Land 97.63 95.35 -2.27
Total Area 1031.51 1031.52
Table 5. Land use analysis based on LISS-IV on board IRS-P6 of 2008 and 2013.
Roy and Alsayyad
,
2003 examined regarding informality in south Asia and explain the rapid peri-urbanisation that is unfolding at the edges of the world’s largest cities (same is the case of Gurgaon) is an in formalized process, often in violation of master plans and state norms but often informally sanctioned by the state. (Seto et al, 2012) conceptualizes the framework that explicitly links land changes to underlying urbanization dynamics. It also states that urbanisation and land change are two global processes with far reaching consequences. Although the two are tightly intertwined buttheir literature and analytical frameworks were largely developed separately. Authors arguein thesefields and specifically given the environmental impacts of urbanization on the land system, and associated social and political challenges.Land is brought for residential, commercial and industrial use through notification of master plans. Delhi Lease and Finance limited was the first company in 1985 to own a 3000 acres (12.14 km2) and started plotted development and therein no stopping for Gurgaon morphing into a chameleon and regarding metropolis ‘The 21st-century metropolis is a chameleon, it shifts shape and size; margins become centres; centres become frontiers; regions become cities’ in the process they have not destroyed space; they have simply rendered it infinite by the destruction of its Centre. In last six to seven years Department of Town and Country Planning (DTCP) has issued three notifications of three successive master plans for Gurgaon. State released first draft Master Plan 2021 on July 1, 2006 and finally notified on February 05, 2007 and reflected a shift from the draft plan with a land use change to facilitate the demand for housing demand. Within four years Master plan 2025 draft was released on October 4, 2010 and notified on May 24, 2011. Between MP 2021 and MP 2025, the state government converted few sectors of agricultural land to residential and commercial use. November 15, 2012 the Master Plan 2031 draft was released and was notified on September 04, 2012 after conversion of Special Economic Zone (SEZ) land into residential and commercial use.
(Debroy and Bhandari, 2009) explained that the land transformation practices are preferred in Gurgaon as location for investment after liberalization above Faridabad because of its proximity to Delhi airport, access to land for development and low land productivity. Initially infrastructure and investments were made to attract business and later Gurgaon became a millennium city, hosting about 250 fortune multinational companies. Now Gurgaon simply cannot be explained by its location or other given resources. Its existence as city and the sources of growth lie within itself, in the processes and growth system that go on within it. Maintaining the view that cities are not ordained; they are wholly existential
.
Figure 5. Gurgaon land use change 2008-2013 (yellow boundary depicts Municipal Ward Number 31)
Economic processes acting on a landscape, may be economic in pursuits but render transformative forces for the ecological landscape. Today’s world possess high integration and fast flow The International Archives of the Photogrammetry, Remote Sensing and Spatial Information Sciences, Volume XL-8, 2014
of information, goods and services. This integration possess a challenge to the ecological landscape, Gurgaon is one such example.
4. RESULTS AND DISCUSSION
Gurgaon and mewat are two distinctive socio-economic landscape present study ventured into their level of development and the study assumes that in the era of globalisation Gurgaon has experienced some growth and development. Whether this growth and development is percolating down or not was the perplex question that has been explored through the parameters of development. But the startling truth is projected by each and every index of the development. One the finding, as opposed to the laymen’s perception that Gurgaon has developed and transformed in to the world clad cities is that though it’s better than mewat but the kind of rosy picture projected and the growth story celebrated is a myth. Gurgaon has experienced an uneven-development and the condition of indicators of social development is not as good as perceived.in terms of occupational structure the national classification of occupation brings the fact that the remunerative, high paid and research and professional jobs are there in Gurgoan but missing towards Mewat. Further as we move from the core of Gurgaon towards mewat the non- farm informality increases which creates the risk of occupational vulnerability as informal sector does not offer protective benefits. A household level data analysis of socioeconomic caste census is done in the present study to assess the development gap among Gurgaon and its periphery. Deprivation index was constructed utilizing the dataset on the household income, basic amenities and assets possessed by the household. Deprivation index also reveals the deplorable condition of the denizens as we move away from the core. Apart from this the study tries to capture the trickle down of growth from Gurgaon to Mewat. And the study reveals that as we move from Gurgaon towards Mewat in a linear fashion across the selected villages and ward there is declining trend of level of economic development almost in all the parameters.
Towards mewat there is increase in poverty, increase in social and occupational vulnerability and illiteracy. Therefore there exist a contrast of development discourse in these two districts of Haryana. Mewat which was very much part of Gurgaon only possess different development story in all the indicators of development.it seems that agglomeration and centripetal forces has benefited Gurgaon but Mewat is lagging behind and there is no sign of spill over of growth and development towards Mewat as Mewat has performed poorly in all-encompassing indicator, be it deprivation level, poverty and occupational structure. Highly paid and professional jobs are good enough in Gurgaon but mewat brings stark reality of development gap and myth of notion of trickle down of growth.
REFERENCES
Alagh, Y. K., 1979. Report of the Task Force on Projections of
Minimum Needs and Effective Consumption Demand. Planning
Commission, New Delhi
Alkire, S. & Seth, S., 2013. Identifying BPL Households: A comparison of methods. Economic and Political Weekly, XLVIII (2), 49- 57.
Altheide, D. L., & Johnson, J. M., 1994. Criteria for assessing interpretive validity in qualitative research. In: Denzin and Y S Lincoln (eds) Handbook of Qualitative Research. Sage, CA, pp. 485-499.
Bajpai and Goyal 2004. Primary Education in India: Quality and coverage issues. CGSD Working Paper
Berger, P. L., & Luckmann, T., 1966. The Social construction
of Reality: A Treatise in the sociology of Knowledge. Penguin
Books, London.
Bhalla, G. S., & Singh, G., 2001. Indian Agriculture: Four
Decades of Development. Sage, New Delhi.
Buttimer, A., 1976. Grasping the Dynamism of Life world.
Annals of the Association of American Geographers, 66(2),
277- 292
Cohen, L., 2000. Research methods in Education. Sage, London.
Debroy, B., & Bhandhari, L., 2009. Gurgoan and Faridabad- An exercise in contrasts, on Democracy, Development and Rule
of Law (CDDRL). Freeman Spogli Institute fopr International
Studies, Stanford.
Denzin, N. K., & Lincoln, Y. S., 1994. Introduction: Entering the field of qualitative research. In: Denzin and Y S Lincoln (eds) Handbook of Qualitative Research. Sage, CA, 1- 17.
Dewey, J., 1916. Democracy and Education: An Introduction to
the Philosophy of Education. Macmillan: New York.
Dreze, J. & Sen, A. K.., 2002. India: Development and
Participation. Oxford University Press, New York.
Easterby, S., 1991. Management Research: An Introduction. Sage, London.
Feyerabend, P., 1975. Against Method. Verso, London
Flyvbjerg, B., 2001. Making Social Science Matters: Why
social enquiry fails and how it can succeed again. Cambridge
University, UK.
Friedman, T. L., 2005. The World is Flat: A brief history of the
Twenty First century. Farrar, Strauss and Giroux, New York
Garfinkel, H., 1967.: Studies in Ethnomethodology. Prentice Hall, New Jersey.
Giddens, A., 1984. The Constitution of Society: Outline of the
Theory of Structuration. University of California,. Berkeley.
Glaser, B., 1998. Doing Grounded Theory: Issues and
Discussion. Sociology Press, CA.
Goulet, D., 1971. The Cruel Choice: A New Concept in the
Theory of Development. Athenaeu, New York
Government of India, 2011. Socio Economic and Caste Census
2011 in Rural India. Ministry of Rural Development, New
Delhi http://rural.nic.in/sites/BPLcensus-2011
Hasim, S. R., 2012. Report of the Expert Group to Recommend the detailed methodology for Identification of Families living
below Poverty Line in the Urban Areas. Planning Commission,
Government of India, New DelhiS
Kindleberger, 1965. Economic Development. Mc Graw Hill, New York
Kundu, A., 2011. Trends and Processes of Urbanisation in India. Urbanization and Emerging Population Issues, 6. Owens, S., 1986. Energy, Planning and Urban Form. Peon, UK
Panagariya, A., 2008. India: The Emerging Giant. Oxford University, New York.