Pollution of surface waters with pesticides in Germany:
modeling non-point source inputs
A. Huber, M. Bach
∗, H.G. Frede
Department of Natural Resources Management, University of Giessen, Senckenbergstrasse 3, D-35390 Giessen, Germany
Received 7 May 1999; received in revised form 6 December 1999; accepted 12 January 2000
Abstract
Pesticide pollution of surface waters represents a considerable hazard for the aquatic environment. However, the mean amount of pesticides reaching the water resources varies considerably between regions and depends highly upon application rates, chemical characteristics of pesticides and natural conditions during application. In this study a model was developed which estimates loss of 42 active ingredients applied to 11 field crops, vineyards and orchards along each non-point source path of entry (subsurface drains, runoff and spray drift). A spatially and temporally differentiated data set of application rates and periods was compiled for each active ingredient and target culture to enable the modeling of pesticide transport. The model results are provided in digital raster format (100 m×100 m) within a geographic information system (GIS). The calculated pesticide loads in surface waters were compared with measured loads from different catchments in Germany. Both data sets agreed as to the order of magnitude, nevertheless due to the scale of the study the estimated loads cannot be interpreted as absolute values and only differences between active ingredients, regions and application periods should be assessed. © 2000 Elsevier Science B.V. All rights reserved.
Keywords:Pesticides; Surface water; GIS; Models; National scale; Non-point sources
1. Introduction
Pesticide contamination of surface water resources is a major water quality issue in western Europe. Nowadays there is not only a growing concern about hazardous effects on aquatic ecosystems but also about a possible degradation of an important source of drinking water. To reduce water pollution from agrichemicals it is important to know the mechanisms of pesticide transport and the extent of pesticide loss on a specific pathway. The latter was the subject
∗Corresponding author. Tel.:+49-641-99-37375;
fax:+49-641-99-37389.
E-mail address:[email protected] (M. Bach)
of detailed reviews like those of Wauchope (1978) and Burgoa and Wauchope (1995) on losses through surface runoff, or the report of Flury (1996) about experimental data on pesticide leaching and losses through tile drains. However, results obtained in plot studies may not always be applied to the situation in an entire catchment. In most cases the factors that fa-vor pesticide migration along different pathways such as tile drains, surface runoff or spray drift, are subject to spatial variability and thus the relative importance of a single path of entry to surface water varies within the catchment. To overcome this limitation several au-thors focused on pesticide migration to surface waters on the catchment scale (Frank et al., 1982; Wu et al., 1983; Squillace and Thurman, 1992; Ng and Glegg,
1997; Fenelon and Moore, 1998; Frede et al., 1998). Nevertheless it is evident that experimental findings cannot be easily extrapolated to unmonitored sites with different soils, climate or application practices.
In the past few years an increasing number of studies dealt with the creation of regional scale maps of pesti-cide migration risk, mostly leaching potential (Petach et al., 1991; Loague et al., 1996; Tiktak et al., 1996; Zhang et al., 1996; Diaz-Diaz et al., 1998; Soutter and Musy, 1998). Regional scale pesticide loss via surface runoff has been studied to a lesser extent than leach-ing, e.g. Mizgalewicz and Maidment (1996) estimate the atrazine transport in Iowa-Cedar River basin us-ing discharge concentrations regressions. At present, no reports about regional scale assessment of pesti-cide input via spray drift are known to the authors of this paper.
In this study an approach was developed to estimate regional importance of tile drains, surface runoff and spray drift to total non-point source pollution of sur-face waters with pesticides in Germany. Pesticide loss on each pathway was estimated separately for the en-tire country based on models which account for spatial variability of governing factors for pesticide transport to surface water. The study does not deal with risk as-sessments by basing model assumptions on the worst possible case of pollution but aims to depict the actual situation instead.
2. Materials and methods
2.1. Pesticide application data
A crucial parameter of any model applied in this study is the amount of active ingredient sprayed on a crop at a specific growth stage. Current geographic in-formation system (GIS) technology offers the oppor-tunity to provide regionally differentiated data sets on pesticide use and therefore enables the user to model non-point loss of an active ingredient under those soil, climatic and crop conditions under which it is really applied. To determine typical application periods in different regions, all available plant protection rec-ommendations published by the local branches of the agricultural extension services were evaluated with regard to recommended spraying times for the most important crops. Varying application periods due to
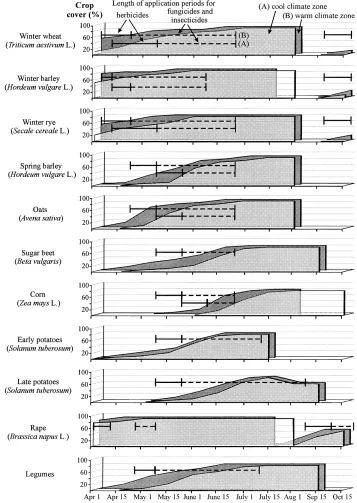
climatic differences were also considered with apple trees in blossom as an indicator for growth of crop cover and beginning of herbicide treatments in spring. Fig. 1 shows the development of crop cover in cool and warm climate zones as assumed in this study to-gether with the typical length of application period ac-cording to spraying recommendations. This temporal frame was then linked with the results of a representa-tive market survey among 3500 farmers on the use of active ingredients in German agriculture in 1993/1994 (Produkt and Markt, 1997).
CORINE-Land-Cover data (Statistisches Bunde-samt, 1997) and results of agricultural census at the community level (Statistische Landesaemter, 1992–1995) were taken to enhance the spatial reso-lution of the application pattern (Huber et al., 1998). Beside mean application rates in each federal state, application probability is an essential parameter to consider both the market position of an active in-gredient and the intensity of infestation. Hence, for the 42 active ingredients most sold in Germany 1994 their application probabilities to field crops, vineyards and orchards were calculated on 11 reference dates of treatment. The application probabilities are based on the relationship between the area treated with a pesticide in a determined period and the total area cropped with the target culture in each state.
2.2. Modeling pesticide leaching and loss via tile drains
2.2.1. Leaching model
Pesticide leaching is a complex and long-lasting process which requires the application of a mech-anistic simulation model to account for unsaturated water flow as well as for sorption, transformation and volatilization of the compound after application. Ev-ery model run requires detailed data about soil profile, weather conditions after application and the pesticide itself. In the scale of this study no such information
was available for every raster cell (100 m×100 m) used
in the modeling. Chemical transport with percolation water was therefore calculated for unique factor com-binations which were considered to be representative for German agriculture.
istics, factor combinations of chemical properties of active ingredients, application days, target crops (grain, row crops), soils (sand, organic carbon
con-tent OC=10 g kg−1; sandy loam, OC=7 g kg−1;
loam, OC=14 g kg−1; sandy loam, OC=24 g kg−1;
silt loam, OC=14 g kg−1) and climate characteristics
(eight weather records with mean precipitation from 542 to 1181 mm and mean annual temperature from
6 to 10.4◦C). Each run started with an application of
1 kg ha−1 on one out of eleven application days and
applying a full year weather record with daily precip-itation and temperature data. Chemical leaching was then calculated until the concentration of the original active ingredient had fallen below an arbitrarily cho-sen limit of 0.01mg l−1at 0.8 m soil depth. At the end
of each run pesticide loads given as fraction of ap-plication rate leached below 0.8 m were summarized together with annual percolation volumes. A detailed description of the leaching model is given in Huber et al. (1999).
2.2.2. Linkage between simulation results and spatial information
To regionalize simulation results, regression func-tions were derived between PELMO-results and
in-put parameters of leaching scenarios (grain,r2=0.88*;
row crops,r2=0.87*). The set of input parameters
in-cluded spatially distributed data such as mean annual percolation rates, soil types and regional application periods. Pesticide properties, i.e., sorption coefficient and soil half-life, were assumed to be spatially con-stant. Application rates were corrected for treatment probabilities and real doses according to the plant pro-tection data base and crop cover (Fig. 1). No foliar washoff was considered in this study because pesticide degradation on plant surface is very fast and hence it was assumed that foliar washoff would not contribute to a considerable extent to total leaching loss. Pesti-cide mass leached below 0.8 m was then assumed to enter tile drains, and thus to be transported to the sur-face water system depending upon tile drain density in a specific raster cell.
While a fairly good data set on tile drain density is available for former East Germany (IGB, 1998) an extensive survey among local branches of agricultural extension service was conducted in the Western part of the country to compile a map of average tile drain density in agroecological zones. Agroecological zones
(Bundesamt fuer Naturschutz, 1997) were chosen as the area units because most of the relevant landscape parameters integrated within the concept of agroeco-logical zoning like occurrence of poorly drained soils, intensity of plant production, mean crop yields, land-scape morphology may also be seen as determining factors for tile drain density. It is important to note that occurrence of soils with certain hydrologic prop-erties alone does not allow for conclusions about tile drain densities as most of the arable land in Germany is owned by small farmers who are strongly influ-enced by economic factors when they decide whether to drain a field or not.
2.3. Modeling pesticide loss via surface runoff
Calculation of runoff losses include neither pesti-cide residues nor foliar washoff. For model simpli-fication it is assumed that pesticides on foliage are resistant against washoff (Wauchope and Leonhard, 1980; Willis and McDowell, 1987) and dissipate rapidly after application respectively (Burgoa and Wauchope, 1995). Unlike chemical transport with percolation water, pesticide loss with surface water is highly event-specific. Thus storm timing is the critical determinant of pesticide runoff losses. The time between application and a significant rainfall event is random in contrast to other parameters like application day, applied dose, and crop cover which are either known or assumed to be constant such as pesticide half-life. That means, the time between ap-plication and runoff event can only be described in a stochastic way. A frequently used probability dis-tribution for time between significant rainfalls is the Gumbel function (Gumbel, 1958).
Tv=exp(ve−u)/w (1)
whereTv is mean return period for a rainfall event
exceeding a given precipitation volume ve. The
German Meteorological Service (DWD, 1996)
provi-ded nationwide datasets with parametersu andwfor
various rainstorm durations in a 10 km×10 km grid.
In this studyuandwhave been fitted for 24 h events.
Based on the average length of time between sig-nificant rainfalls (Fig. 2), Mills and Leonard (1984) developed a probability density function for the
Fig. 2. Probability density function for time between significant rainfalls for tree different locations in Germany (data source: DWD, 1996).
time when runoff begins. The area under the function represents probabilities of occurrence. Integration and
solution for mean probability (p=0.5) yield
c=0.5β/αc0 (2)
wherec0is the initial amount of pesticide that is
sus-ceptible to runoff, i.e. is applied to soil surface, α
the reciprocal ofTvandβ the breakdown coefficient
which depends upon pesticide half-life Dt50.
β = ln 2
Dt50
(3)
Table 1
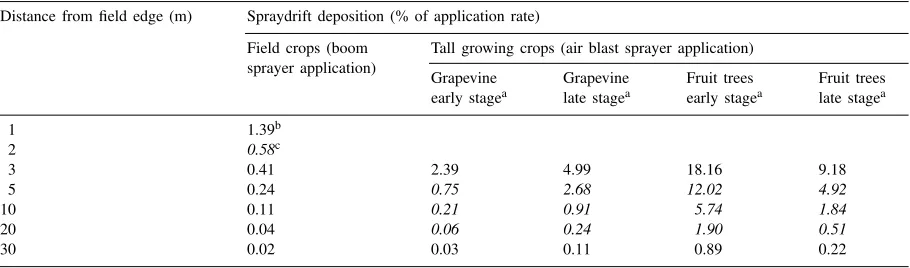
Basic drift values used for risk assessment in German pesticide registration procedures (Ganzelmeier et al., 1995) Distance from field edge (m) Spraydrift deposition (% of application rate)
Field crops (boom Tall growing crops (air blast sprayer application) sprayer application)
Grapevine Grapevine Fruit trees Fruit trees early stagea late stagea early stagea late stagea
1 1.39b
2 0.58c
3 0.41 2.39 4.99 18.16 9.18
5 0.24 0.75 2.68 12.02 4.92
10 0.11 0.21 0.91 5.74 1.84
20 0.04 0.06 0.24 1.90 0.51
30 0.02 0.03 0.11 0.89 0.22
aEarly/late stage: growth stage till/after blossom time.
bApplication with a dosage of 1 kg ha−1to a field crop results in a mean spraydrift deposition of 1.39% (≈1.4 mg m−2) on the surface of an adjacent water body with 1 m distance from edge of field
cValues indicated in italics were used in this study.
Chemical transfer to surface runoff was estimated following the approach of GLEAMS (Leonard et al., 1987), where a functional relationship between
dis-tribution coefficient Kd and an empirical extraction
coefficient was developed. Computation of runoff volume was based on the SCS-curve number method (McCuen, 1981) which was modified for Central European conditions by Lutz (1984). A detailed de-scription of the derivation of the runoff model is given in Huber et al. (1998).
2.4. Modeling pesticide loss to surface waters via spray drift
The extent to which active ingredients are deposited beyond the boundaries of the treated fields depends upon spraying equipment, meteorological conditions and growth stage of the crop. Basic drift tables have been developed in Germany (Table 1; Ganzelmeier et al., 1995) facilitating estimates of spray drift losses for boom sprayer applications to field crops and for air blast applications to vineyards and orchards (aircraft application is not relevant in Germany) at different leaf stages and for various distances between the edge of field and the deposition area. The drift values are
based on field trials at 25◦C, and a maximum wind
speed of 5 m s−1.
would only be dependent upon application rates. How-ever, the probability of occurrence of watercourses at field edge is the decisive factor with regard to the re-gional importance of spray drift as a pathway for pes-ticide input into surface water. In general frequency of surface waters per unit area can be described by
drainage density in km km−2(Horton, 1932). In this
study drainage density was first computed on the ba-sis of the digital surface water net (1:200.000; HAD, 1997) using GIS techniques. Due to cartographic gen-eralization the digital surface water net is represented incompletely, therefore real values were extrapolated by regression analysis taking measured drainage den-sities in 147 different agroecological zones (Huber, 1998).
2.5. Other non-point sources of surface water contamination with pesticides
Some non-point sources were not modeled because they are not considered to be relevant on a national scale such as atmospheric deposition or wind erosion. For the following two reasons sediment-bound pesti-cide loss was also neglected:
1. The spatial databases required for erosion calcula-tion are not available for Germany, so modeling of pesticide input is limited to the dissolved phase. 2. With Germany’s prevailing weather, soil and land
use conditions, surface runoff occurs frequently causing no or hardly any soil erosion, e.g. 5 to 15 times per year according to model calculations. Heavy rainstorms including higher erosion only oc-cur once or twice per year, mainly effecting row crops. In this respect the situation differs signifi-cantly from the ones in other countries, especially in North America. Thus pesticide transport in so-lute phase is assumed to be the dominant runoff component.
Burgoa and Wauchope (1995) also stated that sed-iment constitutes such a small fraction of runoff fol-lowing even highly erosive storms, that it is likely that the bulk of active ingredient will be lost in the water phase.
Some authors reported a notable pesticide flux from groundwater to surface water (Squillace and Thurman, 1992). However, concentrations in groundwater are generally very low (Leistra and Boesten, 1989). In this study it was therefore not assumed that pesticide
concentrations in surface water, which are usually higher than those in groundwater, are caused to a considerable extent by groundwater discharge.
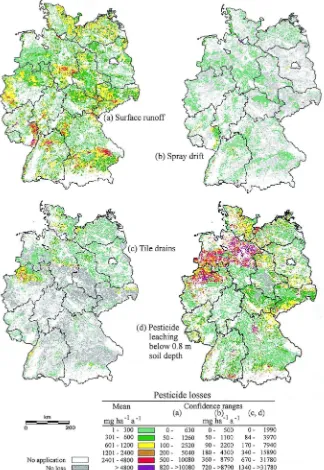
3. Results and discussion
Model results for pesticide loss via surface runoff, tile drains and spray drift are shown in Table 2 and Fig. 3a–c. To account for parameter uncertainty inher-ent to all regional scale models, computed loads were given with ranges of variation both in Table 2 and in generated maps (Fig. 4a–d). Magnitude of variation
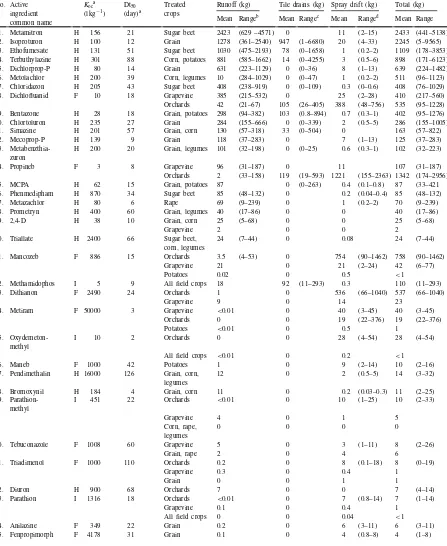
Table 2
Active ingredients considered in the study, their chemical properties and their predicted annual losses into surface waters via different pathways in Germany (cumulated over all treatments, reference year 1994)e
No. Active
Runoff (kg) Tile drains (kg) Spray drift (kg) Total (kg)
Mean Rangeb Mean Rangec Mean Ranged Mean Range
1. Metamitron H 156 21 Sugar beet 2423 (629 –4571) 0 11 (2–15) 2433 (441–5138) 2. Isoproturon H 100 12 Grain 1278 (361–2540) 947 (1–6680) 20 (4–33) 2245 (5–9565) 3. Ethofumesate H 131 51 Sugar beet 1030 (475–2193) 78 (0–1658) 1 (0.2–2) 1109 (178–3853) 4. Terbuthylazine H 301 88 Corn, potatoes 881 (585–1662) 14 (0–4255) 3 (0.5–6) 898 (171–6123) 5. Dichlorprop-P H 80 14 Grain 631 (223–1129) 0 (0–36) 8 (1–13) 639 (224–1482) 6. Metolachlor H 200 39 Corn, legumes 10 (284–1029) 0 (0–47) 1 (0.2–2) 511 (96–1123) 7. Chloridazon H 205 43 Sugar beet 408 (238–919) 0 (0–109) 0.3 (0–0.6) 408 (76–1029) 8. Dichlofluanid F 10 18 Grapevine 385 (215–532) 0 25 (2–28) 410 (217–560) Orchards 42 (21–67) 105 (26–405) 388 (48–756) 535 (95–1228) 9. Bentazone H 28 18 Grain, potatoes 298 (94–382) 103 (0.8–894) 0.7 (0.3–1) 402 (95–1276) 10. Chlortoluron H 235 27 Grain 284 (155–666) 0 (0–339) 2 (0.5–5) 286 (155–1005) 11. Simazine H 201 57 Grain, corn 130 (57–318) 33 (0–504) 0 163 (57–822) 12. Mecoprop-P H 139 9 Grain 118 (37–283) 0 7 (1–13) 125 (37–283) 13.
Metabenzthia-zuron
H 200 20 Grain, legumes 101 (32–198) 0 (0–25) 0.6 (0.3–1) 102 (32–223)
14. Propineb F 3 8 Grapevine 96 (31–187) 0 11 107 (31–187)
Orchards 2 (33–158) 119 (19–593) 1221 (155–2363) 1342 (174–2956) 15. MCPA H 62 15 Grain, potatoes 87 0 (0–263) 0.4 (0.1–0.8) 87 (33–421 16. Phenmedipham H 870 34 Sugar beet 85 (48–132) 0 0.2 (0.04–0.4) 85 (48–132)
17. Metazachlor H 80 6 Rape 69 (9–239) 0 1 (0.2–2) 70 (9–239)
18. Prometryn H 400 60 Grain, legumes 40 (17–86) 0 0 40 (17–86)
19. 2,4-D H 38 10 Grain, corn 25 (5–68) 0 0 25 (5–68)
Grapevine 2 0 0 2
20. Triallate H 2400 66 Sugar beet, corn, legumes
24 (7–44) 0 0.08 24 (7–44)
21. Mancozeb F 886 15 Orchards 3.5 (4–53) 0 754 (90–1462) 758 (90–1462)
Grapevine 21 0 21 (2–24) 42 (6–77)
Potatoes 0.02 0 0.5 <1
22. Methamidophos I 5 9 All field crops 18 92 (11–293) 0.3 110 (11–293) 23. Dithianon F 2490 24 Orchards 1 0 536 (66–1040) 537 (66–1040)
Grapevine 9 0 14 23
24. Metiram F 50000 3 Grapevine <0.01 0 40 (3–45) 40 (3–45)
Orchards 0 0 19 (22–376) 19 (22–376)
Potatoes <0.01 0 0.5 1
27. Pendimethalin H 16000 126 Grain, corn, legumes
12 0 2 (0.5–5) 14 (3–32)
28. Bromoxynil H 184 4 Grain, corn 11 0 0.2 (0.03–0.3) 11 (2–25) 29.
Parathion-30. Tebuconazole F 1008 60 Grapevine 5 0 3 (1–11) 8 (2–26)
Grain, rape 2 0 4 6
31. Triadimenol F 1000 110 Orchards 0.2 0 8 (0.1–18) 8 (0–19)
Grapevine 0.3 0 0.4 1
Grain 0 0 1 1
32. Diuron H 900 68 Orchards 7 0 0 7 (4–14)
33. Parathion I 1316 18 Orchards <0.01 0 7 (0.8–14) 7 (1–14)
Grapevine 0.1 0 0.4 1
All field crops 0 0 0.04 <1
34. Anilazine F 349 22 Grain 0.2 0 6 (3–11) 6 (3–11)
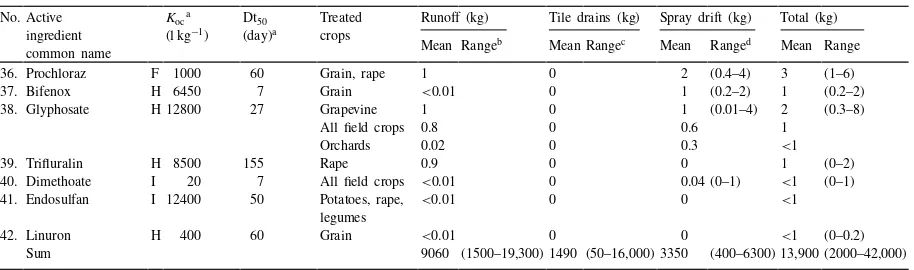
Table 2 (Continued)
Runoff (kg) Tile drains (kg) Spray drift (kg) Total (kg)
Mean Rangeb Mean Rangec Mean Ranged Mean Range
36. Prochloraz F 1000 60 Grain, rape 1 0 2 (0.4–4) 3 (1–6)
37. Bifenox H 6450 7 Grain <0.01 0 1 (0.2–2) 1 (0.2–2)
38. Glyphosate H 12800 27 Grapevine 1 0 1 (0.01–4) 2 (0.3–8)
All field crops 0.8 0 0.6 1
Orchards 0.02 0 0.3 <1
39. Trifluralin H 8500 155 Rape 0.9 0 0 1 (0–2)
40. Dimethoate I 20 7 All field crops <0.01 0 0.04 (0–1) <1 (0–1) 41. Endosulfan I 12400 50 Potatoes, rape,
legumes
<0.01 0 0 <1
42. Linuron H 400 60 Grain <0.01 0 0 <1 (0–0.2)
Sum 9060 (1500–19,300) 1490 (50–16,000) 3350 (400–6300) 13,900 (2000–42,000)
aValues extracted from the chemical properties data base at the German Federal Environmental Agency (unpublished).
bConfidence ranges (in parenthesis) of pesticide losses resulting with different values for sorption coefficient (K
OC,+100/−50%), disappearance time
(Dt50,+100/−50%) and curve number (CN-value+25/−25%).
cConfidence ranges (in parenthesis) with different values forK
OC, Dt50 and tile drain density (+100/−50%).
dConfidence ranges (in parenthesis) with various distances from surface water (field crops: 2, 5, 10 m; orchards, vineyards: 5, 10, 20 m).
eH=herbicide, F=fungicide, I=insecticide.
for pesticide loss is different for every single pathway and was based on the sensitivity analysis performed for each model (Huber, 1998; Huber et al., 1998).
3.1. Surface runoff
According to model results with a total amount of ca. 9000 kg a.i. surface runoff is the dominant non-point source pathway for pesticide input into sur-face waters. It becomes clear that chemical transport with surface runoff is a more frequent phenomenon than losses via tile drains or spray drift, particularly in regions with a high spraying intensity like in the loess areas of Central Germany, along the Lower Rhine
and the Danube river (Fig. 4a). Sugar beets (Beta
vulgarisL.) form an important part of crop rotation in those areas. Like other row crops sugar beets require thorough herbicide treatments in late spring to ensure crop development; in the same time the probability of significant rainfalls grows with increasing tempera-ture. That means a considerable amount of herbicides are available in a period of frequent rainstorms and low crop cover. The same applies for spring barley
(Hordeum vulgare L.) which is sown in April and
does not develop sufficient crop canopy before early summer (Fig. 1).
The highest annual dissipation rate (5 g ha−1) was
modeled for vineyards in the Mosel region and along the upper and middle Rhine. In contrast vineyards
where also fungicides are subject to runoff transport, pesticide runoff in field crops consists nearly exclu-sively of herbicides. Cumulated losses after all calcu-lated treatments vary between 0.42% of application rate for ethofumesate to less than 0.01% for stronger bound or rapidly degradable active ingredients. In the case of isoproturon, the most frequently used her-bicide in German agriculture, calculated runoff loss was about 0.06% of the application rate.
Fig. 4. Spatial distribution of pesticide loss to surface waters on different pathways in Germany.
3.2. Leaching and transport through tile drains
For most parts of the country only neglectable amounts of pesticides are leached to 0.8 m
estimated mean loss of ca. 1500 kg a.i. into sur-face waters via tile drainage for the entire area of Germany exhibits therefore a high variation for some active ingredients (Fig. 3b), especially when sensitive parameter values like half-life (Dt50) or sorption
coef-ficient (KOC) are changed. In some cases no loss was
predicted using standard parameter values as given in Table 2; however, a certain loss resulted when considering parameter variation (Fig. 3b).
Predicted pesticide leaching rates are shown in Fig. 4d, discharge from tile drains in Fig. 4c. PELMO calculations gave high leaching rates in Northern Lowland areas where sandy soils prevail and Autumn applications to winter grain, particularly treatments with isoproturon, are more common than in other parts of the country. But only in a few regions a con-siderable leaching potential intersects with a high tile drain density. Thus, in most regions the surface water pollution is much lower than the pesticide leaching potential.
A considerable limitation of accuracy of predicted leaching loss must be attributed to spatial variability of organic carbon content of arable land which could not be considered adequately on the regional scale. To reduce the number of factor combinations to a man-ageable amount, PELMO-runs were conducted with five different soil scenarios ranging from a coarse sand to a silt loam, and mean organic carbon contents
in the upper soil layer from 7 to 24 g kg−1. Soil
sce-narios were selected according to representativity for cultivated soils, nevertheless it may be possible that the model predicted erroneous pesticide leaching rates due to a too coarse classification of soils in one of the defined soil scenarios. However, even without regroup-ing soil types, the modeler has to be aware of the fact that soil classified under the same taxonomic hierar-chy offers a great variation of soil properties (Loague et al., 1996).
Another limitation of the model is that PELMO does not account for preferential flow. This may constitute a considerable drawback when the model is applied to heavier soils (Klein, 1994; Thorsen et al., 1998). It is evident, that highly permeable and thus leaching susceptible soils are drained to a lower extent than heavier soils. However, it is possible that frequently drained soils in loess areas, which do not exhibit a high leaching poten-tial after PELMO runs (Fig. 4d) would be
classi-fied differently when considering solute transport in macropores.
3.3. Spray drift
Frede et al. (1998) stated in Europe that no field studies exist determining exclusively spraydrift in-put into surface water bodies under natural condi-tions. All monitoring studies on a catchment scale analysed a mixture of pesticide inputs from at least two or more diffuse sources, often superimposed by accidental inputs and spills. Experimental data on the fraction of total pesticide pollution of surface wa-ter originating from spray drift is restricted to worst case assessments undertaken for registration purposes (Ganzelmeier et al., 1995). Applying the median val-ues of basic spray drift losses (Table 1), real crop acreage, application rates and drainage density mod-eling results demonstrate that for applications in field crops, spray drift contribution to total surface water pollution is negligible at a total amount of 90 kg a.i. for Germany as a whole. Thus spray drift may con-tribute locally or temporarily to the contamination of aquatic systems but its contribution to the total annual pesticide river load is small on river basin or national scale.
This conclusion does not apply to orchards where air blast application leads to a substantially higher fraction of pesticide transported to the field edge than following boom sprayer application to field crops. Furthermore, the main apple tree growing area in Ger-many is located on marshland west of Hamburg where
drainage densities reach up to 100–200 km km−2.
Natural conditions and agricultural practices interact in a way that spray drift input amounts to ca. 3000 kg a.i. according to model estimate. This input pathway outweighs by far other non-point sources of pesticide pollution in this area. Moreover, this is the only path-way where fungicides contribute to a higher extent to water pollution than herbicides in Germany (Fig. 3c, Table 2).
3.4. Comparison of modeled loss to measured pesticide loads in different catchments
3.4.1. Problem of model validation
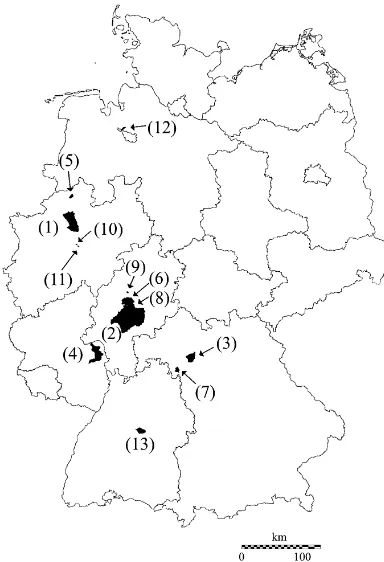
Table 3
Catchment studies used for the comparison of measured pesticide river loads with predicted pesticide losses (for geographic location of catchments see Fig. 5)
No. Catchment (no. of analysed pesticides)
Size (km2)
Sampling period
Sampling frequency
Isoproturon Sourceaof experi-mental data Measured
load (kg)
Modeled input (kg)
1. Stever (5) 585 1994 (entire year) 7 days 60.8 40.85 Gelsenwasser AG (1997) 2. Nidda (5) 1619 4/18/1994–5/25/1994 3 days 14.0 0.70 Seel et al. (1996)
3. Schwarzach (6) 170 4/17/1996–4/2/1997 30 days 3.286 0.48 Wasserwirtsch.amt Würzburg (1997) 4. Selz (14) 363 4/11/1995–9/20/1995 10 days 1.413 0.308 Pflanzenschutzd. Rheinl.-Pfalz (1997) 5. Frischofsbach (10) 32 12/28/1993–1/3/1995 7 days 1.173 2.935 Umweltamt Münster (1997) 6. Lumda (11) 129 4/24/1993–6/9/1993 24 h 0.55 0.08 Bach and Frede (1996)
7. Thierbach (6) 152 4/15/1996–11/7/1996 30 days 0.333 0.332 Wasserwirtsch.amt Würzburg (1997) 8. Wieseck (11) 80 4/24/1993–6/9/1993 24 h 0.068 0.119 Bach and Frede (1996)
9. Hess. Bach (5) 6 4/16/1994–5/18/1994 24 h 0.024b 0.118 Fischer (1996)
10. Gerrenbach (4) 6 1994 (entire year) 24 h 0.01 0.037 Skark and Zullei-Seibert (1997) 11. Lettebach (4) 5 1994 (entire year) 24 h 0.005 0.023 Skark and Zullei-Seibert (1997) 12. Blument. Aue (9) 34 4/20/1995–7/16/1995 48 h 0 0 City of Bremen (1997) 13. Körsch (6) 127 1/24/1996–11/27/1996 30 days No data No data Honnen et al. (1997)
aSources cf. Huber (1998).
bOnly pesticide load which originated from surface runoff, tile drains and spray drift.
because plots and even small catchments studied in a short period may not be representative for an entire region. In this way only long term catchment studies should be used to prove reliability of predicted losses. Additionally, experimental data should cover the main application periods and the most frequently applied active ingredients. At present, only data sets from 13 German catchments (Table 3, Fig. 5) fulfill these requirements.
A major limitation of regional scale modeling is that results can never be validated in a strict sense since measured loads also include a certain amount of pesticide which did not enter the surface water system via modeled pathways. Additional inputs could occur via point sources from accidents or spills from sprayer handling on farmyards. Spills were found to be an important source of surface water pollution (Frank et al., 1982). In some parts of Germany where a large number of farms is connected to public sewage plants, farmyard runoff outweighs even non-point source discharge (Bach, 1996; Fischer, 1996; Frede et al., 1998). Finally, the model developed in this study estimated pesticide loss to surface waters while ex-perimental data is load at catchment outlet. Between point of entry and sampling station transformation and sorption processes may occur, hence it is possible
Fig. 6. Comparison between modeled non-point source inputs and measured loads of isoproturon (for catchment characteristics see Table 3).
that measured loads do not truly reflect total pesticide input.
3.4.2. Modeled loss versus measured load
Comparison of loads of isoproturon is probably most reliable as it was measured in all catchments
Fig. 7. Comparison between modeled non-point source inputs and measured loads of five frequently analysed active ingredients in 13 German catchments (Table 3).
except one, for that reason respective loads are shown separately in Fig. 6. Values for other herbicides which were considered in at least five catchment studies are shown in Fig. 7. Considering the limitations of the performed comparison Figs. 6 and 7 nevertheless permit several conclusions:
1. In most cases model results seem to match the magnitude of pesticide pollution in surface waters; however, it is not possible to validate prediction ac-curacy for a single pathway because no study, ex-cept Fischer (1996), listed loads for each pathway separately.
2. Fig. 7 shows that the model underestimated loads in those catchments where measured pesticide
pollution exceeded about 100 g a−1. A possible
explanation is that the existence of point sources is more probable in larger catchments, while in small catchments point sources are often excluded by selection of monitoring sites.
4. Conclusions
Sustainable management of water resources needs improved informations about the occurrence and the relevance of pesticide input. The amount of pesticides reaching the surface waters varies considerably be-tween regions and is highly dependant upon site condi-tions, chemical characteristics of pesticide, application method and rates etc. Especially the relevance of the three pathways of entry runoff, tile drainage and spray drift differs considerably between a.i., crops, regions, and seasons. However, river monitoring programs to observe pesticide contamination are restricted to a lim-ited number of catchments. In this situation a spa-tially distributed model assessment of pesticide losses into water bodies contributes to problem analysis and environmental planning.
No regional-scale model is able to calculate the exact amount of pesticide loss to surface water be-cause transport processes are of a complex nature and actually can only be described in a simplified form. Moreover, contribution of point sources to total pes-ticide load is still unknown but has to be taken into account as a serious factor for surface water pollu-tion in the Southern and Western parts of Germany (Bach et al., 2000). However, it seems possible to differentiate among regions according to the relative importance of three relevant paths of pesticide mi-gration into the aquatic environment: surface runoff, tile drains and spray drift. Considering spatial distri-bution of governing factors for chemical loss from field crops for these pathways, the model predicted highest losses for runoff, followed by tile drains. Spray drift losses from applications to field crops is negligible to the annual river load. Spray drift is the dominant pathway only in orchards and is restricted to a small area in Germany which is a new feature in German debate. This outcome initialized an intensive observation program in the affected region.
The comparison of model results with measured pesticide river loads in continuously monitored catch-ments is indispensable for assessing model perfor-mance, even though the modeler should always be aware of limitations inherent in any validation pro-cedure for regional scale models. The discussion of model results should focus on comparative aspects. Mainly the relative impact of a.i. regions, field crops or periods of application to the total losses is stressed
instead of the absolute amounts of calculated pesti-cide inputs. Model capability to reproduce the effects of changes in pesticide management practices to the quality of surface water, e.g. alternation of active ingredients or shift of application period, makes it a useful tool for the development of strategies to reduce pesticide water pollution.
Acknowledgements
This study was funded by the German Federal En-vironmental Agency, Berlin (Project No. 295 24 034).
References
Bach, M., 1996. Diffuse stoffeintraege in fliessgewaesser in Deutschland. Vom Wasser 87, 1–13.
Bach, M., Huber, A., Frede, H.G., Mohaupt, V., Zullei-Seibert, N., 2000. Schaetzung der Eintraege von Pflanzenschutzmitteln aus der Landwirtschaft in die Oberflaechengewaesser Deutschlands. UBA-Berichte 3/00, Umweltbundesamt (German Federal Environmental Agency), Berlin.
Bundesamt fuer Naturschutz (Federal Agency for Nature Conservation), 1997. Digital map of agroecological zones in Germany, Bonn.
Burgoa, B., Wauchope, R.D., 1995. Pesticides in runoff and surface waters. In: Roberts, T.R., Kearney, P.C. (Eds.), Environmental Behaviour of Agrochemicals. Wiley, New York, pp. 221–255. Diaz-Diaz, R., Garcia-Hernandez, J.E., Loague, K., 1998. Leaching
potentials of four pesticides used for bananas in the Canary Islands. J. Environ. Qual. 27, 562–572.
DWD, 1996. Parameters (u) and (w) of Gumbel Distribution in a 10×10 km2 grid for the Federal Republik of Germany. Deutscher Wetterdienst (German Meteorological Service), Offenbach.
Fenelon, J.M., Moore, R.C., 1998. Transport of agrichemicals to ground and surface water in a Small Indiana watershed. J. Environ. Qual. 27, 884–894.
Fischer, P., 1996. Quantifizierung der Eintragspfade fuer Pflanzenschutzmittel in Fliessgewaesser. Ph.D. Thesis, University of Giessen.
Flury, M., 1996. Experimental evidence of transport of pesticides through field soils — a review. J. Environ. Qual. 25, 25–45. Frank, R., Braun, H.E., Van Hove Holdrinet, M., Sirons, G.J.,
Ripley, B.D., 1982. Agriculture and water quality in the Canadian Great Lakes Basin. V. Pesticide use in 11 agricultural watersheds and presence in stream water, 1975–1977. J. Environ. Qual. 11 (3), 497–505.
Ganzelmeier, H., Rautmann, D., Spangenberg, R., Streloke, M., Herrmann, M., Wenzelburger, H.J., Walter, H.F., 1995. Studies on the spray drift of plant protection products — results of a test program carried out throughout the Federal Republic of Germany. Mitteilungen aus der Biologischen Bundesanstalt fuer Land- und Forstwirtschaft 305, Braunschweig.
Gumbel, E.J., 1958. Statistics of the Extremes. Columbia University Press, New York.
HAD, 1997. Digital surface water net. In: Hydrologischer Atlas von Deutschland. Federal Environment Agency/Federal Ministry for the Environment, Nature Conservation and Nuclear Safety, Bonn, Berlin.
Horton, R.E., 1932. Drainage-basin characteristics. Trans. Am. Geophys. Union 13, 350–361.
Huber, A., 1998. Belastung der Oberflaechengewaesser mit Pflanzenschutzmitteln in Deutschland — Modellierung der diffusen Eintraege. Ph.D. thesis, University of Giessen. Huber, A., Bach, M., Frede, H.G., 1998. Modeling pesticide
losses with surface runoff in Germany. Sci. Total Environ. 223, 177–191.
Huber, A., Bach, M., Frede H.G., 1999. Modelling pesticide leaching and losses via tile drains in field crops in Germany. Pesticide Sci., in press.
IGB, 1998. Nutrient Budgeting for the River Basins in Germany. Final Report, German Environmental Agency project no. 10204515. Institut fuer Binnenfischerei und Gewaesseroekologie (IGB), Berlin.
Klein, M., 1994. Evaluation and comparison of pesticide leaching models for registration purposes, results of simulations performed with the pesticide leaching model. J. Environ. Sci. Health 29 (6), 1197–1209.
Klein, M., 1995. PELMO — Pesticide Leaching Model, Version 2.01 Users manual. Fraunhofer Institut fuer Umweltchemie und Oekotoxikologie, Schmallenberg.
Leistra, M., Boesten, J.J.T.I., 1989. Pesticide contamination of groundwater in western Europe. Agric. Ecosys. Environ. 26, 369–389.
Leonard, R.A., Knisel, W.G., Still, D.A., 1987. GLEAMS: groundwater loading effects of agricultural management systems. Trans. ASAE 30 (5), 1403–1418.
Loague, K., Bernknopf, R.L., Green, R.E., Giambelluca, T.W., 1996. Uncertainty of groundwater vulnerability assessments for agricultural regions in Hawaii: review. J. Environ. Qual. 25, 475–490.
Lutz, W., 1984. Berechnung von Hochwasserabfluessen unter Verwendung von Gebietskenngroessen. Ph.D. thesis, University of Karlsruhe.
McCuen, R.H., 1981. A Guide to Hydrologic Analysis Using SCS Methods. Prentice Hall, Englewood Cliffs.
Mills, W.C., Leonard, R.A., 1984. Pesticide pollution probabilities. Trans. ASAE 27, 1704–1710.
Mizgalewicz, P.J., Maidment, D.R., 1996. Modeling Agrichemical Transport in Midwest Rivers Using Geographic Information Systems. CRWR-Online Report 96–6. Center for Research in Water resources. University of Texas, Austin. http://www.crwr. utexas.edu/crwr/reports/rpt96 6/disstab.htm
Ng, H.Y.F., Glegg, S.B., 1997. Atrazine and metolachlor losses in runoff events from a agricultural watershed: the importance of runoff components. Sci. Total Environ. 193, 215–228. Petach, M.C., Wagenet, R.J., DeGloria, S.D., 1991. Regional water
flow and pesticide leaching using simulations with spatially distributed data. Geoderma 48, 245–269.
Produkt and Markt, 1997. Database Agricultural Panel. Results of a market survey among 3500 farmers in Germany 1994. Produkt und Markt, Wallenhorst, unpublished.
Soutter, M., Musy, A., 1998. Coupling 1D Monte-Carlo simulations and geostatistics to assess groundwater vulnerability to pesticide contamination on a regional scale. J. Contam. Hydrol. 32, 25–39.
Squillace, P.J., Thurman, E.M., 1992. Herbicide transport in rivers: importance of hydrology and geochemistry in nonpoint-source contamination. Environ. Sci. Technol. 26 (3), 538–545. Statistische Landesaemter (Statistical Offices of the Federal States),
1992–1995. Results of the Agricultural Census on Community Level Acreage of 11 Field Crops.
Statistisches Bundesamt (Federal Statistical Office), 1997. CORINE Land-Cover data set for Germany. Wiesbaden. Thorsen, M., Jørgensen, P.R., Felding, G., Jacobson, O.H., Spliid,
N.H., Refsgaard, J.C., 1998. Evaluation of a stepwise procedure for comparative validation of pesticide leaching models. J. Environ. Qual. 27, 1183–1193.
Tiktak, A., van der Linden, A.M.A., Leine, I., 1996. Application of GIS to the modeling of pesticide leaching on a regional scale in the Netherlands. In: Application of GIS to the Modeling of Non-Point Source Pollutants in the Vadose Zone. SSSA Special Publication 48. Soil Science Society of America, Madison, pp. 259–281.
Wauchope, R.D., 1978. The pesticide content of surface water draining from agricultural fields — a review. J. Environ. Qual. 7 (4), 459–472.
Wauchope, R.D., Leonhard, R.A., 1980. Maximum pesticide concentration in agricultural runoff: a semiempirical prediction formula. J. Environ. Qual. 9 (4), 665–672.
Willis, G.H., McDowell, L.L., 1987. Pesticide persistence on foliage. Rev. Environ. Contam. Toxicol. 100, 23–71. Wu, T.L., Correll, D.L., Remenapp, H.E.H., 1983. Herbicide runoff
from experimental watersheds. J. Environ. Qual. 12 (3), 330– 336.