TRUE-ORTHOPHOTO GENERATION FROM UAV IMAGES: IMPLEMENTATION OF
A COMBINED PHOTOGRAMMETRIC AND COMPUTER VISION APPROACH
L. Barazzetti a, *, R. Brumana a, D. Oreni a, M. Previtali a, F. Roncoroni b
a Politecnico di Milano, Department of Architecture, Built Environment and Construction Engineering (ABC)
Via Ponzio 31, 20133 Milano, Italy
(luigi.barazzetti, raffaella.brumana, daniela.oreni, mattia.previtali)@polimi.it b Politecnico di Milano, Polo Territoriale di Lecco, Via Previati 1/c, 23900 Lecco, Italy
fabio.roncoroni@polimi
Commission V
KEY WORDS: Automation,Matching, True-Orthophoto, UAV
ABSTRACT:
This paper presents a photogrammetric methodology for true-orthophoto generation with images acquired from UAV platforms. The method is an automated multistep workflow made up of three main parts: (i) image orientation through feature-based matching and collinearity equations / bundle block adjustment, (ii) dense matching with correlation techniques able to manage multiple images, and true-orthophoto mapping for 3D model texturing. It allows automated data processing of sparse blocks of convergent images in order to obtain a final true-orthophoto where problems such as self-occlusions, ghost effects, and multiple texture assignments are taken into consideration.
The different algorithms are illustrated and discussed along with a real case study concerning the UAV flight over the Basilica di Santa Maria di Collemaggio in L’Aquila (Italy). The final result is a rigorous true-orthophoto used to inspect the roof of the Basilica, which was seriously damaged by the earthquake in 2009.
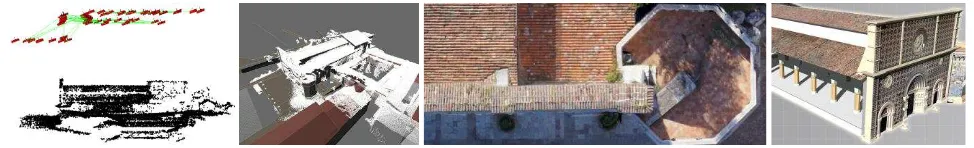
Fig. 1. Some phases of the true-orthorectification process with the UAV images acquired over the Basilica di Santa Maria di Collemaggio. From left to right: image orientation, dense model generation, true-orthophoto mapping and 3D reprojection on a BIM.
1. INTRODUCTION
Orthophotos are common products of photogrammetric applications. They are useful for both expert operators and beginners because they combine geometry and photorealism in order to provide a metric visualization of the area.
Aerial orthophotos, i.e. those generated from expensive airborne sensors, can be created following the standard photogrammetric pipeline that comprehends (i) image orientation, (ii) re-projection with a digital terrain model, and (iii) image mosaicking. Image orientation is carried out starting from a set of ground control points and tie points and a mathematic formulation based on collinearity equations (bundle block adjustment). Digital terrain models (DTMs) can already be available or they can be generated from images (with dense image matching techniques) or from LiDAR data.
Although aerial orthophotos do not provide 3D information they can be generated following the described production chain, that
can be assumed as a “proven technique” for most aerial surveys.
In addition, the great success of web services (e.g. Google Earth
– Google Maps, Bing Maps, etc.) increased the demand of
* Corresponding author.
orthophotos (and the success of photogrammetric applications) leading to the development of new algorithms and sensors. It is well-known that the orthophoto quality depends on image resolution, accuracy of camera calibration and orientation, and DTM accuracy (Kraus, 2007). As digital cameras produce high resolution images (centimeter level) one of the most important consequence in orthophoto production concerns the spatial resolution of the DTM: standing objects (e.g. buildings, vegetation, etc.) have a radial displacement in the final orthophoto.
The spatial error of orthophotos becomes more significant in the case of images gathered with UAV platforms. This is mainly due to their better geometric resolution and the details visible with flights at lower altitudes (Eisenbeiss, 2008; 2009). Here, breaklines and discontinuities becomes more important and influence the quality of the final orthophoto.
A possible solution (for the case of aerial images) was proposed by Amhar et al. (1998). The product was defined “true -orthophoto” and can be generated by using a digital surface model (DSM). From a theoretical point of view, the generation of a true-orthophoto does not significantly differ from that of ISPRS Annals of the Photogrammetry, Remote Sensing and Spatial Information Sciences, Volume II-5, 2014
classical orthophotos. On the other hand, a true-orthophoto leads to additional issues, among which the importance of occlusions. Indeed, true-orthophotos can consider the different standing objects and must be able to manage their multiple self-occlusions in order to avoid ghost effects. A solution is the combined used of images captured from different points of view (Rau et al., 2002, Biasion et al., 2004) so that areas occluded in some images can be filled by other views. Different implementations and research activities were carried out on this topic, obtaining different methods based on variable data sources (e.g. 3D City Models, spatial databases, Dense Digital Terrain Models – DDSMs, dense image matching from multiple aerial images, etc., see Brown, 2003; Dequal and Lingua, 2004; Schickler, 1998, Barazzetti et al., 2008; 2010a).
This paper illustrates a rigorous photogrammetric procedure able to produce a true-orthophoto from a set of unoriented images acquired with an UAV platform. It is based on the preliminary creation of a detailed model of the object with dense image matching techniques. The 3D model can be textured with the different images (a color correction and a self-occlusion algorithm is used). The last step is the projection of the 3D object on the reference plane for true-orthorectification. More theoretical details along with a real case study are given in the following sections.
2. ALGORITHM AND DATA OVERVIEW
The initial requirement to run the algorithm consists in a set of images (and their camera calibration parameters) and some ground control points (both image and ground coordinates) used to fix the datum and control network deformations.
The method is a sequence of in-house algorithms able to derive the orientation parameters of the images, create a 3D model of the object by means of a 3D mesh, reproject the different images according to specific constraints, and perform true-orthophoto mapping.
The case study presented is a survey in urban area (L’Aquila) and
is a part of a project of restoration of the Basilica di Santa Maria di Collemaggio. The 2009 L'Aquila earthquake caused serious damages to the Basilica (Fig. 2) and a restoration work is currently in progress.
Fig. 2. Some Google Earth images acquired in 2006, 2009 (after the earthquake), and 2011.
The photogrammetric survey of the basilica was carried out with the UAV platform AscTec Falcon 8. The system is equipped with a RGB camera Sony NEX-5N photogrammetrically calibrated.
The Falcon 8 (70 cm x 60 cm, weight 2 kg) has 8 motors and is able to fly up to 20 minutes with a single battery. The electronic equipment includes a GPS antenna and a system of accelerometers determining the system roll, pitch and yaw. The communication system allows the ground station to receive telemetry data and video signals from the on-board sensors. The average flying height over the Basilica was 60 m (Fig. 3), obtaining a pixel size (on the roof) of about 13.5 mm, i.e. more than sufficient to obtain a true-orthophoto with scale factor 1:100.
Fig. 3. The UAV fligh over the Basilica di Collemaggio.
The whole photogrammetric block is made up of 52 images acquired with the software AscTec AutoPilot Control. The software allows the operator to import a georeferenced image where waypoints can be added (manually or in an automated way by defining the overlap). The flight plan is then transferred to the Falcon that flies autonomously (the user has to take off and land). The global pipeline for photogrammetric image processing can be synthetically described as a multistep process made up of the following phases processed with the implemented packages:
image orientation → ATiPE; mesh generation → MGCM+; true-orthophoto mapping → ToMap.
They allow the user to automate the typical photogrammetric chain and provide rigorous photogrammetric reconstructions with the same level of automation of computer vision software. In addition, they give all the statistics to inspect the result and have dedicated modules to check global accuracy (e.g. the use of check points).
More details about the different steps and their implementation are reported in the following sections.
3. IMAGE ORIENTATION
Exterior orientation (EO) parameters are estimated with the ATiPE algorithm (Barazzetti et al., 2010b), that performs automated image matching and photogrammetric bundle block adjustment via collinearity equations.
The input elements of ATiPE are the images, the full set of interior orientation parameters, and a visibility map between the images (optional). All images are normally used with their calibration parameters in order to avoid self-calibration which is generally not appropriate and reliable in practical 3D modelling projects (Fraser, 1997; Remondino and Fraser, 2006; Cronk et al., 2006). The visibility map might contain information about the overlap between all images and can be derived (i) from GNSS/INS data with an approximate DTM/DSM or (ii) with a ISPRS Annals of the Photogrammetry, Remote Sensing and Spatial Information Sciences, Volume II-5, 2014
preliminary and quick orientation procedure performed on low resolution images.
Points are matched with the SIFT (Lowe, 2004) or SURF (Bay et al., 2008) operators along with the robust estimation of the fundamental matrix for outlier rejection (see Fig. 4).
Fig. 4. The flowchart of the image orientation phase.
The use of FBM techniques like SIFT and SURF for the detection of image points allows data processing of complex close-range blocks. A large variety of deformities, for instance scale variations, radiometric changes, convergent angles, and wide baselines, can be taken into consideration in order to obtain a good set of image points.
Normally, the image points detected in a fully automated way are more than sufficient to estimate of the EO parameters. However, two opposite situations could occur:
a great number of image points is the final results of the feature-based matching;
the image block is composed of tens of images, which must be progressively analyzed.
The former, which seems a good result, has a significant drawback: if too many points are used during the bundle adjustment, it is impossible to obtain a solution due to the high computational cost. This is the usual case of well-textured bodies
with images having the typical aerial configuration (e.g. the UAV block proposed in this paper). Here, the camera is translated and rotated around its optical axis during the acquisition of the images. SIFT and SURF are completely invariant to these effects and often provide too many points, more than those strictly necessary for a traditional manual orientation. These problems are also increased by the use of high resolution images, processed without any preliminary geometric image compression. To overcome this drawback an ad-hoc procedure for tie point decimation was implemented. After the matching of all image pair combinations, points can be reduced according to their multiplicity (i.e. the number of images in which the same point can be matched). A regular grid is projected onto each image, and for each cell only the point with the highest multiplicity is stored. Obviously, the same point must be kept for the other images. The second limit here listed is related to the number of images. For blocks made up of several tens of photos the CPU time can significantly increase. In fact, (n2-n)/2 image pair combinations must be analyzed for a block of n images, with a consequent processing time proportional to the global number of combinations.
However, only a limited number of pairs share tie points, therefore the remaining ones should be removed. The method used to discard these useless couples of images is a visibility map, which must be estimated at the beginning of data processing. As mentioned, the visibility map contains the connections between all image pairs sharing tie points, and can be estimated as follows:
visibility from images: if high-resolution images are employed, a preliminary processing is rapidly performed with compressed images (e.g., less than 2 Mpixel). This provides the image combinations of the whole block. Then, the same matching procedure is repeated with the original images but taking into account the produced map;
visibility from GNSS/INS data: these values combined with an approximate DSM of the area allow the estimation of the overlap between the images. This method is faster than the previous one. However, it can only be applied for images with a configuration similar to that of an aerial block. In some cases, the DSM can be approximated with a plane.
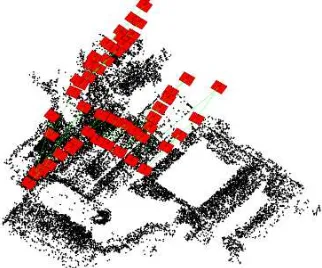
The orientation results for the image block acquired over the Basilica di Collemaggio are shown in Fig.5.
Fig. 5. Camera position / attitude and 3D points after the image orientation step.
The block is similar to a classical aerial one (although some convergent images were acquired) and has several strips with a total of 52 images, which produce 1,326 image combinations. For COMPRESSION & RGB2GRAY CONVERTION
CREATION OF “M” IMAGE PAIRS
Image pair i = 1
KEYPOINT DETECTION (SIFT/SURF)
KEYPOINT MATCHING (quadratic/kd-tree)
OUTLIER DETECTION
robust estimation fundamental (essential) matrix
IMAGE PAIR CONCATENATION i =
POINT REDUCTION
IMAGE COORDINATES False
True INPUT DATA
images –calibration parameters
VISIBILITY MAP CREATION
from images – from GPS/INS & DSM
BUNDLE ADJUSTMENT
each image pair, the SIFT keypoints were compared in less than 5 seconds with a kd-tree approach.
18 ground control points (targets and points on the roof measured by means of a total station) were included in the adjustment to fix the datum. Sigma-naught after Least Squares adjustment (collinearity equations are the mathematical model employed, Granshaw, 1980; Mikhail et al., 2001) is ±0.67 pixels, whereas the RMS of image coordinates was 0.67 pixels. The RMSE values on 5 check points were 5.3 mm (X), 6.1 mm (Y), and 11.2 mm (Z).
This first algorithm completes exterior orientation parameter estimation (along with 3D coordinates, i.e. a preliminary sparse reconstruction) used to run the dense matching phase.
4. MESH GENERATION
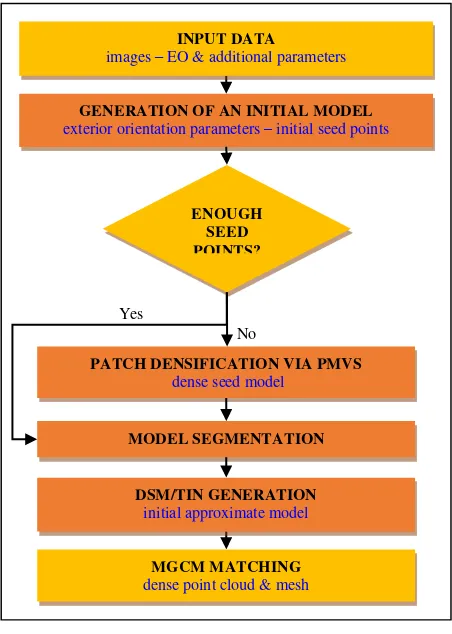
Images, exterior orientation and additional parameters allow one to run the implemented algorithm for mesh generation from multiple images (see Fig. 6 for the flowchart).
The algorithm, coined MGCM+, combines (i) LSM based on intensity observations (Gruen, 1985) with (ii) collinearity conditions used as geometrical constraints for the determination of all object point coordinates (Baltsavias, 1991; Gruen and Baltsavias, 1988). The use of the collinearity constraint and the opportunity to simultaneously match multiple scenes increase matching reliability. The adaptation here synthetically described deal with 3D blocks of convergent images (even 360° scenes).
Fig. 6. The flowchart of the dense matching phase.
An important requirement to run dense matching is an approximate model of the object. The importance of a good seed model is remarkable not only for the geometric quality of the final product, but also in terms of CPU time because it can limit the search along the 3D projective ray given by collinearity
equations. This results in a reduction of the number of trials during the translation of the correlation window.
An initial seed model can be derived from the 3D coordinates of tie points extracted during the matching and orientation steps. An alternative solution is instead the use of a package for multi-view stereo (Hiep et al., 2009; Hirschmueller, 2008) that does not need initial approximations. Both solutions are available in our MGCM+ implementation: the method runs the patch-based matching approach proposed by Furukawa and Ponce (2010). Their procedure was incorporated into a new matching pipeline in order to generate a low resolution initial model. This choice is motivated by the robustness of the method that combines multiple images during the dense matching step: if at least three images are processed simultaneously, blunders and spurious points can be removed by analyzing the local data redundancy. The MGCM+ algorithm assumes an affine deformation between the template and each slave. The relationship describing the intensity value of each pixel in the template is given by the discrete function f(x,y), and the n slaves are represented by functions g1(x,y), …, gn(x,y). An intensity observation equation for each pixel of the template and the corresponding pixel on the slave i is written as follows:
where the unknown quantities are corrections to the parameters of the affine transformation dajki. The coefficient gi0(x,y) is the observed value in the approximate position of the slave, while gxi and gyi are the partial derivatives of the function g(x,y). The function ei(x,y) gives the residual error with respect to the affine model.
The MGCM+ algorithm combines the intensity observation equations (1) with the collinearity condition. In fact, for a pinhole (central perspective) image k the constraint between the generic object point (Xp=[Xp Yp Zp]T) and its corresponding 2D point
where ckis the principal distance, X0k is the vector expressing the perspective center coordinates, Rk=[r1k r2k r3k]T is the rotation matrix. Image coordinates (xpk,ypk) are computed with respect to the principal point.
If both interior and exterior orientation (EO) parameters are known, the unknown parameters are shifts (Δxk, Δyk) and object point coordinates (Xp). After a preliminary linearization, observation equations become:
PATCH DENSIFICATION VIA PMVS
dense seed model
GENERATION OF AN INITIAL MODEL
exterior orientation parameters – initial seed points
ENOUGH
images – EO & additional parameters
DSM/TIN GENERATION
initial approximate model
MGCM MATCHING
dense point cloud & mesh
Shifts allow one to link both sets of eq.s 1 and 3, because
Δxpk=da10and Δypk=da20 for the same set of images and point P. Therefore, the resulting joint system can be solved using conventional Least Squares methods.
One of the most important aspects of MGCM+ is the opportunity to work with multiple convergent images. This means that an interactive selection of the master (and slaves) is carried out during data processing: the master changes with the different portions of the object. The initial seed model is split into several sub-regions from which a mobile master approach provide multiple point clouds in the same reference system (Fig. 7). The different sub-regions are then independently processed and the final point clouds are then merged (this solution is also good for parallel computing).
The automated choice of the master was implemented by considering different issues. First of all, a selection based on the information derived from the approximated model is accomplished. For a specified 3D point all images in which the point is visible are included with a simple back-projection. The selection of the master is then carried out inside this set.
Fig. 7. Densification of the seed model (left) and selection of the master image, i.e. image CS4 in this case (right).
The local normal direction is compared to all optical axes of images where the point is visible. The image whose normal is
closer to the surface normal direction is chosen as ‘master’. This strategy can easily handle objects that are not completely visible in a single image, without requiring intermediate user’s interaction.
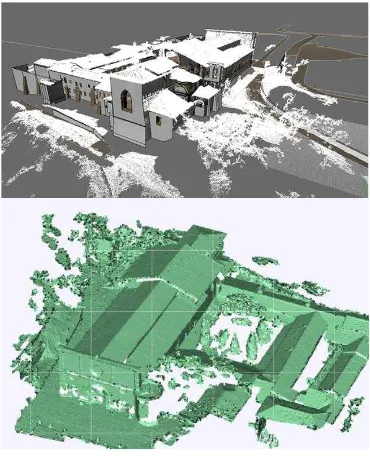
Fig. 8 shows the dense matching result for the Basilica. The point cloud (top) is interpolated to obtain a mesh (bottom), i.e. a continuous surface representation for texture mapping.
Fig. 8. The point cloud (top) and the final mesh (bottom).
5. TRUE-ORTHOPHOTO MAPPING
The last step of the proposed pipeline is carried out with the ToMap (True-orthophoto Mapping) package implemented by the authors. As described in the previous paragraph input data for this algorithm are the images along with their EO parameters and a detailed model (Fig. 9).
The implemented procedure for RGB texture-mapping can be split into two almost independent steps: a geometric and a radiometric part. The geometric part includes both visibility analysis and texture assignment. The radiometric adjustment concerns color/brightness correction.
Starting from an object modelled with a mesh the visibility analysis is carried out to detect occluded areas. If a triangle T0 is not visible from viewpoint Ij there is at least an occluding triangle Ti. The occlusion can be detected by an intersection between the two back-projected triangles in the image space. The problem relies on the identification of both occluded and occluding triangles with the reciprocal distance between the vertices of the triangles and the image projection center.
Fig. 9. The flowchart for true-orthophoto generation.
The visibility algorithm has a direct impact on CPU time because the check should be repeated for all the triangles of the mesh, leading to a complexity O2. A strategy able to reduce the number of triangles uses two different procedures: view frustum culling and back-facing culling.
The view frustum culling (Fig. 10) is based on the preliminary identification of the triangles outside the camera view frustum. An additional reduction of CPU time can be obtained with the back-facing culling, which exploits the normal vector of the different triangles and the optical axis of the oriented images.
Fig. 10. View frustum and back-facing culling principles (only the blue part of the box must be textured).
The second part of the texture-mapping algorithm concerns a color correction. First of all, the best image for a specific triangle must be determined. Two texture quality parameters are considered: the resolution of the image in object space and the camera viewing direction.
INPUT DATA
images – mesh – EO & additional parameters
VISIBILITY ANALYSIS
TEXTURE ASSIGNMENT
COLOR CORRECTION
TRUE-ORTHOPHOTO GENERATION
final GeoTIFF image
The image where quality parameters reach a maximum is used as main texture source. Texture coordinates are calculated by back-projecting the triangle coordinates from the object space to the selected image. As the algorithm separates the different triangles the brightness levels can be different and color differences can be found in the textured model.
The inhomogeneity of the texture can be reduced using the color/brightness correction. The radiometric correction is not performed in the traditional RGB space, but the L*a*b* color space is chosen. Indeed, the L*a*b* color space is designed to approximate human vision. In particular, the L component matches human perception of lightness, whereas a and b channels define the color plane. The color/brightness correction exploits the overlapping areas between two (or more) images. Homologous points are used to estimate the whole correction with an interpolation.
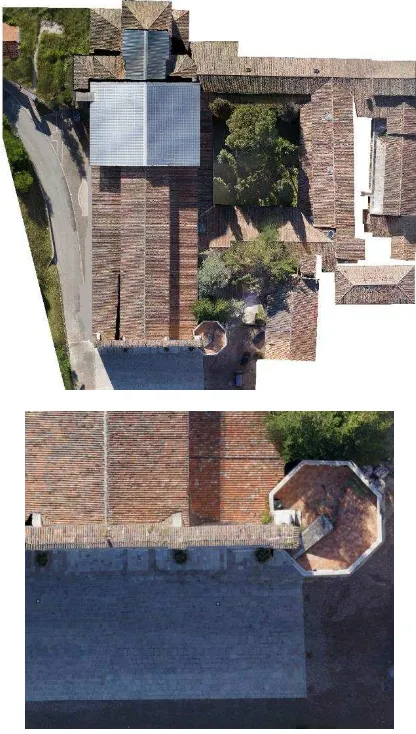
The result for the Basilica are shown in Fig. 11. Starting from the textured digital model of the true-orthophoto is obtained by projecting the model texture on the defined projection plane. In this case the orthographic projection was carried out in the XY plane defined by the local reference system (geodetic network).
Fig. 11. The final true-orthophoto from the UAV project.
The final GSD is 13.5 mm, i.e. more than sufficient to obtain a true-orthophoto with scale factor 1:100. As can be seen, the algorithm detected occluded areas that remains invisible. It avoids the ghost effect and creates black areas in the final true-orthophoto.
Finally, the GeoTIFF file format has georeferencing parameters that allow automated processing in BIM environments (Brumana
et al., 2013; Oreni et al., 2012; Murphy et al., 2013). Fig. 12 shows the result with the BIM generated from a combined photogrammetric (with close-range images) and laser scanning survey. This BIM is currently one of the most important tool of the restoration work.
Fig. 12. The BIM along with the projected true-orthoimage.
CONCLUSIONS AND OUTLOOKS
The paper presented a three step solution for the generation of true-orthophoto from a set of UAV images. The different steps are encapsulated into three in-house software packages that allow the operator to complete the typical photogrammetric pipeline for image processing: image orientation, surface reconstruction, and true-orthophoto generation.
The case study reported in this paper showed the potential of UAV information combined with rigorous algorithms for data processing. It should be mentioned that the UAV survey of the Basilica di Collemaggio was a powerful tool to inspect the current condition of the roof and complete the terrestrial reconstruction. The final true-orthophoto is one of the boards of
the project “Ripartire da Collemaggio”, financed by Eni (www.eni.com).
The method is not limited to UAV images, but it can handle blocks of terrestrial and aerial images that follow the central perspective camera model. As things stand at the present, data processing is carried out with RGB images. On the other hand, the UAV survey with the Falcon 8 is not limited to this kind of data: a sequence of thermal images (Fig. 13) was acquired with a FLIR camera. TIR information is currently under investigation in this project (Previtali et al., 2013). The use of a geometrically rectified true-orthophoto offers a support for the precise localization of TIR images. These images will take into consideration in future activities.
Fig. 13. Two thermal images acquired with the Falcon 8.
ACKNOWLEDGEMENTS
This work was supported by the project “Ripartire da Collemaggio” financed by Eni (www.eni.com).
REFERENCES
Amhar F., Jansa J., Ries C., 1998. The Generation of the True-Orthophotos Using a 3D Building Model in Conjunction With a Conventional DTM. International Archives of Photogrammetry, Remote Sensing and Spatial Information Sciences, Vol. 32(4), pp.16-22.
Bay, H., Ess, A., Tuytelaars, T. and van Gool, L., 2008. Speeded-up robust features (SURF). Computer Vision and Image Understanding, 110(3): 346-359.
Baltsavias, E.P, 1991. Multiphoto Geometrically Constrained Matching. Ph. D. thesis, Inst. of Geodesy and Photogrammetry, ETH Zurich, Switzerland, Mitteilungen No. 49, 221 pp.
Barazzetti, L., Brovelli, M., Scaioni, M., 2008. Generation of true-orthophotos with LiDAR dense digital surface models. The Photogrammetric Journal of Finland, Vol. 21, N.1, pp. 26-34
Barazzetti, L., Brovelli, M., Valentini, L., 2010a. LiDAR digital building models for true orthophoto generation. Applied Geomatics, Volume 2, Issue 4, pp. 187-196
Barazzetti, L., Remondino, F. and Scaioni, M., 2010b. Orientation and 3D modelling from markerless terrestrial images: combining accuracy with automation. Photogrammetric Record, 25(132), pp. 356-381.
Biason A., Dequal S., Lingua A., 2003. A New Procedure for the automatic production of true orthophotos. International Archives of Photogrammetry, Remote Sensing and Spatial Information Sciences, Vol. 35, pp.538-543.
Brown, J., 2003. Aspects on True-Orthophoto Production. Proc. of Phot. Week‘03, Fritsch, D., Hobbie, D. (ed.s), Wichmann, Stuttgart, Germany, pp.205-214.
Brumana, R., Oreni, D., Raimondi, A., Georgopoulos, A., Bregianni, A., 2013. From survey to HBIM for documentation, dissemination and management of built heritage. The case study
of St. Maria in Scaria d’Intelvi. 1st International Congress of Digital Heritage, pp. 497-504.
Cronk, S., Fraser, C., Hanley, H., 2006. Automatic metric calibration of colour digital cameras. Photogramm. Rec., 21(116): 355-372.
Dequal S., Lingua A., 2004. True orthophoto of the whole town of Turin. International Archives of Photogrammetry, Remote Sensing and Spatial Information Sciences, Vol. 34(5/C15), pp. 263-268.
Eisenbeiss, H., 2008. The autonomous mini helicopter: a powerful platform for mobile mapping. International Archives of Photogrammetry, Remote Sensing and Spatial Information Sciences, 37(B1): 977-983.
Eisenbeiss, H., 2009. UAV photogrammetry. Diss. ETH No.18515, Institute of Geodesy and Photogrammetry Zurich, Switzerland, Mitteilungen Nr.105, p. 235.
Furukawa, Y. and Ponce, J., 2010. Accurate, dense, and robust multi-view stereopsis. IEEE Trans. PAMI, 32(8): 1362-1376.
Fraser, C.S., 1997. Digital camera self-calibration. ISPRS Journal of Photogrammetry and Remote Sensing, 52: 149-159.
Granshaw, S.I., 1980. Bundle adjustment methods in engineering photogrammetry. Photogrammetric Record, 10(56): 181-207.
Gruen, A., 1985. Adaptative least squares correlation: a powerful image matching technique. South African Journal of Photogrammetry, Remote Sensing and Cartography, 14(3): 175-187.
Gruen, A. and Baltsavias, E.P. 1988. Geometrically Constrained Multiphoto Matching. PE&RS, 54(5), pp. 663-671.
Hiep, V., Keriven, R., Labatut, P., Pons J., 2009. Towards high-resolution large-scale multi-view stereo. In: Proc. of CVPR 2009, Kyoto, Giappone.
Hirschmueller H., 2008. Stereo processing by semi-global matching and mutual information. IEEE T, Pattern Anal., 30(2): 328-41.
Kraus, K., 2007. Photogrammetry: Geometry from Images and Laser Scans, Walter de Gruyter, 459 pages.
Lowe, D.G., 2004. Distinctive image features from scale-invariant keypoints. International Journal of Computer Vision, 60(2): 91-110.
Mikhail, E.M., Bethel, J.S., and J.C McGlone, 2001. Introduction to Modern Photogrammetry. John Wiley & Sons Inc., U.S.A.
Murphy, M., McGovern, E., Pavia, S., 2013. Historic Building Information Modelling: adding intelligence to laser and image based surveys. ISPRS Journal of Photogrammetry and Remote Sensing, n. 76, pp. 89-102.
Oreni, D., Cuca, B., Brumana, R., 2012. Three-dimensional virtual models for better comprehension of architectural heritage construction techniques and its maintenance over time. Lecture Notes in Computer Science (including subseries Lecture Notes in Artificial Intelligence and Lecture Notes in Bioinformatics) 7616 LNCS, pp. 533-542.
Previtali, M., Barazzetti, L., Brumana, R., Roncoroni, F., 2013. Thermographic analysis from uav platforms for energy efficiency retrofit applications. Journal of Mobile Multimedia, 9 (1-2), pp. 66-82.
Rau J.Y., Chen N.Y., Chen L.C, 2002. True Orthophoto Generation of Built-Up Areas Using Multi-View Images. PE&RS, 68(6), pp. 581-588.
Remondino, F. and Fraser, C., 2006. Digital camera calibration methods: considerations and comparisons. International Archives of Photogrammetry, Remote Sensing and Spatial Information Sciences, 36(5): 266-272.
Schickler W., 1998. Operational Procedure for Automatic True Orthophoto Generation. International Archives of Photogrammetry, Remote Sensing and Spatial Information Sciences, Vol. 32(4), pp.527-532.