PT DSN Tbk 2014 Operating Results Update
he DSN Group was originally established as a wood products manufacturer. We identiied an opportunity to expand into the plantation sector in 1997, building upon our established relationships within the local communities. Both of these business segments are showing growth, but the palm oil business is growing, and will continue to grow, at a higher rate.
Palm oil accounted for 64% of total revenue in 2013, up from 59% in 2012, and 73% of 9-month 2014 revenue driven by recently higher CPO average selling prices.
Our history of expansion has accelerated in recent years, with the acquisition of eight new oil palm estates since 2010.
We also took a controlling interest in Tanjung Kreasi Parquet Industry, a manufacturer of globally branded engineered looring in 2012. hese subsidiaries provide long-term
opportunities for expansion in both of our core businesses.
Crude Palm Oil
Palm Kernel
Palm Kernel Oil
Block Board
Engineered Doors
Engineered Floors
Re ve nue 9Mo ' 14 2013 2012 2011 2010
Palm O il 73% 64% 59% 55% 55%
0 10 20 30 40 50 60
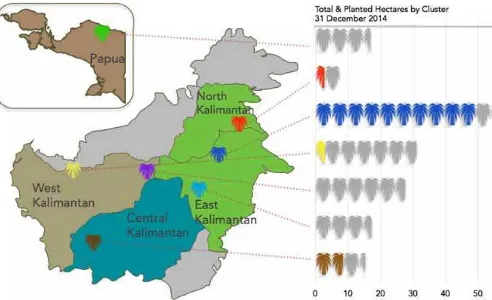
Our estates are clustered across East, West and Central
Kalimantan, with planting to date concentrated in the East
Pap ua
Total & Plante d He ctare s b y Cluste r 31 De ce mb e r 2014
Planted /Unplanted = 5,000ha
Our most developed cluster - with 5 estates, 5 CPO M ills and
56,000 ha - is nearly the size of Singapore
Our mill capacity is designed to accommodate annual peak output from the associated estates. As a result, mills servicing rapidly developing estates (such as Mill 5 in PWP) will appear to be underutilized, and may rely on signiicant external FFB purchases.
he proximity of the palm oil mills to the fruit allows us to establish an 8-hour standard for harvest-to-mill, resulting in minimal spoilage of FFB and lower FFA. Our redundant capacity also minimizes disruption due to maintenance.
he cluster approach allows us to achieve eiciencies in lower
transportation costs; centralization of logistics, such as housing, schools, clinics and security; and maximizing use of infrastructure (mills, roads, jetties and ports).
Tab le 2: CPO mill cap acity d e sig ne d for p e ak p rod uction months
In total, our nucleus estates incorporate 62,779 planted hectares, of which 48,038 are already mature. Our three oldest estates, SWA, DAN and DIN are fully comprised of mature trees, with limited additional area available for new planting.
78% of our planted area, in ive estates, is located in a single contiguous area in East Kalimantan. hese 48,930 planted hectares encompass an area nearly the size of Singapore.
Four out of our ive existing palm oil mills are located within these estates, and we expect to complete the construction of one additional palm oil mill in 2015.
108,286
ha
available
land bank
62,779 ha
planted
nucleus area
48,038
ha
mature
area
2 million
tons/ year
CPO mill
capacity
RSPO &
ISCC
certi
fi
ed
Tons/ Max.Ye ar Location Estate Hr Util* RSPO ISPO ISCC Mill 1 2002 E. Kal. SWA 90 55% Ce rt. Ce rt. Ce rt. Mill 2 2009 E. Kal. DAN 60 118% Ce rt. Ce rt. Ce rt. Mill 3 2010 E. Kal. DIN 60 130% Ce rt. Ce rt. Ce rt.
Mill 4 2011 E. Kal. SWA 60 126% Aud . Ce rt.
Mill 5 2011 C. Kal. PWP 60 103%
Mill 6 2015 E. Kal. DWT 60
Mill 7 2016 E. Kal. KPS 60
In Prog re ss Total Cap acity 450
*Monthly, 2014
Mill 6
Mill 7 Mill 3
Mill 1 Mill 4
Mill 2
Existing CPO M ills Planned CPO M ills
0 2 4 6 8
'17
'16
'15
'14
'13
'12
'11
'10
'09
'08
'07
'06
'05
'04
'03
'02
'01
'00
'99
'98
'97
'96
Our plantations have a young age pro
fi
le and will deliver
productivity growth in coming years
Planted / Planned = 500 ha
We added 4,916 hectares of nucleus in 2014, out of a total of 9,527 hectares planted during the year.
We intend to maintain the current pace of expansion through 2017, with roughly 10,000 hectares planted each year, including nucleus and plasma.
In total, our 62,778 hectares of planted nucleus were an average age of 7.1 years at the end of 2014. By 2016, our average age is expected to increase to 7.6 years.
DSN Nucle us Planting History (‘000 ha)
Mid -Ye ar vs. Ye ar-End Stand ard
In 2011, the Comp any ad op te d a Mid -Ye ar Stand ard (MYS) ap p roach to d e te rmining the ag e of our p lantations for accounting p urp ose s. Using the MYS, tre e s p lante d in H2 of the p re vious ye ar and H1 of the curre nt ye ar will b e consid e re d 1-ye ar old at the close of the ye ar – a re asonab le e stimate of the ave rag e amount of time the se tre e s have b e e n in the g round .
We have p re se nte d our p lanting history with an H1/H2 b re akd own, should you care to ap p ly Ye ar-End Stand ard ap p roach inste ad . All of the d ata p re se nte d within our financial re p orts and this p re se ntation make use of the MYS from 2011 to the p re se nt.
Our strong commitment to our plasma holders is one critical element in the success of DSN’s palm oil activities, generally fostering easier acquisition of land, facilitating title conversion, and minimizing the prospect of local disturbances or social unrest.
Our BoT model, encompassing 75% of our plasma areas, has resulted in higher FFB yields and, therefore, higher revenues for our plasma cooperatives. DSN still beneits from the milling margin and gains assurance that the loans to plasma holders can be repaid.
5% of total FFB revenues are retained by DSN as a
management fee. Of the remainder, 30% is paid to the plasma holder, while 70% services bank loans and funds extended by DSN for upkeep and maintenance of the estate prior to breaking even.
DSN typically funds the development of plasma estates through bank loans with repayment schedules comprising a 4-year grace period and 6-4-year repayment.
DSN Group Planting History
Our cost to maturity is roughly $5,000 per hectare, with an
additional $2,000 per hectare for mill construction
7.1 years
As our plantations age, we intend toimplement a planting schedule suicient to maintain a favorable long-term maturity proile. In general, our cost to maturity for new planting is roughly $5,000 to $5,500 per hectare.
Cap ital Exp e nd iture s 2013 2012 2011 2010
Immature Plantations 335 294 353 224
Construction in Prog re ss 182 482 282 128
O the rs 146 131 308 133
Total 663 907 942 485
We also plan to match the increased FFB production over time with appropriate increases in CPO processing capacity. A new mill is required for every 10,000 additional mature hectares. At a cost of roughly $18 - $20 million per mill, this adds another $1,800 to $2,000 to development costs per hectare.
Immature
Young Mature
Prime Mature
O ld Mature
Our planting schedule through 2016 implies an average
10% annual growth in FFB to 2 million tons in 2020
Assuming no p lanting afte r 2017
= 500 ha Ag e of Tre e s
FFB Yie ld (t/ha) Ag e Profile (‘000 ha)
Source : Ind one sian Palm O il Re se arch Institute
Class II
Class III
Class I
Class II
Class III
= DSN Annual Nucle us Yie ld A standard yield curve derived from our plantation age
proile, rather than simply our average age, helps to establish realistic medium-term yield expectations. hese standards suggest average yields could continue to increase through 2016, barring external environmental factors. At the same time, our mature plantation area will increase from 48,038 hectares in 2014 to 54,721 hectares in 2016 (25.4%), with subsequent annual growth rates of 10% or better through 2020, with over 82,000 mature hectares at that time.
0
Q uarte rly Total Nucle us FFB Prod uction
Immature
Young Mature
Prime Mature
0
Our target is to achieve lab standard FFB yields on a
commercial scale within each of our estates
Our performance is driven by a disciplined approach to standard agronomic practices, ranging from selecting the best seeds, to formulating multiple unique fertilizer blends, to the use of cover crops to retain soil and natural predators to control mice and caterpillars, thereby allowing us to minimize the use of harmful pesticides.
In 2014, DSN produced 1.26 million tons FFB from nucleus estates, with an additional 119 thousand tons from plasma operations. In aggregate, FFB output increased by 22% during the year, with a nucleus yield of 26.2 tons per hectare versus 26.4 tons in the preceding year.
3rd party purchases increased by nearly 90% during the
Ave rag e Ag e (mature ha only)
FFB Yie ld (t/ha, 2010-2014)
26.2 tons
year, as CPO Mill 5 was in operation for the full 12months. In aggregate, FFB processed grew by 18% to 1.64 million tons.
Prod uction Pe rformance - Estate s
Pe riod Volume %Δ Yie ld (t/ha)
FFB, Nucle us FY 2014 1,258 9 26.2
(' 000 t, t/ha) FY 2013 1,153 - 26.4
2012 977 32 25.5
2011 738 38 22.4
2010 536 - 19.8
FFB, Plasma FY 2014 119 35 18.7
(' 000 t, t/ha) FY 2013 88 - 17.5
2012 43 1,184 10.9 2011 3 - 4.4
2010 0 -
-Exte rnal FFB FY 2014 267 87
(' 000 t) FY 2013 143
-2012 65 64
2011 40 55
2010 26
-Total FFB FY 2014 1,635 18
-Prod uction Pe rformance - Mills
O ur 5 mills achieved an aggregate O ER of 23.9% last year,
resulting in a CPO yield of 6.3 tons per mature hectare
In total, CPO production increased by 16% in 2014, despite a slight decline in the Oil Extraction Rate (OER) to 23.9%.
Palm Kernel production rose 22% to 53,324 tons in 2014. Sales declined, however, to 10,127 tons as output was re-directed to our Palm Kernel Oil mill.
In its second year of operation, our PKO mill produced 18,197 tons, and supported sales of 19,704 tons of PKO.
Our CPO production quality remained exceptional over the course of 2014, with aggregate Free Fatty Acid (FFA) levels of just 2.93%. he maximum monthly FFA level from mills primarily processing our own production of just 3.85%.
Nearly 50% of our CPO production in 2014 was sold with FFA below 3%. his “Super CPO” can receive a premium of 1-4% to standard CPO.
Q uarte rly CPO Prod uction
22
Q uarte rly O il Extraction Rate
Sale s Pe rformance
CPO Q uarte rly ASP, 2010-2014
Expanding domestic re
fi
ning capacity, coupled with our
high-quality product, ensures robust demand for our CPO
Our customers are primarily Indonesia. We expect Astra’s new reinery on Sulawesi Island to become a customer in the near future as well.
Re fine rie s Our contracts are open tender, with SMART and Wilmar typically offering better pricing - due to reinery
location –and terms than other buyers.
Our cash cost of sales for CPO declined 11% in 2013,
partially offsetting the broadly lower ASPs
3.8
million rp/ t
in 2013
Cost of Sale s 2013 2012 2011 2010
CPO Sale s (' 000 t) 336.2 252.5 189.7 135.3
Fe rtilize r 288.7 326.7 193.7 161.1
Lab or 336.0 274.3 166.1 107.2
O the rs 244.7 224.3 227.4 210.8
FFB Purchase d 294.1 179.1 69.0 30.1
Milling 99.5 65.1 33.6 39.4
Total cash cost 1,263.0 1,069.5 689.7 548.6
Cash Cost/Ton 3.76 4.23 3.64 4.05
% of total 2013 2012 2011 2010
Fe rtilize r 22.9% 30.5% 28.1% 29.4%
Lab or 26.6% 25.6% 24.1% 19.5%
O the rs 19.4% 21.0% 33.0% 38.4%
FFB Purchase d 23.3% 16.7% 10.0% 5.5%
Milling 7.9% 6.1% 4.9% 7.2%
Cash Cost of Sale s (IDR b n) Our cash cost in 2013 declined to Rp3.76 million per ton of
CPO sold, a drop of 11.3% from 2012.
Absolute fertilizer costs fell by nearly 12%, despite an increase in planted and mature hectares, and account for roughly 23% of total cash costs.
We purchase compound fertilizer – comprised of potash, nitrogen, and phosphate – under annual contracts with four-monthly delivery. Our unit costs per ton ranged from $525 to $570 in 2013. New contracts covering our entire 2014 supply have already been concluded at prices between $320 and $425 per ton.
Purchases of external FFB – both plasma and unrelated estates - were up 64%. his was due to the rapid increase in plasma productivity with increasing maturity of the estates, as well as higher external purchases in support of Mill 5 operations.
Labor costs were up 22.5% for the year on the back of an expanded workforce as well as modest adjustments in wages.
DSN is also a leading wood products manufacturer with
reputable brand names & long-standing client relationships
4,000,000
m2/ annum
fl
ooring
capacity
450,000
m3/ annum
panel
capacity
DSN is the fourth largest wood products manufacturer in Indonesia,producing panels, engineered loors and doors.
We have initiated a move into higher value, higher margin products through the recent acquisition of TKPI, which specializes in engineered looring.
We continue to leverage on our long standing relationships with customers to across the world to leverage this new business initiative.
Our diverse exposure to customers in different segments and geographies has protected us to from adverse economic impacts as we maintain and grow our wood products business.
For wood products, we have suicient capacity to meet our current growth plans. We intend to more than double production volume in engineered looring from 1.1 million m2 in 2012 to 2.6 million m2 by 2015, while our plant currently has capacity to produce up to 4 million m2.
We will be optimizing our wood products eiciency by relocating and consolidating our operations in Surabaya and Gresik to a new panel products processing plant in Lumajang by 2015. his is closer to our satellite plants and will reduce our transportations costs.
7.0%
growth in
fl
ooring
sales volume
17.6%
increase in
fl
ooring
ASP
FY 2014 FY 2013 YoY Δ% Q 4-2014 Q 3-2014 QoQ Δ%Sale s Volume
Pane l (m3) 201,696 244,642 -17.6 51,823 35,984 44.0
Eng ine e re d d oors (Pcs) 51,469 51,989 -1.0 13,692 11,880 15.3
Eng ine e re d flooring (m2) 1,145,956 1,073,412 6.8 267,258 278,883 -4.2
Ave rag e Se lling Price (IDR mn)
Pane l (m3) 4.37 3.97 10.0 4.53 4.38 3.4
Eng ine e re d d oors (p cs) 1.24 1.06 16.6 1.36 1.19 14.3
Eng ine e re d flooring (m2) 0.37 0.31 17.6 0.39 0.37 5.4
Custome r Name Typ e Prod ucts Re lationshi Ge og rap hy
S.A. Shahab & Comp any Pte Ltd Trad e r Pane ls 11 ye ars Mid d le East
Sumitomo Fore stry Comp any Ltd . Trad e r Pane ls 8 ye ars Jap an
Vintag e Hard wood Flooring Distrib utor Eng ine e re d Flooring 9 ye ars Canad a
Jiang su Skyrun Arse r Co., Ltd Trad e r Pane ls 3 ye ars China
Asia Trad ing , Inc Trad e r Pane ls 7 ye ars Jap an
Associate d Lumb e r & Trad ing , Ltd Trad e r Pane ls 5 Ye ars Jap an
PKF Glob al Trad e r Eng ine e re d Doors 15 ye ars UK
Q 3 2014 De b t Position IDR Bn
Total De b t 3,253
Ne t De b t 2,392
Eq uity 2,161
EBITDA 1,026
Financial Ratios:
De b t/Eq uity 1.5
Ne t De b t/Eq uity 1.1
Ne t De b t/EBITDA 1.8
Loans O utstand ing IDR Bn US$ MM
Re volving Loan 289 28 Curre nt Portion of LT De b t 305 11 Long Te rm De b t 1,896 22 Finance Le ase s 2 1
Total 2,202 34
Total (IDR b n) 9-Mo ' 14 9-Mo ' 13 2013 2012 2011 2010
Re ve nue 3,726 2,681 3,842 3,411 2,778 1,751 EBITDA 1,026 549 888 666 665 297
EBITDA Marg in 27.5% 20.5% 23.1% 19.5% 24.0% 17.0%
Ne t Profit 522 123 216 252 374 162
Ne t Marg in 14.0% 4.6% 5.6% 7.4% 13.5% 9.3%
Palm O il
Re ve nue 2,711 1,651 2,478 1,997 1,524 971 EBITDA 1,023 505 885 614 652 307
EBITDA Marg in 37.7% 30.6% 35.7% 30.8% 42.8% 31.7%
Profit Be fore Tax 795 259 517 416 547 260
PBT Marg in 29.3% 15.7% 20.9% 20.9% 35.9% 26.8%
Wood Prod ucts
Re ve nue 1,016 1,030 1,364 1,414 1,254 780 EBITDA 69 83 73 123 63 26
EBITDA Marg in 6.8% 8.1% 5.4% 8.7% 5.0% 3.3%
Profit Be fore Tax (5) (16) (80) 33 12 (5)
PBT Marg in -0.5% -1.6% -5.9% 2.3% 0.9% -0.6%
DSN’s 9-month revenue of Rp3,726 billion is 39% than
2013, with EBITDA growing by 87% as margins expand
The d e cline in Ne t Profit in 2013, d e sp ite sig nificant incre ase s in re ve nue and EBITDA, is larg e ly d ue to the imp act of ye ar-e nd d e p re ciation of the rup iah ag ainst the d ollar. The mark-to-marke t of our $70 million FX loans outstand ing re sulte d in an unre alize d FX loss of Rp 172 b illion.
Note : Annual Financial State me nts are aud ite d b y Sid d harta & Wijaja, Re g iste re d Pub lic Accountants, and a Me mb e r Firm of KPMG Inte rnational.
39%
YTD growth
in total
revenue
1.1x
Net debt to
equity
Rp1,026
billion in
EBITDA
37.7%
EBITDA
margin in
palm
business
Rp522
billion in net
pro
fi
t
1.8x
Net debt to
Our commitment to social and environmental responsibility
is integral to the sustainability of our operations
Corporate Social Responsibility
DSN is committed to a wide range of CSR programs, and we continuously engage and support the communities within which we operate.
We maintain active partnerships with more than 20 cooperatives of smallholders near our plantations to manage a total of 12,666 ha of planted area under our Plasma Program. his program helps increase the productivity of our plasma by leveraging on DSN’s expertise in plantation operations.
We exclusively employ local contractors and cooperatives for all of our transportation, construction, and other non-core services. We have been instrumental in fostering the development of these small businesses and rely on them to the extent that we do not own any trucks for the transport of FFB to our mills.
We continue to promote literacy by making education accessible through the establishment of schools in our plantation areas as well as community learning centers in the surrounding villages with the help of the University of Sanata Dharma.
We have also provided free medical services to all our employees and our local communities since we started operations, with a network of clinics across our estates.
Our successful implementation of these and other CSR programs has resulted in no demonstrations or operational disturbances over the last 3 years by the local population or NGOs.
Environmental Responsibility
We and our subsidiaries involved in the palm oil business are members of the Roundtable on Sustainable Palm Oil (RSPO), and strive to comply with global RSPO and the Indonesian Sustainable Palm Oil (“ISPO”) principles.
We have received RSPO certiication for our SWA, DAN and DIN palm oil plantations along with their respective mills, and have completed the RSPO and ISPO audit process in December 2013 for all our mills and their respective estates. We have also completed the ISCC audit, facilitating sales of our CPO for biofuels.
We are also committed to protecting our environment. We have set aside 6,600 hectares of land, or an area roughly equivalent to 10% of our total planted area, for conservation purposes. We comply with various domestic and international
environmental standards in our wood products manufacturing processes, and seek to ensure that all the logs and sawn timber purchased for our operations are produced from sustainable forest resources.
9-M onth 2014 Summary Financials
Gross Profit 1,256 739 70.0 410 505
% margin 33.7 27.6 35.3 38.1
O p e rating Profit 829 391 111.9 261 363
% margin 22.3 14.6 22.4 27.4
EBITDA 1,026 549 86.9 327 430
% margin 27.5 20.5 32.4
Gross Profit 1,144 613 86.6 395 459
% margin 42.2 37.1 44.7 47.9
O p e rating Profit 878 387 126.6 310 358
% margin 32.4 23.5 35.1 37.4
EBITDA 1,023 505 102.8 351 413
% margin 37.7 30.6 39.8 43.1
Financial Position Q 3-2014 Q 2-2014
9-M onth 2014 Operations Summary
DISCLAIMER: This p re se ntation may contain forward -looking state me nts that involve risks and unce rtaintie s. Actual future p e rfo rmance , outcome s and re sults may d iffe r mate rially from those e xp re sse d in forward looking state me nts as a re sult of a numb e r of risks, unce rtaintie s and assump tions. Althoug h the Comp any b e lie ve s that such forward -conne ction with this p re se ntation.
This p re se ntation also contains ce rtain statistical d ata and analyse s which have b e e n p re p are d b y the Comp any and /or othe r source s. Nume rous assump tions we re use d in p re p aring the Statistical Information, which assump tions may or may not ap p e ar he re in. As such, no assurance can b e g ive n as to the Statistical Informations accuracy, ap p rop riate ne ss or comp le te ne ss in any p articular conte xt, nor as to whe the r the Statistical Information and /or the assump tions up on which the y are b ase d re fle ct p re se nt marke t cond itions or future marke t p e rformance .
DSNG Daily Share Price (rp /share ) & Trad ing Volume (share s)
DSNG Share Price vs. IDX & Ag ri Ind e x
For ad d itional information,
p le ase re fe r to our we b site at:
www.d sng roup .co.id
If you have ad d itional q ue stions
or re q ue sts, you may contact us
at:
inve stor.re lations@d sng roup .co.id
01,000 2,000 3,000 4,000 5,000
14-Jun-13 14-Se p -13 14-De c-13 14-Mar-14 14-Jun-14 14-Se p -14 14-De c-14
0.0 0.5 1.0 1.5 2.0 2.5
14-Jun-13 14-Se p -13 14-De c-13 14-Mar-14 14-Jun-14 14-Se p -14 14-De c-14 Ag ri DSNG
IDX
DSNG Share hold e rs (%)
O e tomo Family 29.8
Rachmat Family 25.1
Salim Lim Family 8.2
Sub ianto Family 7.2
Commissione rs & Dire ctors 10.3
Pub lic 19.5