sites were investigated as a preliminary study for evaluation of air quality in these areas. Sampling of airborne particulate matter was conducted in July 2009 using a Gent stacked filter unit sampler and a total of 18 pairs of samples were collected. Black carbon was determined by reflectance measurement and elemental analysis was performed using particle induced X-ray emission (PIXE). Elements Na, Mg, Al, Si, P, S, Cl, K, Ca, Ti, Cr, Mn, Fe, Cu, Zn and As were detected. Twenty four hour PM2.5concentration at semi industrial sites Kiaracondong and Holis ranged from 4.0 to 22.2 µg m−3, while the PM10concentration ranged from 24.5 to 77.1 µg m−3. High concentration of crustal elements, sulphur and zinc were identified in fine and coarse fractions for both sites. The fine fraction data from both sites were analyzed using a multivariate principal component analysis and for Kiaracondong site, identified factors are attributed to sea-salt with soil dust, vehicular emissions and biomass burning, non ferrous smelter, and iron/steel work industry, while for Holis site identified factors are attributed to soil dust, industrial emissions, vehicular emissions with biomass burning, and sea-salt. Although particulate samples were collected from semi industrial sites, vehicular emissions constituted with S, Zn and BC were identified in both sites.
Keywords:airborne particulate matter; semi industrial sites; principal component analysis; PIXE
ABSTRAK
Investigasi terkait konsentrasi massa partikulat udara, black carbon dan konsentrasi unsur pada sampel partikulat udara yang disampling di dua daerah semi industri merupakan studi pendahuluan sebagai evaluasi kualitas udara di daerah ini. Sampling sampel partikulat udara dilakukan di bulan Juli 2009 menggunakan sampler Gent stacked filter unit, dan diperoleh sebanyak 18 pasang sampel. Penentuan Black carbon dilakukan menggunakan pengukuran reflektansi dan analisis unsur dilakukan menggunakan particle induced x-ray emission (PIXE). Unsur-unsur Na, Mg, Al, Si, P, S, Cl, K, Ca, Ti, Cr, Mn, Fe, Cu, Zn dan As dapat dideteksi dengan baik. Konsentrasi 24 jam PM2.5 di daerah semi industri Kiaracondong dan Holis berkisar 4,0 hingga 22,2 µg m−3, sementara konsentrasi PM10berkisar 24,5 hingga 77,1 µg m−3. Unsur-unsur tanah, sulfur dan seng terdeteksi dalam konsentrasi tinggi pada sampel partikulat udara halus maupun kasar pada kedua lokasi. Data partikulat halus dari kedua lokasi selanjutnya diolah menggunakan multivariate principal component analysis, untuk daerah Kiaracondong dapat diidentifikasikan faktor yang berasal dari garam laut dan debu tanah, emisi kendaraan bermotor dan pembakaran biomassa, peleburan logam non besi, industri besi/baja, sementara itu untuk daerah Holis teridentifikasi faktor yang berasal dari debu tanah, emisi industri, emisi kendaraan bermotor dengan pembakaran biomassa dan garam laut. Sekalipun sampel partikulat udara diambil di lokasi semi industri, sumber pencemaran berupa emisi kendaraan bermotor yang terkait korelasi S, Zn dan BC teridentifikasi pada kedua lokasi.
Kata Kunci:sampel partikulat udara; lokasi semi industri; principal component analysis; PIXE
INTRODUCTION
Air pollution has become an important problem that requires serious attention due to its impact on human health and environmental quality. A large number of epidemiological studies have shown that air pollution
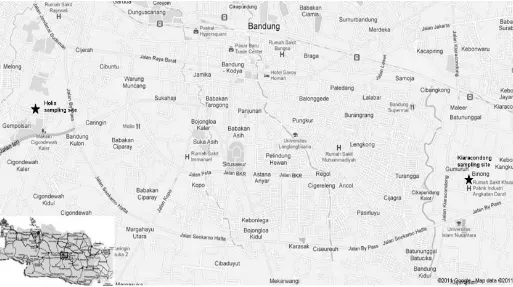
Fig 1.Sampling sites of semi industrial area Kiaracondong and Holis, Bandung
investigate the spatial and temporal patterns of transport and deposition of particular air pollutants to the Indonesian environment. Some publications related to air pollution level in urban Bandung and suburban Lembang have been published. Santoso et al. [5] reported on the composition and source apportionment of fine and coarse particle samples collected in Bandung and Lembang, Indonesia between 2002 and 2004. The mean values of PM2.5 concentrations in Bandung and
Lembang were 14.03±6.86 and 11.88±6.60 μg m−3,
respectively. The mean values of PM10–2.5concentrations in Bandung and Lembang were 17.64±9.42 and
7.10±7.04 μg m−3, respectively. Only limited publications
of air pollution in Indonesia are available, and the data of air quality in industrial area are still limited. Industrial emissions are believed to be one of major contributor to particulate matter, therefore this study will assess the PM2.5 and PM10 level in industrial areas particularly in Bandung. Besides that, the objective of this research is also as a pre-study to identify the sources that could contribute to the particulate mass especially from industrial emissions in the areas.
Bandung is the capital city of West Java Province and the third largest city in Indonesia, located at 768 meters above sea level, approximately 140 km southeast of Jakarta. The city is surrounded by volcanoes. This topography characteristic making Bandung has lower temperatures year-around than most
location of sampling sites is shown in Fig. 1. The distance between these locations is 6 km away.
Samples were collected from 6 to 31 July 2009 using a Gent stacked filter unit sampler provided by International Atomic Energy Agency that capable for collecting particulate matter in the PM2.5-10 (coarse) fraction and PM2.5 size (fine) fraction [8]. The coarse fraction PM2.5-10 samples were collected on an 8.0 μm nuclepore filters, whereas the fine fraction PM2.5samples
were collected on 0.4 μm nuclepore filters. Sampling
was performed at a flow rate of 15-18 L.min-1 for 24 h with a frequency of twice to three times per week over 3 to 4 week periods. Sampler was placed on the rooftop of a building 5 m above ground level and the intake nozzle of the sampler is located 1.8 m above the roof. The total of 18 pairs of PM2.5and PM2.5-10samples were collected from both areas.
Mass Concentration, Black Carbon and Elemental Analysis
The particulate matter mass of each fine and coarse fractions were determined by gravimetric using a six digits microbalance. The filters were stored for 24 h prior to weighing in controlled environmental condition room. Mass concentrations of PM2.5and PM2.5-10(µg m-3) were obtained by dividing the gravimetric mass by the volume of air that passed through the filter. The concentration of black carbon (BC) in the samples was determined by reflectance measurement using an EEL Smoke Stain Reflectometer model 43D. Secondary standard of known reflectance were used to calibrate the reflectometer. Elemental analysis was performed using particle induced x-ray emission at the Institute of Geological and Nuclear Sciences (GNS), New Zealand. The X-ray spectra were analyzed using the computer code GUPIX [9] and calibration of the PIXE system was performed by irradiating suitable Micromatter thin target standards [10].
various sources contribute different amount of particles to each samples, the mass balance needs to be expanded to a matrix equation:
ZA F
where, Z is a matrix of sample vectors, A is the matrix of loading vectors related to the source compositions and F is the matrix of scores that are related to the contribution of that source type to the variance of that particular measured variable. PCA has been widely used in studies of airborne particulate matter composition data [11].
RESULT AND DISCUSSION
Particulate Matter and Black Carbon
Concentrations
PM2.5, PM10 and BC concentrations for each site are summarized in Table 1. Twenty four hour PM2.5 concentration at semi industrial sites Kiaracondong and Holis ranged from 4.0 to 22.2 µg m−3, while the PM10 concentration ranged from 24.5 to 77.1 µg m−3. PM2.5 and PM10 concentrations for both sites are shown in Fig. 2. The mean PM2.5 concentrations for Kiaracondong and Holis sites were 15.9 and 13.9 µg m−3, respectively, while the mean PM10concentrations were 43.4 and 48.3 µg m−3, respectively. Assuming that these 4 weeks of sampling can represent the annual mean of PM2.5level, most of the PM2.5concentrations in sampling site Kiaracondong would exceed the Indonesian national ambient air quality standard of an annual mean PM2.5 value of 15 µg m−3 [12]. However, none of PM2.5 and PM10 concentrations in each sampling sites exceeded the twenty four hour Indonesian NAAQS for PM2.5and PM10(65 and 150 µg m−3, respectively).
Fig 2.PM mass concentrations at the two semi industrial sampling sites in July 2009
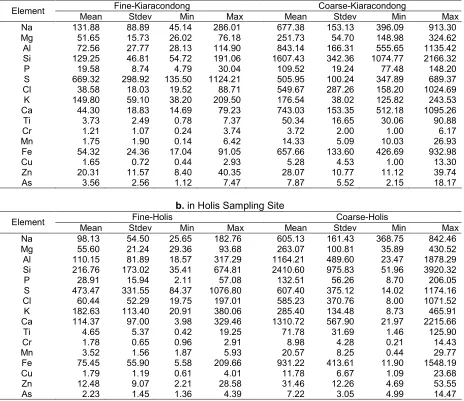
Table 2.Elemental concentrations (µg m-3) in fine and coarse fractions collected in July 2009, a.in Kiaracondong sampling site
Fine-Kiaracondong Coarse-Kiaracondong
Element
Mean Stdev Min Max Mean Stdev Min Max
Na 131.88 88.89 45.14 286.01 677.38 153.13 396.09 913.30
Mg 51.65 15.73 26.02 76.18 251.73 54.70 148.98 324.62
Al 72.56 27.77 28.13 114.90 843.14 166.31 555.65 1135.42
Si 129.25 46.81 54.72 191.06 1607.43 342.36 1074.77 2166.32
P 19.58 8.74 4.79 30.04 109.52 19.24 77.48 148.20
S 669.32 298.92 135.50 1124.21 505.95 100.24 347.89 689.37
Cl 38.58 18.03 19.52 88.71 549.67 287.26 158.20 1024.69
K 149.80 59.10 38.20 209.50 176.54 38.02 125.82 243.53
Ca 44.30 18.83 14.69 79.23 743.03 153.35 512.18 1095.26
Ti 3.73 2.49 0.78 7.37 50.34 16.65 30.06 90.88
Cr 1.21 1.07 0.24 3.74 3.72 2.00 1.00 6.17
Mn 1.75 1.90 0.14 6.42 14.33 5.09 10.03 26.93
Fe 54.32 24.36 17.04 91.05 657.66 133.60 426.69 932.98
Cu 1.65 0.72 0.44 2.93 5.28 4.53 1.00 13.30
Zn 20.31 11.57 8.40 40.35 28.07 10.77 11.12 39.74
As 3.56 2.56 1.12 7.47 7.87 5.52 2.15 18.17
b.in Holis Sampling Site
Fine-Holis Coarse-Holis
Element
Mean Stdev Min Max Mean Stdev Min Max
Na 98.13 54.50 25.65 182.76 605.13 161.43 368.75 842.46
Mg 55.60 21.24 29.36 93.68 263.07 100.81 35.89 430.52
Al 110.15 81.89 18.57 317.29 1164.21 489.60 23.47 1878.29
Si 216.76 173.02 35.41 674.81 2410.60 975.83 51.96 3920.32
P 28.91 15.94 2.11 57.08 132.51 56.26 8.70 206.05
S 473.47 331.55 84.37 1076.80 607.40 375.12 14.02 1174.16
Cl 60.44 52.29 19.75 197.01 585.23 370.76 8.00 1071.52
K 182.63 113.40 20.91 380.06 285.40 134.48 8.73 465.91
Ca 114.37 97.00 3.98 329.46 1310.72 567.90 21.97 2215.66
Ti 4.65 5.37 0.42 19.25 71.78 31.69 1.46 125.90
Cr 1.78 0.65 0.96 2.91 8.98 4.28 0.21 14.43
Mn 3.52 1.56 1.87 5.93 20.57 8.25 0.44 29.77
Fe 75.45 55.90 5.58 209.66 931.22 413.61 11.90 1548.19
Cu 1.79 1.19 0.61 4.01 11.78 6.67 1.09 23.68
Zn 12.48 9.07 2.21 28.58 31.46 12.26 4.69 53.55
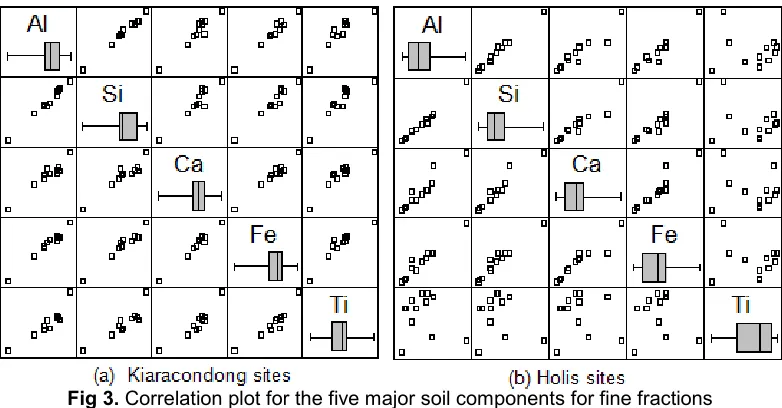
Fig 3.Correlation plot for the five major soil components for fine fractions
Table 3. Factor analysis with varimax rotation for fine fraction data:
a.from Kiaracondong site
Parameter Factor 1 Factor 2 Factor 3 Factor 4
BC -0.6601 0.5637 0.2031 0.0586
Na 0.8374 -0.5036 -0.0372 -0.0448
Al 0.9746 0.0779 -0.0444 0.2423
Si 0.9637 0.1259 -0.0902 0.2326
S -0.1944 0.9281 0.0508 -0.0013
K 0.3200 0.8363 0.3990 -0.0124
Ca 0.9863 -0.0369 -0.0497 0.0984
Ti 0.9554 0.1904 0.0401 -0.0051
Cr -0.0244 -0.0254 0.0260 0.9749
Mn 0.8881 -0.1147 0.3587 -0.2157
Fe 0.9926 -0.0214 0.1550 0.2046
Zn 0.0640 0.9641 -0.1642 0.0043
Cu 0.3777 0.0352 0.9238 -0.0161
b.from Holis site
Parameter Factor 1 Factor 2 Factor 3 Factor 4
BC 0.6627 0.0228 0.5162 0.4355
Na 0.0597 0.1090 0.0953 0.9503
Al 0.9263 -0.1046 0.2594 0.2012
Si 0.9434 -0.1158 0.1900 0.2038
S 0.2162 0.0768 0.9331 -0.1520
Cl 0.4258 0.1880 -0.1084 0.8251
K 0.2812 -0.0657 0.6293 0.6386
Ca 0.9559 -0.0365 0.1540 0.1437
Ti -0.1073 0.8965 0.0788 0.0286
Cr -0.1809 0.9289 0.0642 -0.1083
Mn 0.1113 0.8200 -0.2565 0.3947
Fe 0.8940 -0.0714 0.3738 0.2061
Zn 0.3737 -0.0644 0.8772 0.1058
sampling sites ranged from 13-31%. These values do not differ significantly with the values reported in industrial area in Serpong area in 2008 (13-26%) which used the same sampling method and analytical procedure [13]. Transport related emissions are the
major source of BC and long-range transport from fossil fuel related sources and biomass burning could be other substantial sources of BC [14].
Elemental Concentrations
Several elements were detected by PIXE in fine and coarse fractions. Elements such as Na, Mg, Al, Si, P, S, Cl, K, Ca, Ti, Mn, Fe and Zn were detected in the most of the filters (over 90%), Cu and As were present in more than 30% of the samples, while V, Br, Hg and Pb were detected in less than 10% of the samples. The average elemental concentrations in coarse and fine particulate matter in Kiaracondong and Holis sampling sites are shown in Table 2.
High concentration of Al, Si, Ca, Fe and Mn which are crustal elements, S and Zn were identified in PM2.5 and PM10for both sites.
Sulphur in airborne particulate matter is generally present because of the atmospheric conversion of SO2 to sulfate through homogenous processes [15]. Thus in general, only a portion of the particulate sulfate is the result of local sources because there is insufficient time to allow substantial conversion. Zinc is emitted from municipal solid waste, galvanizing operations, and non-ferrous metal smelting. All of these sources contribute to the fine fraction. However, the two stroke engine emissions can provide substantial zinc contribution to the urban street dust and thus also be found in coarse fraction [15].
Principal Component Analysis
The trends in data monitored were analyzed using an approach based on factor analysis to identify quantitatively the source contributing to the pollution. To address the air quality issues, it is always necessary to have information on possible source contribution. A multivariate principal component analysis using Statgraphics Software was applied to the fine fraction data set to identify the major elements associated with the sources. Factors with two or more elements having factor loadings above 0.5 have been highlighted. The varimax factor loadings after rotation are presented in Table 3. The loadings are showing the value of a correlation coefficient between the original variables and new factor variables that represent a linear combination. Loading values over 0.50 are generally significant provide insights into the nature of the sources [11].
Kiaracondong sampling site
Factor analysis for data from Kiaracondong site was identified four factors. The identified sources are attributed to soil, biomass burning and vehicle emissions, non ferrous smelter and iron/steel work industry. The first factor is crustal elements Al, Si, Ca, Fe and Ti which are recognized as typical soil indicators. It also can be seen from the correlation among these elements that it has strong correlation for each element. There is additional loading from Na which indicates that soil factor is also mixed with sea-salt. The second factor has the characteristic of high BC, S, K and Zn. This combination of elements suggests the contribution from biomass burning which is indicated by potassium that is strongly related to the biomass combustion, and vehicular emissions indicated from high S and Zn [13]. Bandung still has a large area of rice fields which is the main source of biomass burning and open solid waste burning from residential activity is also a potential source of biomass burning [7]. High concentration of S is attributed to the low fuel quality. Sulfur comes from diesel vehicles emissions since Indonesia still has high sulfur content in diesel fuel [5]. There is a fly-over road
about 500 m to the west side of the sampling site, with many heavy vehicles pass through this area. The third factor is related to Cu from non ferrous smelter. In this sampling site, there is one big scale metal workshop industry which estimates to contribute to this factor. This industry also contributes to the fourth factor that has high factor loading for Cr. This element would be expected to be related to the iron/steel works [11]. It is more logical if Fe also has high positive loading on this factor, but due to the limited numbers of data the clearly correlation was not obtained.
Holis sampling site
Factor analysis for data from Holis site was identified four factors. The first factor is crustal elements represent soil component. The second factor has high loading for Ti, Cr and Mn which indicated as the fingerprint of industrial activities. Ti could be expected from paint pigment plant that produces TiO2 and is a major source of fine particle titanium. In this sampling site, there are several painting textile industries which may contribute to this source. This Ti source was clearly showed up when plotting the correlation of crustal elements for soil component (Fig. 3 (b)). It shows that apparently there is another Ti source, since Ti appears having a negative correlation with the other crustal elements. The third factor is related to BC, S, K and Zn. This factor would be expected from vehicular emission especially from diesel vehicles mixed with biomass burning which also emits large quantity of black smoke. The fourth factor is clearly sea-salt by the presence of Na and Cl correlation. It appears to be quite number of loading for BC and K which indicates that biomass burning could be mixed with this factor.
CONCLUSION
and Tri-Tugaswati, A., 2003, Arch. Environ. Health, 58, 3, 135–143.
4. Clean Air Initiative for Asian Cities (CAI-Asia) Center, 2010, Indonesia: Air Quality Profile 2010 Edition.
5. Santoso, M., Hopke, P.K., Hidayat, A., and Lestiani, D.D., 2008,Sci. Total Environ., 397, 1-3, 229–237. 6. Statistics Indonesia, 2010, Population census 2010
Province Jawa Barat,
http://www.bps.go.id/aboutus.php?sp=0&kota=32 7. Lestari, P., and Mauliadi, Y.D., 2009, Atmos.
Environ., 43, 10, 1760–1770.
8. Hopke, P.K., Xie, Y., Raunemaa, T., Biegalski, S., Landsberger, S., Maenhaut, W., Artaxo, P., and
R.,Hamonangan, E., H., Syafrul, H., Markwitz, A., and Hopke, P.K., 2011, Atmos. Pollut. Res., 2, 190–196.
14. Begum, B.A, Tazmin, A., Rabbani, K.A., Biswas, S.K., and Nasiruddin, M., 2009, J. Bangladesh Acad. Sci., 33, 1, 71–85