ASSOCIATED WITH THE SALT STRESS RESPONSE IN
PERENNIAL EUCALYPT TREE HYBRID CLONES
ECGPT
Eny Faridah
Salinity effects on plant can often be related to mineral ion content alteration, including phosphate. Under saline conditions, phosphate levels were reported to decrease in plants. Such effects could indirectly affect intracellular phosphate levels, leading to phosphate deficiency, which in turn leads to increased activities of phosphate uptake mechanisms. This research was aimed to investigate the effects of salinity on the expression changes of phosphate transporter genes isolated from x
hybrid clones subjected to salt concentrations of 0 (control), 50, 100, and 150 mMNaCl. Fragments of genes (1164bp long and encodes 304 amino acid polypeptides) known to be involved in phosphate uptake were identified and isolated by RACE from these hybrids, encoding a Phosphate Transporter ( PT). Expression studies using Northern-Blot analysis revealed that the expression of PT was found to be affected by salt, suggesting a direct effect of salinity on phosphate uptake. PT was expressed differently in different clones, indicating different degrees of phosphate transporter activation in order to tolerate salt stress. Molecular data are discussed in relation to measurements of ion levels in different organs of different clones and under various salt regimes during the course of the hydroponic experiment.
Keywords: Phosphate transporter gene, salinity stress, phosphate content, eucalypt Received : 13 August 2012, Accepted : 9 December 2013
ABSTRACT
E. camaldulensis E. globulus
Ecg
Ecg Ecg
I. INTRODUCTION
Plants have developed a variety of mechanisms to survive environmental stress. A dual-mechanism model for ion uptake, including phosphate, has been proposed for many plants (Chrispeels 1999; Epstein, 1966). This is characterized by a low-affinity uptake system operating at high (mM) concentrations, and a high-affinity system functioning at low (M) concentration of ions. A high-affinity inorganic phosphate transporter (PT) was first recognized
in as the gene
(Bun-Ya 1991). Later, several high-affinity
Phosphate transporters have been identified and
isolated in all belonging to the same
gene family, (Muchhal 1996; Smith
et al.,
Saccharomyces cerevisiae PH084 et al.,
Arabidopsis,
Pht1 et al., et al.,
1997). Homologues to PT gene family have also been isolated from potato (Leggewie 1997),
tomato (Daram 1998; Liu 1998), and
barley (Rae 2003). The sizes of PT mRNAs
differ in different species, but lengths of their Open Reading Frames (ORF) are similar. This high similarity of ORF among various plants indicates similar function of PT gene in those plant species, while the various lengths of untranslated regions in different species might reflect the host plant specific differences in PT gene function (Lam and Maisel, 1999).
High-affinity phosphate uptake system in all plants respond to phosphate deprivation with a dramatic increase in transcript levels (Schachtman 1998). Transcriptional regulation of genes primarily responded to the P status of the whole plant, and its protein level was reversible upon
resupply of Pi (Liu 1998; Muchhal and
et al., et al., et al., et al.,
et al., PT
et al.,
EcgPT Eucalyptus camaldulensis globulus Phosphate Transporter
E. camaldulensis E. globulus
Salinity is believed to disrupt the mechanisms that controlintracellular orthophosphate (Pi) concentrations (Ashraf and Ahmad, 2000), and mechanism of general transporter activities (Chen 2012). Such effects could indirectly regulate intracellular P levels, and lead to phosphate deficiency. This led to the hypothesis that phosphate deficiency might be a secondary effect of salinity (Plaxton and Carswell, 1999), and that salt-stressed plants may actively regulate their P uptake and transport systems to maintain uptake and distribution of P.
Some eucalypt species are known for their tolerance to salt, but little is understood on how salt stress might affect nutrient uptake mechanism such as phosphate transporter. Therefore, the study aimed to investigate whether
( x
) expression is 1) regulated by salt, indicating an effect of salt stress on P uptake, and 2) differentially regulated in different clones, indicating various salt tolerance mechanisms.
Six-month-old x
hybrid cuttings purchased from Saltgrow Company (from 9 clones coded as clones 1-9) were grown in hydroponic tubs in the glasshouse at a temperature of 21 C/18 C, under 14h/day and10h/night regime. After growing in half-strength nutrient solution for the first week the plants were transferred to full strength nutrient solution (Morris, 1984). In the third week, salt in the form of NaCl was added to the full-strength nutrient solution to final concentrations of 0mM (as control), 50mM, 100mM, and 150mM. Nutrient and salt solutions were renewed with fresh solution every week for the five-week duration of the experiment, and plants were harvested every week from different clones and different salt concentrations.
Upon harvesting, plants were divided into 3 parts: leaves, stems, branches, and roots. Some young leaves and parts of the root material were
II. METHODOLOGY
A. Plant Material and Growing Conditions
o o
taken for nutrient analysis. The remaining samples (leaves, stems, roots) were separated into 50 mL Falcon tubes, immediately snap-frozen in liquid nitrogen and stored at -80 C for total RNA extraction.
Messenger RNA (mRNA) used for RACE was isolated from total RNA using a Promega mRNA isolation kit.The synthesized single stranded cDNA reactions produced were used as templates for amplification of 5' and 3' ends using the ClontechSMART™ RACE cDNA Amplification Kit.
To amplify cDNA fragments, two GC-rich
G e n e S p e c i f i c P r i m e r s ( P F 1 : CTCGTTACACCGCCC-TAGTGGCCAAGA a n d P R 1 : AG C G AC C G T G A AC C AG -TATCCAGGGAC) were designed based on the
sequence of previously amplified DNA PCR
products (data not shown) to amplify the gene's 5' and 3' ends through RT-PCR. RACE reactions
were carried out using polymerase
(Fermentas) and the following cycle profile: initial denaturation of cDNA at 95 C for 20sec, 35-38 cycles of amplification by denaturing at 95 C for 5sec, annealing at 60 C for 1min and extending at 70 C for 2min, and a final extension at 70 C for 4 min.
Sub-cloned cDNAs were labeled using the CEQ 2000 Dye Terminator Cycle Sequencing Kit using T3 (5'-AATTAACCCTCACTAAAGGG-3') or T7 (5'-GTAATACGACTCACTATAGG-GC-3') primers. Sequences were determined using a CEQ8000 DNA Sequencer (Beckman Coulter). Sequences were compared with existing publicly available sequences using BLAST (http://www.-ncbi.nlm.nih.gov). Sequence alignment and analysis were performed through facilities avail-able at Bionavigator (http://www.biona-vigator.com), and the Expasy Molecular Biology
( ), as well as additional
sequence analysis such as PSORT analyses.
o
o
o o
o o
B. 5' and 3' RACE (Rapid Amplification of cDNA Ends)
C. Sequencing and Sequence Analysis PT
PT
Taq
d. Northern Blot Analysis
Analysis was conducted as prescribed by Amersham pharmacia in 2004. Probes designed to 3' end used for Northern Blotting was DNA fragments (data not shown). Amounts of RNA loaded onto each gel were visualized and compared using Ethidium Bromide (EtBr) staining. DNA probes were radioactively labeled using the Decalabel
P]-dATP (Perkin Elmer). Labeling, prehybridization and hybridization methods were done following manufacturer's instructions.
EcgPT
TM 32
DNA labeling kit (Fermentas) and
[α-III. RESULT AND DISCUSSION a. EcgPT Race
The cloned PT ( PT-3') was 1096bp in
length, and combination with a 68bp sequence from the genomic DNA fragment (located 5' direction) resulted in a 1164bp sequence encoding a 305 amino acid polypeptide. This fragment contained a 3'-untranslated region of 249bp length. Alignment to other PTs at the deduced amino acid level confirmed the end of the coding region and the position of in relation to other PTs (Figure 1).
Ecg Ecg
PT
EcgPT
Figure 1. Deduced amino acid alignment of PT and three known PTs: (NtPT, acc.
no: AAF74025), (SrPT, acc. no: CAC28219), and (AtPT,
acc. no: BAA24280). Amino acids conserved among all four clones (full consensus) are shown in black, upper-case letters; medium consensus (those conserved among three or two clones) are represented by orange, lower-case letters. Other consensus symbols are: ! (I and V), $ (L and M), % (F and Y), and # (N, D, Q, E, B, and Z). Asterisks indicate the stop codon. Possible transmembrane domains are indicated by Roman numerals (generated based on hydropathy
analysis ( and PT gene structure in tomato (Daram
1998) and (Muchhal 1996)). Consensus sites for phosphorylation by protein
Ecg Nicotiana tabacum
Sesbania rostrata Arabidopsis thaliana
et al. Arabidopsis et al.
Based on its deduced amino acid sequence, a PSORT analysis (Prediction of Protein
Localization Sites, )
predicted that PT is likely to be localized in mitochondrial inner membranes (certainty= 0.746) or in the plasma membrane (certainty= 0.600). This result suggests that PT encodes a http://psort.nibb.ac.jp
Ecg
Ecg
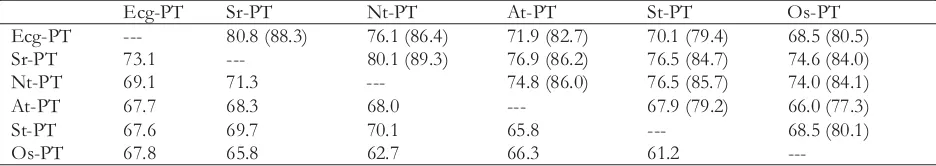
transmembrane PT (refer to Figure 1). When the nucleotide sequence of the PT fragment was aligned to cDNAs of potato and
PTs, it showed 67.6% and 67.7% identity, respectively. A summary of identity values among available PTs is shown in Table 1.
Ecg
Arabidopsis thaliana
Table 1. Nucleotide and amino acid sequence identity between available Pts* **
Ecg-PT Sr-PT Nt-PT At-PT St-PT Os-PT
Ecg-PT --- 80.8 (88.3) 76.1 (86.4) 71.9 (82.7) 70.1 (79.4) 68.5 (80.5)
left-hand side of the diagonal matrix = nucleotide identity, right-hand side of the diagonal matrix = amino acid identity (similarity shown in brackets)
Percentages of identity and similarity shown were determined by alignment of two sequences at a time (www.ebi.ac.uk). Accession numbers of nucleotide and protein sequences of each clones are as follows:
Sr-PT ( , nucleotides: AJ286744, protein: CAC28219), Nt-PT ( , nucleotides: AF156696, protein AAF74025),
At-PT ( , nucleotides: NM_128843, protein: BAA24280), St-PT ( , nucleotides: X98891, protein: CAA67396), Os-PT ( , nucleotides: AF536968, protein: AAN39049).
Sesbaniarostrata Nicotianatabacum Arabidopsis thaliana Solanumtuberosum
Oryza sativa
b. EcgPT Expression Patter ns in x Hybrid Clones
E. camaldulensis E. globulus
E. camaldulensis x
E. globulus Ecg
-Ecg
EcgPT
Ecg
Ecg
-Ecg
Effects of salinity on the expression of Phosphate transporter genes in
hybrids ( PT) were studied by subjec ting various clones to different salt concentrations (0mM, 50mM, 100mM, and 150mM). When membranes containing total RNA were probed
with PT (DNA), 2.9 kb transcripts were
detected (Figure 2). After two weeks of salt stress, expressions in the leaves of clone 7 were not noticeable at 0 and 50 mM NaCl, slightly increased at 100 mM NaCl and reached its peak at 150 mM NaCl concentration (Figure 2A). Similar patterns were noticed for stem tissues of clone 5 exposed to salt for three weeks (Figure 2B). In this clone, however, expression at salt levels 100mM and 150mM was higher than that found for leaves of clone 7. The initial conclusion from these observations is that the expression of PT is regulated by salt.
In order to examine whether PT gene ex pression in various organs was affected differently by increasing salt concentrations, total RNA was isolated from roots, stems and leaves after plants were exposed to various salt levels. In clone 9 (Figure 3), PT transcripts in leaves were clearly
+
detectable under control conditions, and gradually increased with increasing salt levels, reaching a peak at 100mM salt level, but declined slightly at salt level. In roots, PT transcripts were notice able even without salt treatment. Expression slightly increased when plants were treated with 50mM NaCl. At 100mM NaCl expression declined again, and remained constant at the highest salt level. PT expression in stems was not notice able in plants not subjected to salt treatment or at 50mM NaCl. Increasing salt concentration to 100mM slightly increased PT transcript levels, but at 150mM NaCl PT expression could not be observed.
PT was differentially expressed not only in plant organs, but significant differences also were
observed between different clones. PT
transcripts as they were accumulated in leaves of all clones (clones 1-9) exposed to 150mM NaCl for two weeks are shown in Figure 4A, illustrating
different activity levels of PT genes in
different clones in response to the same salt stress levels. Accumulation of PT transcripts could be related to the accumulation of P in leaves of the corresponding groups of clones (Figure 4B), i.e. groups with lower leaf P content showed higher PT expression levels
-Figure 2. PT expression in as induced by NaCl. . Leaves (L) of clone 7 (C7) after two weeks (W2) of exposure, and . Stems (S) of clone 5 (C5) after three weeks (W3) of exposure to 0mM, 50mM, 100mM, and 150mM NaCl. Total RNA loaded in each lane was 20µg.
Ecg E. camaldulensis x E. globulus A
B
Figure 3. PT expression in different plant organs (L = leaves, S = stems, R = roots) of
clones. Clone 9 after two weeks of exposure (W2) to 0mM, 50mM, 100mM, and 150mM NaCl. Total RNA loaded for each sample was 20µg. EtBr-staining confirmed that equal amounts were loaded in each lane. Boxed lanes are suspected to contain degraded RNA.
Ecg E. camaldulensis
x E. globulus
Figure 4. PT expression and P levels in plant leaves. A) Expression in different
clones after different lengths of exposure to 150mM NaCl. Total RNA loaded in each lane was 20µg. B) Leaf P (mg. (kg dw)- ) for corresponding clones (group A for clones 1, 2, 3; B for 4, 5, 6; and C
Ecg E. camaldulensis x E.
globulus
c. Amplification, Cloning and Sequence Analysis of EcgPT
d. Expression Studies of EcgPT
A Phosphate Transporter (PT) cDNA from was amplified by RACE, and further characterized and used for gene expression studies. A composite cDNA was assembled from two overlapping clones, PT-3',
amplified by RACE, and PT DNA, a cloned
PCR product amplified from genomic DNA. The PT is 1096bp long and encodes a 305 amino
acid polypeptide. PT also contains a
3'-untranslated region of 249bp and a stop codon (TAA) located at the 913 nucleotide (Figure 1). RACE and the subsequent cloning of PTs from only yielded a single PT clone. However, it is common for some plant species to have several PTs, as is the case for
with and
(Muchhal 1996), or potato with and
(Leggewie 1997).
Alignment results showed high homology
between PT and high-affinity PTs from a
diverse range of plant species, and indicated that the PT gene fragment is not located towards the 5' end of the gene-coding region when compared to other PTs (Figure 1). Being incomplete, PT might not contain consensus sequences specific to other PT genes. As an example, PT does not contain another site for phosphorylation by protein kinase, which is located around transmembrane domains IV. As expected, the localization of PT was predicted by PSORT to be within the plasma membrane (certainty= 0.600), although PSORT also predicted it to be localized in mitochondrial inner membrane (certainty=0.746), Golgi body (certainty=0.400), and chloroplast thylakoid membrane (certainty=0.349). These results
underline the function of PT as a
transporter/symporter.
P deprivation leads to an increase in transcript levels of Phosphate transporters, as demonstrated
in plants of Arabidopsis (Smith , 1997),
tomato (Mutikara , 2001), potato (Leggewie , 1997), barley (Rae 2003) and green algae Dunaliellasalina (Li , 2012). In this study, exposure to NaCl increased the accumulation of EcgPT transcripts in E. camaldulensis x E.
E. camaldulensis x E. globulus
Ecg Ecg
Ecg
Ecg
E. camaldulensis x E. globulus Ecg
Arabidopsis thaliana AtPT1 AtPT2
et al., StPT1
globulus, resembling symptoms of plants deprived of P (Figure 2). In fact, at higher salt concentrations, accumulation of EcgPT transcripts was observed to increase in all plant organs, indicating that increasing NaCl levels further reduced P uptake and hence P levels in plants. In addition, the expression of EcgPT in response to salt treatment differed in an organ-specific manner (Figure 3).
In plants grown without stress, EcgPT expression was noticeable in roots and leaves, but not in stems. These results are consistent with findings in potato, where StPT1, a high-affinity PT, was highly expressed in roots, source leaves and flower buds, but not in stems (Leggewie , 1997). This ubiquitous and relatively high base level of expression in leaves and roots might indicate that EcgPT has important physiological
functions in x even in
the absence of stress. Roots are the organs involved in nutrient acquisition, and once roots take up phosphate, this will be transported in the xylem to the leaves, and hence expression patterns of EcgPT genes in roots and leaves correlated well with their physiological function.
NaCl-induced EcgPT expression differed between clones (Figure 4A). Exposure to 150mM NaCl for two weeks increased EcgPT expression in leaves however, some exceptions were noted. Clones 2, 7 and 9 for example showed lower expression than other clones. When comparing different expression levels of EcgPT to accumulated P levels in corresponding clone groups (Figure 4B), it seems that despite relatively lower expression levels after longer exposure to stress, higher EcgPT expression levels initially might be associated with lower P accumulation in leaves. For example, clones 7, 8, and 9 (Group C), whose leaf P levels were the highest on average showed the lowest EcgPT expression levels. Consistently, Group A showing the lowest P accumulation levels responded with higher EcgPT expression on average.
Although it is difficult to answer with certainty whether different EcgPT expression levels are in fact related to leaf P levels, and whether these are largely affected by salt stress, it can be concluded
et al.
E. camaldulensis E. globulus
that EcgPT expression in x clone hybrids was regulated by salt levels in organ-specific manner and differently regulated in different clones. More research is needed to clearly establish the connection between EcgPT activation and plant physiological state (e.g. nutrient status) and to understand how EcgPT gene expression is influenced by environmental stresses.
Ashraf M. and Ahmad S. 2000. Influence of sodium chloride on ion accumulation, yield components and fibre characteristics in salt-tolerant and salt-sensitive lines of cotton
( L.).
66:115-127.
Bun-Ya M., Nishimura M., Harashima S., and Oshima Y. 1991. The PHO84 gene of encodes an inorganic
Chrispeels M.J., Crawford N.M., and Schroeder J.I. 1999. Proteins for transport of water and mineral nutrients across the
membranes of plant cells.
11:661-676.
Daram P., Brunner S., Persson B.L., Amrhein N., and Bucher M. 1998. Functional analysis and cell-specific expression of a phosphate
transporter from tomato.
206:225-233.
Epstein E. 1966. Dual pattern of ion absorption by plant cells and by plants.
212:1324-1327.
Lam E. and Maisel L. 1999. Gene switches and stress management: Modulation of gene expression by transcription factors. In
(Ed. HR Lerner), pp. 51-70. Marcel Dekker, Inc., New York.
E. camaldulensis E. globulus
Gossypium hirsutum Field Crops Res.
Saccharomyces cerevisiae
Mol. Cell Biol.
Populus
simonii Populus nigra Gene
Plant Cell
Planta
Nature
Plant Responses to Environmental Stresses: from Phytohormones to Genome Reorganization REFERENCES
. . .
Leggewie G., Willmitzer L., and Riesmeier J.W. 1997. Two cDNA from potato are able to complement a phosphate uptake deficient yeast mutant: identification of phosphate transporter from higher plants.
9:381-392.
Li S-H., Xia B-B., Zhang C., Cao J., and Bai L-H. 2012. Cloning and characterization of a phosphate transporter gene in
. . 52:429-436.
Liu C., Muchhal U.S., Uthappa M., Kononowicz A.K., and Raghothama K.G. 1998. Tomato p h o s p h a t e t r a n s p o r t e r g e n e s a r e differentially regulated in plant tissues by
phosphorus. 116:91-99.
Morris J.D. 1984. '
.' Forest Commission, Victoria Research Branch Report No. 249, Victoria. 20p.
Muchhal U.S., Pardo J.M., and Raghothama K.G. 1996. Phosphate transporters from the
higher plant .
93:10519-10523.
Muchhal U.S. and Raghothama K.G. 1999. Transcriptional regulation of plant phosphate transporters.
96:5868-5872.
Mutikara U.T., Liu C , Varadarajan D K , and R a g h o t h a m a K G. 2 0 0 1 . N e g a t ive Regulation of Phosphate
Starvation-Induced Genes1. 127:1854
1862.
Plaxton W.C. and Carswell M.C. 1999. Metabolic aspects of the phosphate starvation response in plants. In
(Ed. HR Lerner), pp. 349-372. Marcel Dekker, Inc., New York. Rae A.L., Cybinski D.H., Jarmey J.M., and Smith
F.W.2003. Characterization of two phosphate transporters from barley; evidence for diverse function and kinetic properties among members of the Pht1
family. 53: 27-36.
Schachtman D.P., Reid R.J., and Ayling S.M. 1998. Phosphorus uptake by plants: from soil to
Plant Cell
Dunaliella salina Basic Microbiol
Plant Physiol.
Comparative Salt Tolerance of Ornamental Trees and Shrubs for Victorian Field Planting
Arabidopsis thaliana Proc. Natl. Acad. Sci. USA
Proc. Natl. Acad. Sci. USA
Plant Physiol.
Plant Responses to Environmental Stresses: from Phytohormones to Genome Reorganization
Plant Mol. Biol.
. . .
.
-Smith F.W., Ealing P.M., Dong B. and Delhaize E. 1997. The cloning of two Arabidopsis