Volume 3, Number 2, 2018, pp. 184-193 Journal Homepage: www.jitecs.ub.ac.id
Usability Testing on Android Application of Infrastructure
and Facility Reporting Management Information System
Satrio Agung Wicaksono1, Danniar Reza Firdausy2, Mochamad Chandra Saputra3
Faculty of Computer Science, Brawijaya University, Malang, East Java, Indonesia
1
[email protected], [email protected], [email protected]
Received 06 September 2018; accepted 05 November 2018
Abstract. The decline in quality that has been caused by daily usage of facilities and infrastructure owned by an organization will certainly disrupt its function in supporting the performance of the organization. The solution that came from the research that has been conducted before is to develop android applications called Infiremis (Infrastructure and Facility Reporting Management Information System), that can be used to report the damage of the infrastructure facilities and to track its reporting status. This android application developed to be used by students, lecturers and staff of Faculty of Computer Science Brawijaya University where those users have different background personas. Therefore, the usability of this android application need to be tested to find out the value of effectiveness, efficiency and satisfaction of the application to fulfill its purpose. This research was conducted mainly to discover the result of usability testing towards the android application of infrastructure and facility reporting management information system. Based on the Usability Testing, it shows that the level of effectiveness and satisfaction of Infiremis respectively is 97.14% and 89.7%, whereas for the efficiency score is 89.9%.
1
Introduction
Nowadays, academic community of a faculty from a university, as a party who uses infrastructure and also as a party who often founds complaints about infrastructure, prefer a means to report their complaints through a medium that is practical and easy to use. Those medium that can facilitate academic community to report their complaints they found about infrastructure facilities is in the form of reporting system that developed on a mobile platform. As explained by Tolle, et al [1], the advantages from a mobile applications is that they provide better portability and control for the user. In addition, development of a system using mobile platforms particularly based on android application is that considering this platform is able to provide better performance and functionality related to direct access to hardware from the device [2]. Those access to hardware can consist of access to the mobile device’s camera feature as well as its ability to scan a QR code.
Satrio Agung Wicaksono et al. , Usability Testing on Android Application ... 185
provided are to track on going reports, reports timeline and also reports history. Meanwhile, users of Infiremis itself consists of several types of users, which are consists of students, lecturers and staffs of the Faculty of Computer Science Brawijaya University. These users came from various persona and demographic backgrounds. This can affect the ability of each user in completing functions provided by the infrastructure facility reporting application, which in Infiremis these functions are related to infrastructure facility complaint reporting and reporting status tracking function. In addition, as for how fast and how easy it is for users to complete those functions when using the application can also be used as a success level indicator of the proposed system. Therefore, a test to measure the usability level of the proposed system needs to be done to ensure that the developed android application can function properly according to its purpose without frustating its user.
Based on those issues, this study is focused on doing usability testing that involves respondents from students, lecturers and staffs of Faculty of Computer Science Brawijaya University by giving them several task scenarios that they have to complete. The purpose of this research is to find out the results of the user success level in completing the task given, the time required by the user to complete those tasks and the user satisfaction level of Infiremis. This paper is organized in 5 sections where section 2 explains about literature study of the mobile application platform and usability testing being discussed. Section 3 explains about the research methodology. Section 4 presents the testing result and data analysis while Section 5 gives conclusion of the testing study that has been conducted.
2
Literature Study
2.1 Android Application
Android Application is a mobile application software that is installed and run on Android platform operating system. As a software application that is designed specifically for mobile device, mobile application development on Android platform is able to provide several advantages to users, which is an increase in usability performance and access availability to hardware functionality from the device being used [1].
Studies show that the use of native applications is by far still the best choice for the development of an application that use hardware intensively. Moreover, the results of the study also show that the performance of using software application on web platforms or applications running in the browser runtime environment still cannot outperform native mobile applications. Related to the results that have been stated above, native mobile applications allow developers to develop reliable features for users so that they can use the camera and to scan QR Codes.
2.2 Usability Testing
more content into a smaller screen real estate while the users itself sometimes cannot clearly define their interface needs. Hence, it requires a more delicate and user-based approach so that usability design flaws can be identified at an early stage. In conducting usability testing, among several metrics that can be used to measure results quantitatively and then determine the level of usability of the software being tested, the ISO 9241 standard recommends that the metrics of usability must include effectiveness, efficiency and satisfaction [4]. This approach gives benefit that related directly to the user and business requirements which effectiveness means success measurement in achieving predetermined goals, efficiency means avoiding time being wasted while attempting to achieve the goals and satisfaction means measuring the willingness to use the system [5].
Effectiveness discusses about the level of accuracy and completeness obtained from users to complete certain tasks and can be obtained by measuring completeness level [6]. The completeness level itself captured and represented using binary value ‘1’ if representative user or participant succeeds in completing a task and ‘0’ if they fail to complete it within a certain time limit. While a “good” completion rate depends on the context of testing being carried out, according to study carried out by Jeff Sauro, the average effectiveness rate is 78% from an analysis of almost 1200 usability task being tested [7].
Effectiveness = !"#$%& !" !"#$ !"#$%&'&(
!"#$% !"#$%& !" !"#$ !!!"#$ !" !"#$×100% (1)
Efficiency discusses about time resources spent by user in order to ensure the level of accuracy and completeness achievement of the goals that can be represented in seconds or minutes [6], which are needed in relation to the accuracy and completeness of the participant to complete or fail to complete a certain task. This metrics can be calculated by measuring overall relative efficiency (ORE), which uses the ratio of the time taken by the users who successfully completed the task in relation to the total time taken by all users and can be represented using percentage obtained by using these formula.
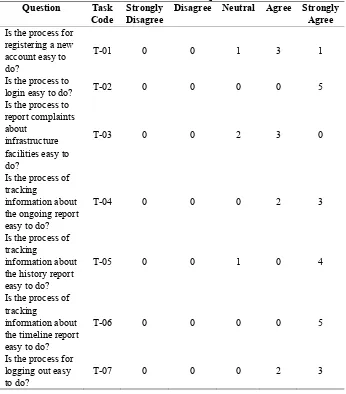
Satisfaction discusses about convenient, comfort and acceptance level of the participant as a user to use a device or system and the relevance of application [6]. Satisfaction itself can be measured by using standardized satisfaction questionnaire that is given after the testing session ends. Single Ease Question (SEQ), which is a question that ask users about how difficult or easy it is to complete each task given, is used in the satisfaction questionnaire and then answered using Likert Scale points. Then, satisfaction level can be obtained by analyzing the result of the Likert Scale points [4].
2.3 Likert Scale
Satrio Agung Wicaksono et al. , Usability Testing on Android Application ... 187
Disagree” on one end then “Strongly Agree” on the other end and then “Neutral” in the middle, as depicted on Fig.1 . Each level of scale is given a numerical value wich starts from 1 and is added one for each level.
Fig. 1 Likert scale example
Calculating the results of the Likert Scale begins by giving the score weight to each answer, which “Strongly Agree” is given a score of 5, “Agree” is given a score of 4, “Neutral” is given a score of 3, “Disagree” is given a score of 2 and score 1 is given to “Strongly Disagree”. Next is to multiply the number of answers from participants who answer on each answer scale point with the answers score weight to obtain total answered score.
Total Answered Score = (n × 5) + (n × 4) + (n × 3) + (n × 2) + (n × 1) (3) Then, calculation continued with defining maximum score of the scale and then eventually calculating the index score by means of dividing total answered score by the maximum score that previously has been defined and then multiply it with 100%.
Index Score % = !"#$%!"#$%&% !"#$%&%' !"#$%
!"#$% 𝑥 100% (4)
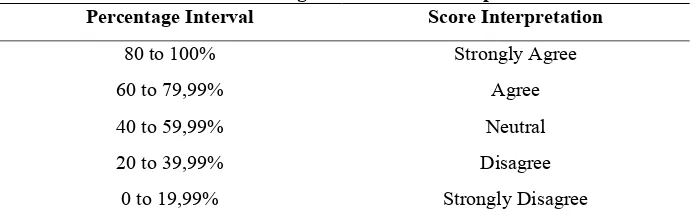
After the percentage of index score has been obtained then that score can be compared with defined percentage interval as explained on Table 1 to interpret the index score meaning, which in this case the level of participants satisfaction in the usability testing context that is being carried out.
Table 1. Percentage interval score interpretation
Percentage Interval Score Interpretation
80 to 100% Strongly Agree
60 to 79,99% Agree
40 to 59,99% Neutral
20 to 39,99% Disagree
0 to 19,99% Strongly Disagree
3 Methodology
3.1 Research Methodology
infrastructure facilities at the Brawijaya University Faculty of Computer Science, the testing environment prepared is in the form of infrastructure facility as an object to be reported and an android application being tested that has been installed on android device.
Fig. 2 Usability Testing Guideline [9]
The next step is to find and select 5 participants that consist of 3 students and 2 lecturers from the Faculty of Computer Science. This decision to involve slightly larger participants sampling proportion taken from the students in comparison to the proportion of the lecturers is because the students make the largest contribution to the amount of population of the academic community of Faculty of Computer Science compared to the rest of the cluster. The students and lecturers who are being selected as participants were academic community who had previously reported complaints of infrastructure facilities through methods other than using the developed system being tested.
Moving on from the participants selection, the preparation continued with preparing test materials by giving briefings to participants about the usability testing that is being conducted so that they can carry out testing sessions based on the defined test scenario. After the participants comprehend the scenario that must be carried out, the test can be held. During the test, the performance of the participant tasks completion and the data of their tasks completion time was recorded thoroughly so that when the participants had finished all of their task the next steps to give questionnaires to the participants regarding their satisfaction and the usability test results data analysis from android application can be done. The process of analyzing data from the testing results is conducted to meet the metrics for measuring effectiveness, efficiency and satisfaction as defined by the ISO 9241 standard. In the end is to report the results of the analysis that has been carried out and provide recommendations on flaws that have been found from the infrastructure facility reporting android application.
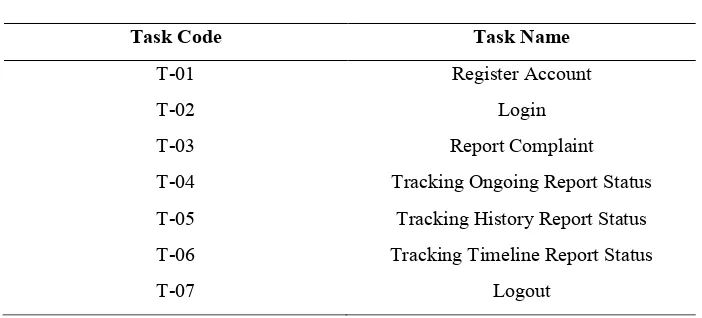
3.2 Test Scenario
As explained in the previous section before testing can be carried out, the test scenario explaining about the task that the participants should complete, have to be described first. The test case being made is explained in a table and the task that should be done are described by the task code followed by its task name. The task code are represented with T-xx, which “T” is a abbreviation of Task and “xx” is a abbreviation of the task numbering. The test case table mentioned is explained on Table 2 as follows.
Satrio Agung Wicaksono et al. , Usability Testing on Android Application ... 189
Task Code Task Name
T-01 Register Account
T-02 Login
T-03 Report Complaint
T-04 Tracking Ongoing Report Status
T-05 Tracking History Report Status
T-06 Tracking Timeline Report Status
T-07 Logout
From Table 2 it is stated that the task code T-04 represents task to do Tracking Ongoing Report Status, which is to track the reporting status of the complaint that being worked on. Then task code T-05 represent task to do Tracking History Report Status, which is to track the reporting status of the finished or rejected complaint report. While task code T-06 is to track all of the complaint that have been reported by all of the user, wether it is still being worked on or that is already finished or even rejected.
3.3 Testing Result
In order to do the usability test result data analysis, the testing result itself needs to be recorded thoroughly first. From the test, it is obtained result data in the form of participants tasks completion and their tasks completion time. Furthermore, data regarding the satisfaction of the participants in completing all of the task given when using the android application is also obtained from the questionnaire that was given after they finished all of the task. The following Table 3 explains about the result of 5 participants tasks completion represented in binary value.
Table 3. Task Completion Result
Participant T-01 T-02 T-03 T-04 T-05 T-06 T-07
A 1 1 1 1 1 1 1
B 1 1 1 1 1 1 1
C 1 1 1 1 1 1 1
D 1 1 0 1 1 1 1
E 1 1 1 1 1 1 1
Related to Task Completion Result table that is explained on Table 3, result data regarding the participants task completion time represented in seconds is explained on the following Table 4.
Table 4. Task Completion Time
Participant T-01 T-02 T-03 T-04 T-05 T-06 T-07
A 76 15 53 4 2 2 3
B 95 12 55 6 4 3 2
C 97 14 68 6 3 3 2
E 109 19 79 9 8 5 4
Satrio Agung Wicaksono et al. , Usability Testing on Android Application ... 191
shown on following calculation.
Effectiveness = 34/35×100% = 97,14%
From the calculation is obtained that the point of effectiveness reaches 97,14%, which are already above the average of the average effectiveness rate. According to the result of the task completeness, task number T-03 failed to be completed by participant D because that task to report the complaint requires the user to press the submit button which is just above the home or back button of the Android navigation bar. This makes the user prone to mispress the submit button and exiting the application or back to previous page resetting the already filled out complaint report forms instead. Even though, considering the low error rate caused by mispressed button, this problem can be easily addressed by changing the icon and rearrange the placement of the submit button so that it does not placed closely above the home button or back button of the navigation bar.
Meanwhile for the second analysis that can be done based on the participants tasks completion time result is the efficiency measurement. From the Task Completion Time table that is explained on Table 4, it is obtained that the efficiency level are shown on following overall relative efficiency (ORE) calculation.
Task Completion Time Respondent A = 76+15+53+4+2+2+3 = 155
Task Completion Time Respondent B = 95+12+55+6+4+3+2 = 177
Task Completion Time Respondent C = 97+14+68+6+3+3+2 = 193
Task Completion Time Respondent D = 75+10+0+3+2+4+2 = 96
Task Completion Time Respondent E = 109+19+79+9+8+5+4 = 233
Overall Relative Efficiency = !""!!""!!"#!!"!!""
!""!!""!!"#!!"!!!"" ×100%
= !"#
!"!× 100% = 89,9%
TotalScore = (21 × 5) + (10 × 4) + (4 × 3) + (0 × 2) + (0 × 1) = 105 + 40 + 12 + 0 + 0
= 157
After the total score is obtained then index score percentage can be calculated by dividing it with the maximum score. From the result of the following index score percentage calculation, if it is compared to percentage interval as explained on Table 1, it can be interpreted that the participants strongly agree that the system are easy to use.
Index Score Percentage = !"#!"#× 100% = 89,7%
5 Conclusions and Suggestions
Infiremis as an android application can be used quite effortlessly by Faculty of
Computer Brawijaya University academic community as a means to report
infrastructure and facility complaints found around Faculty of Computer Science.
Based on the conducted usability testing, Infiremis is being considered above the
average by achieving 97.14% in terms of effectiveness metrics and 89.9% in terms of
efficiency metrics. In addition, the representation of the users also strongly agree that
the system is easy to use which is based on the satisfaction metric result by achieving
89.7% and then followed by interpreting that satisfaction result.
This research or other research with similar case and similar usability testing
method can be improved by utilizing a more comprehensive satisfaction questionnaire
such as, but not limited to, System Usability Scale (SUS) or Questionnaire for User
Interaction Satisfaction (QUIS) for measuring test-level satisfaction metric. In
addition, effectiveness and efficiency result can also further utilized as a
benchmarking tool if those methods are being used to compare 2 different version of a
system or another system with the same purpose.
References
1. Tolle, H., Pinandito, A., Dewi, R. K. & Putra, A. K.:Pengembangan Aplikasi Perangkat Bergerak. UBPress, Malang (2017)
2. Jobe, W.:Native Apps vs. Mobile Web Apps. International Journal of Interactive Mobile Technologies (iJIM). 7, 27-32 (2013)
3. Lazar, J., Feng, J. H. & Hochheiser, H.: Research Methods in Human-Computer Interaction 2nd Edition. Morgan Kaufmann, Cambridge (2017)
4. Mifsud, J.: UsabilityGeek Usability Metrics a Guide to Quantify System Usability, https://usabilitygeek.com/usability-metrics-a-guide-to-quantify-system-usability/ (2015) 5. Bevan, N., Carter, J., Harker, S.: ISO 9241-11 revised: What have we learnt about usability
since 1998?. Human-Computer Interaction, Part 1, HCII. Springer, Berlin (2015)
6. Singun, A. P.: Usability Metrics for a Web-Based Test Blueprint System. Journal of Engineering and Applied Sciences, 12: 6898-6903. Medwell Journals, Faisalabad (2017) 7. Sauro, J.: MeasuringU What Is A Good Task-Completion Rate?,
Satrio Agung Wicaksono et al. , Usability Testing on Android Application ... 193
8. Bertram, D.: Likert Scale. (2016)
![Fig. 2 Usability Testing Guideline [9]](https://thumb-ap.123doks.com/thumbv2/123dok/3596697.1788407/5.612.161.452.161.262/fig-usability-testing-guideline.webp)