A Comparative Study on Term Weighting Schemes
for Text Categorization
Man LAN
†‡, Sam-Yuan SUNG
†, Hwee-Boon LOW
‡, Chew-Lim TAN
† †Department of Computer Science, School of Computing, National University of Singapore3 Science Drive 2, Singapore 117543 E-mail:{lanman, ssung, tancl}@comp.nus.edu.sg
‡Institute for Infocomm Research
21 Heng Mui Keng Terrace, Singapore 119613 E-mail:{lanman, hweeboon}@i2r.a-star.edu.sg
Abstract— The term weighting scheme, which is used to convert the documents to vectors in the term space, is a vital step in automatic text categorization. The previous studies showed that term weighting schemes dominate the performance rather than the kernel functions of SVMs for the text categorization task. In this paper, we conducted experiments to compare various term weighting schemes with SVM on two widely-used benchmark data sets. We also presented a new term weighting schemetf.rffor text categorization. The cross-scheme comparison was performed by using McNemar’s Tests. The controlled experimental results showed that the newly proposed tf.rf scheme is significantly better than other term weighting schemes. Compared with schemes related with tf factor alone, the idf factor does not improve or even decrease the term’s discriminating power for text categorization. The binary and tf.chirepresentations significantly underperform the other term weighting schemes.
I. INTRODUCTION
Text categorization, the task of automatically assigning unlabelled documents into predefined categories, has been widely studied in the recent decades. Usually, the content of a textual document is transformed into a vector in the term space by using the bag-of-words approach, dj = (w1j, ..., wkj),
where k is the set of terms (sometimes called features). The value of wkj between (0,1) represents how much the term
tk contributes to the semantics of document dj. The
bag-of-words approach is simple as it ignores semantic and syntactic information, but it performs well in practice.
The promising classifiers applied to text categorization are usually borrowed from the traditional machine learning field. Among them, support vector machines (SVM) are one of the most successful solutions [8], [9]. Many researchers have studied text categorization based on different term weighting schemes and different kernel functions of SVMs [8], [9], [1], [4]. In [1], the authors pointed out that it is the text representation schemes which dominate the performance of text categorization rather than the kernel functions of SVM. That is, choosing an appropriate term weighting scheme is more important than choosing and tuning kernel functions of SVM for text categorization.
However, even given these previous studies, we can not definitely draw a conclusion as to which term weighting
scheme is better than others for SVM-based text categoriza-tion, ”Because we have to bear in mind that comparisons are reliable only when based on experiments performed by the same author under carefully controlled conditions” [16]. In this case, various ”background conditions” [16] such as, different data preparation (stemming, stop words removal, feature selection, different term weighting schemes), different benchmark data collections, different classifiers with various parameters, and even different evaluation methods (micro- and macro-averaged precision, recall, accuracy, error, break-even point or ROC) have been adopted by different researchers.
For this purpose, our paper focuses on the comparison of various term weighting schemes only. That is, we only change the term weighting schemes by using the bag-of-words approach, while the remaining background conditions such as, data preparation, classifier and evaluation measures remain unchanged. Specifically, our benchmark adopted the linear SVM algorithm. The reasons why we choose linear kernel function of SVM in our experiments are listed in Section II-E. Consequently, after building such a fixed universal platform, these comparative experiments made on it are reliable. In addition, we used the McNemar’s tests [7] to validate if there is significant difference between two term weighting schemes with respect to the micro-averaged break-even point performance analysis.
This paper is structured as follows. Section II reviews related works and analyzes the term’s discriminating power for text categorization. Section III describes the comparative experiments, discussions and results. Conclusions are drawn in Section IV.
II. RELATEDWORKS
In this section, we adopt a tabular representation similar to [15]. A number of term weighting factors are listed in these tables and each term weighting scheme consists of three factors, term frequency, collection frequency, and length normalization components.
A. Term Frequency Factor
TABLE I
TERM FREQUENCY COMPONENT
1.0 Binary weight equal to 1 for terms present in a vector (term frequency is ignored)
tf Raw term frequency (number of times a term occurs in a document)
1 +log(tf) Logarithm of the term frequency to scale the effect of unfavorably high term frequency
1− r
r+tf Inverse term frequency (ITF), usuallyr= 1
TABLE II
COLLECTION FREQUENCY COMPONENT
1.0 No change in weight; use original term frequency component
log(niN) Multiply original tf factor by an inverse collection frequency factor (N is the total number of documents in collection, andni is the number of documents to which a term is assigned)
log(N−ni
ni ) Multiply tf factor by a term relevance weight (i.e. probabilistic inverse document frequency)
χ2 Multiply χ2 value of each term in each category
log(1 +nini −
) Our newly proposed factor (niis the same as above, andni−is the number of
docu-ments which contain the term and belong to the negative categories)
normal raw term frequency, a logarithm of term frequency and a inverse term frequency. Among them, binary representation is the most simplest scheme and has been used in certain machine learning algorithms such as Naive Bayes, decision tree, where floating number format of term frequency might not be used. The normal raw term frequency has been widely used. The logarithm operation is used to scale the effect of unfavorably high term frequency in one document. Inspired by the inverse document frequency, ITF (inverse term frequency) was presented by [1].
B. Collection Frequency Factor
Five different collection frequency components are defined in Table II, which represent multipliers of 1 that ignores the collection frequency factor, a conventional inverse collection frequency factor (idf), a probabilistic inverse collection fre-quency (idf−prob), a χ2
factor (χ2
), and a new relevance frequency (rf) factor proposed by us which considers the relevant document distribution, respectively.
It is clear to note that for multi-label classification problem, the benchmark on each corpus was simplified into multiple binary classification experiments. That is, in each experiment, a chosen category was tagged as the positive category and the other categories in the same corpus were combined as the negative category.
The traditional idf component which was thought to im-prove the term’s discriminating power by pulling out the relevant documents from the irrelevant documents was
bor-rowed from the information retrieval domain. However, in text categorization domain, things might be a bit different. Let’s consider the examples in Figure 1.
Fig. 1. Comparison of different distribution of documents which contain the six terms in the collection
Figure 1 shows the distribution of documents which contain the six terms, t1, t2, t3, t4, t5 and t6 in one chosen positive category. The heights of the columns above and below the horizontal line denote the number of documents in the positive and negative categories respectively. The height of the shaded part is the number of documents which contain this term. We assume the six terms have the same term frequency (tf). Then the several collection frequency factors are defined as
idf=log( N
b+c) (1)
idf−prob=log(a+d
b+c) (2)
χ2
=N∗ (a∗d−b∗c) 2
(a+d)(b+c)(a+b)(c+d) (3)
rf =log(2 +b
c) (4)
where N=a+b+c+d. In general,d >> a, b, c.
The first three terms have the sameidf1 and the last three terms share the same idf2. It is clear to find that idf2 is less than idf1. Thus, the traditional idf factor gives more weighting to the first three terms than the last three terms. But when we look at the first three terms only, we can easily find that these three terms show different discriminating power to text categorization.t1andt3contribute more power to discriminate the documents in the positive and negative categories respectively but t2 gives little contribution to this categorization. Therefore, the traditionaltf.idf representation scheme might lose its ability to discriminate these positive documents from the negative ones with respect to the first three terms. Things are similar for the last three terms. Based on this analysis, we proposed a new factorrelevance frequency rf to improve the term’s discriminating power. We assigned the constant value 2 in the rf formula because the base of this logarithm operation is 2. Compared with the first three collection frequency factors, therf factor does not involve the
dominates the results of the first three formulae, it depresses the significant effects of b andc to appropriately express the term’s discriminating power for text categorization. That is the reason why we developed the rf factor which omits the
dvalue and appropriately improves the effects ofb andc. Therefore, in the above case, we weight more to t1 than
t2 and t3 since t1 contributes more to the positive category by using rf factor. Similarly, t4 is weighted more than t5 and t6 by adopting our new factor. The reason why we give more weight to the terms which are assigned more in the positive documents than in the negative ones is that the terms in the negative category are widely dispersed due to the various topics of the negative category while the terms in the positive category are more concentrated on the topic of the positive category. We will validate whether this newly proposed factor
rf has more discriminating power thanidf factor in the later experiments.
Besides these collection frequency factors, other compli-cated factors combined with feature selection metrics, such as Odds Ratio, information gain, χ2
, gain ratio have been presented [6], [5]. In [13], the authors postulated that it is the sophistication of the feature weighting method rather than its apparent compatibility with the learning algorithm that improves classification performance. In [6], the authors asserted thattf∗CHI is most effective in their experiments with a SVMs-based text categorization rather than tf.idf. Since these schemes have been seldom compared and have not been shown universally encouraging results up to date, we also include one χ2
factor as a typical representative in our experiments.
C. Normalization Factor
To eliminate the length effect, we use the cosine nor-malization to limit the term weighting range within (0,1). Specially, the binary feature representation does not use any normalization since the original value is0or1. Assuming that
wkjrepresents the weight of termtkin documentdj, the final
term weight wkj might then be defined aswkj/
q P
k(w
2
kj).
D. Combined Term Weighting Schemes
By variously combining the three components, we compared the following ten term weighting schemes listed in Table III. Most of these term weighting schemes have been widely used in information retrieval and text categorization and/or have shown good performance in practice [15], [2], [8], [9]. For example, IT F representation proposed by [1] is included because the experimental results showed that when combined with linear kernel of SVM it needs the minimum of support vectors (i.e. best generalization).
Actually, the first four term weighting schemes are different variants oftf factor. Then the next four schemes are different variants of the traditional tf.idf scheme. The tf.chi scheme is a typical representation which combines tf factor with one feature selection metric (here is χ2
). The last weighting representation is our newly proposed scheme based on the analysis of term’s discriminating power in Section II-B.
TABLE III
SUMMARY OF VARIOUS TERM WEIGHTING SCHEMES
Name Description
binary binary feature representation
tf tfonly
logtf log(1 +tf)
IT F 1−1/(1 +tf)
idf idfonly
tf.idf traditionaltf.idf logtf.idf log(1 +tf).idf
tf.idf-prob probabilistic idf, actually is the approximate
tf.term relevance
tf.chi tf.χ2
tf.rf tf.relevance frequency is our new weighting scheme
Noted that other weighting schemes may exist, but these ten term weighting schemes were chosen due to their reported superior classification results or their typical representation when using support vector machines.
E. Support Vector Machines for Text Categorization
The promising approaches to text categorization tasks were usually borrowed from traditional machine learning algo-rithms, such as kNN, decision tree, Naive Bayes, Neural Network, Linear Regression, Support Vector Machines, and Boosting, etc. Among them, support vector machines (SVM) are one of the most successful solutions [8], [9]. In general, SVMs have been classified into three categories based on three different kernel functions, namely, linear, polynomial and radial based function (RBF).
Specifically, our benchmark adopted the linear SVM rather than non-linear SVM. The reason why we chose linear kernel function of SVM in our experiments are listed as follows. First, linear SVM is simple and fast [8]. Second, our preliminary experimental results showed that the linear SVM performs better than the non-linear models, even at the preliminary optimal tuning level the accuracy achieved with RBF kernel is lower than that of linear (0.8 vs 0.9). This result contradicts our anticipation of better performance by a more sophisticated kernel when dealing with numerous dimensional features but it also corroborates with the findings in [18], [8]. Third, this result might be considered preliminary, but our current focus is on the comparison of term weighting schemes rather than how to tune the parameters of kernel functions. Following the established practice in text categorization, throughout this paper we used an SVM with a linear kernel as the benchmark classifier algorithm. The SVM software we used is LIBSVM-2.6 [3].
III. COMPARATIVEEXPERIMENTS A. Performance Measures
Classification effectiveness is usually measured by using
TABLE IV
MCNEMAR’S TEST CONTINGENCY TABLE
n00: Number of examples misclassified by both classi-fiersfA andfB
n01: Number of examples misclassified byfA but not byfB
n10:Number of examples misclassified by classifiers
fBbut not byfA
n11: Number of examples misclassified by neither fA norfB
Our experiments adopted the precision/recall break-even point as a measure of performance, which is defined as the value where recall equals to precision. To get a single
break-even point value over all binary classification tasks, the learning task is repeated for various values of these parameters and yield the hypothetical point at whichprecisionandrecall
are equal. When working with linear kernel function of support vector machines, we set one global penalty costs of error on the positive and negative examples in the whole corpus to obtain this break-even point.
B. Significance Tests
To compare the performance between two term weighting schemes, we employed the McNemar’s significance tests [7] based on the micro-averaged precision/recallbreak-even point. McNemar’s test is aχ 2-based significance test for goodness of fit that compares the distribution of counts expected under the null hypothesis to the observed counts. The McNemar’s test can be summarized as follow.
Two classifiers fA and fB based on two different term
weighting schemes were performed on the test set. For each example in test set, we recorded how it was classified and constructed the following contingency table (Table IV):
The null hypothesis for the significance test states that on the test set, two classifiers fA and fB will have the same
error rate, which means thatn10 =n01. Then the statisticχ
is defined as
χ=(|n01−n10| −1)
2
n01 +n10 (5)
where n01andn10are defined in Table IV.
Dietterich showed that under the null hypothesis, χ is approximately distributed as χ2
distribution with 1 degree of freedom, where the significance levels 0.01 and 0.001 corresponded to the two thresholds χ0 = 6.64 and χ1 =
10.83 respectively. Given a χ score computed based on the performance of a pair of classifiersfAandfB, we comparedχ
with threshold valuesχ0andχ1to determine iffAis superior
tofB at significance levels of 0.01and0.001respectively. If
the null hypothesis is correct, then the probability that this quantity is greater than 6.64is less than 0.01. Otherwise we may reject the null hypothesis in favor of the hypothesis that the two term weighting schemes have different performance when trained on the particular training set.
C. Data Sets
1) Reuters News Corpus: The documents from the top ten largest categories of the Reuters-21578 document collection
were used in our experiments. We adopted the bag-of-words approach for the documents. According to the ModApte split, the 9,980 news stories have been partitioned into a training set of 7,193 documents and a test set of 2,787 documents. Stop words (292 stop words), punctuation and numbers were removed. The Porter’s stemming was performed to reduce words to their base forms [14]. The threshold of the minimal term length is 4. Null vectors (i.e. vectors with all attributes valued 0) were removed from the data set. The resulting vocabulary has15937 words (terms or features).
By using theχ2
statistics ranking metric for feature selec-tion, the top p features per category were selected from the training sets. In our experiments, we setp={25,50,75,150, 300, 600, 900, 1200, 1800, 2400} respectively. Since SVM have the capability to deal with high dimensional features, and the previous works showed that feature selection does not improve or even slightly degrades the SVM performance [1], [12], we also conducted experiments by inputting the full words (after remove stop words, stemming and set minimal term length as4) without feature selection.
One noticeable issue of Reuters corpus is the skewed cate-gory distribution problem. Among the top ten categories which have 7193 training documents, the most common category has a training set frequency of 2877 (40%), but 80% of the categories have less than7.5%instances.
2) 20Newsgroups Corpus: The 20 Newsgroups corpus is a collection of approximate 20,000 newsgroup documents evenly divided among 20 discussion groups and each docu-ment is labelled as one of the20categories which correspond to the name of the newsgroup that the document was posted to.
Due to the huge number of documents in this corpus to be dealt with, we randomly selected the first200training samples and the first100testing samples per category. On a chosen cat-egory,200positive training samples and3800negative training samples evenly distributed in the other19categories were used by the classifiers. Our experiments compared the different term weighting schemes’ performance based on the fixed number of training/testing sets. Compared with the skewed category distribution in the Reuters corpus, the20categories in the20 Newsgroups corpus are uniform distribution.
The resulting vocabulary, after removing stop words (513 stop words) and these words that occur less than 3 and 6 times in the positive and negative categories respectively, has 50088 words. According to the χ2
statistics metric, the top
p features were selected as feature sets, where p belongs to
{5,25,50,75,100,150,200,250,300,400,500}.
D. Results
point at the full vocabulary. Among these, the best break-even point0.9272was reached at the full vocabulary by using our newly proposed schemetf.rf. Thetf.rf scheme has always been shown significant better performance than others when the number of features is larger than 5000. The following significance tests results supported this observation.
Fig. 2. Micro-averaged break-even points results for the Reuters-21578 top ten categories by using ten term weighting schemes at different numbers of features
Table V summarizes the statistical significance tests results on the Reuters data set at different numbers of features, where the term weighting schemes with insignificant performance differences are grouped into one set, ”<” and ”<<” denotes worse than at significance level0.01and0.001 respectively.
TABLE V
STATISTICAL SIGNIFICANCE TESTS RESULTS ONREUTERS-21578AT
DIFFERENT NUMBERS OF FEATURES. ”<”AND”<<”DENOTES WORSE
THAN AT SIGNIFICANCE LEVEL0.01AND0.001RESPECTIVELY; ”{}”
DENOTES NO SIGNIFICANT DIFFERENCE IN THE SET.
# Features McNemar’s Test
200 {tf.chi}<<{all the others}
400−1500 {binary,tf.chi}<<{all the others}
2500 {binary, tf.chi} << {idf, tf.idf,
tf.idf-prob}<{all the others}
5000-All {binary, idf, tf.chi} << {tf.idf,
logtf.idf, tf.idf-prob} << {tf, logtf,
IT F}<{tf.rf}
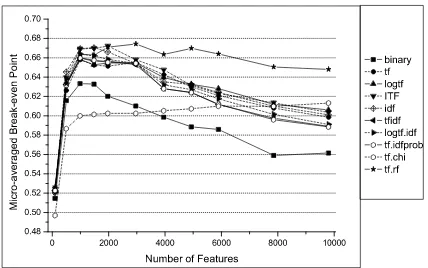
Figure 3 shows the micro-averaged break-even point results on the 20 Newsgroups data set. Unlike the trends on the Reuters data set, the performance curves on the 20 News-groups were not monotonically increasing. All term weighting schemes reached their maximum break-even point at a small vocabulary range from 1000 to 3000. The best break-even point0.6743was also achieved by using our newly proposed schemetf.rf at a vocabulary size of3000.
Table VI summarizes the statistical significance tests results on the 20 Newsgroups data set at different numbers of fea-tures, where the term weighting schemes with insignificant performance differences are grouped into one set, ”<” and ”<<” denotes worse than at significance level0.01and0.001 respectively.
Fig. 3. Micro-averaged break-even points results for the 20Newsgroups corpus by using ten term weighting schemes at different numbers of features
TABLE VI
STATISTICAL SIGNIFICANCE TESTS RESULTS ON THE20NEWSGROUPS AT
DIFFERENT NUMBERS OF FEATURES. ”<”AND”<<”DENOTES WORSE
THAN AT SIGNIFICANCE LEVEL0.01AND0.001RESPECTIVELY; ”{}”
DENOTES NO SIGNIFICANT DIFFERENCE IN THE SET.
# Features McNemar’s Test Result
100−500 {tf.chi}<<{all the others}
1000 {tf.chi}<<{binary}<<{all the oth-ers}
1500 {tf.chi}<<{binary}<{all the others}
<{IT F,idf,tf.rf}
2000 {binary,tf.chi} <<{all the others} <
{IT F,tf.rf}
3000−5000 {binary,tf.chi} <<{all the others} <
{tf.rf}
6000−10000 {binary} << {all the others} <<
{tf.rf}
E. Discussion
To achieve high performance in terms with break-even point, different numbers of vocabularies were required for the two data sets. The categories in the Reuters data set often consist of diverse subject matters which involve overlapping vocabularies. For example, the documents in the same acqui-sitioncategory may involve diverse subjects about acquisition. In this case, large vocabularies are required for adequate classification performance. Hence, for the Reuters data set, the full vocabulary are required to achieve the best break-even point. However, in the20Newsgroups data set, all documents in a category are about a single narrow subject with limited vocabulary. Thus, 50 −100 vocabularies per category are sufficient for best performance for the 20 Newsgroups data set.
Even though the best performances were reached at different numbers of vocabularies, these term weighting schemes have been shown consistent performance compared with others on the two different data sets.
This result also verifies our analysis in Section II-B that the relevancef requency improves the term’s discriminating power for text categorization.
Secondly, there was no observation thatidffactor adds dis-criminating power when combined with tf factor together. In the Reuters data set, the three term weighting schemes related with term frequency alone,tf,logtfandIT Fachieved higher break-even points than these schemes combined withidf fac-tor, tf.idf,logtf.idf andtf.idf-prob. In the 20 Newsgroups data set, the differences between these schemes related with
tf alone or withidf or both were not significant. This result shows that the idf factor gives no discriminating power or even decrease discriminating power to the features.
Thirdly, compared with other schemes, the binary and
tf.chi scheme showed consistently worse performance even when they achieved the best break-even point performance. The binary weighting scheme ignores the information of term frequency which is crucial to the representation of the content of the document. This might be the reason why these schemes related with term frequency show drastically better performance than binary scheme. The tf.chi scheme, as a representative of term weighting schemes combined with feature selection measure, although taking the collection dis-tribution into consideration, showed even worse performance than binary representation at a small vocabulary size in the two data sets. As we analyzed in Section II-B, the d value dominates theχ2
value and the resulting term weighting value can not express the term’s discriminating power as appropriate as thetf.rf. Althoughtf.chishowed slow increasing trend in the 20 Newsgroups data set and got the higher performance at larger number of vocabularies, its best break-even point per-formance was still worse than that of the others. Specifically, the tf.χ2
scheme has been showed no significant different or even worse performance than the tf.idf scheme. This finding contradicts with the previous result in [6].
Generally, theIT F scheme has comparable as good perfor-mance in the two data sets as other schemes related with term frequency alone, such as tf and logtf factor, but still worse than the tf.rf scheme.
It is clearly to know that all the observations are supported by the following McNemar’s significance tests.
IV. CONCLUSIONS
In this paper we reported a comparative study on several widely-used term weighting schemes with SVM-based text categorization and also proposed a newly term weighting scheme tf.rf based on the analysis of discriminating power. With respect to the micro-averaged break-even point perfor-mance analysis, our conclusions are:
• Our newly proposed term weighting schemetf.rf shows significant better performance than other schemes based on two widely-used data sets with different category distributions
• The schemes related with term frequency alone, such as tf,logtf, IT F show rather good performance but still worse than the tf.rf scheme
• The idf andχ2 factor, taking the collection distribution into consideration, do not improve or even decrease the term’s discriminating power for text categorization • The binary andtf.chi representations significantly
un-derperform the other term weighting schemes
REFERENCES
[1] E. Leopold and J. Kindermann. Text categorization with support vector machines. how to represent texts in input space?. Machine Learning, 46(1-3):423 – 444, January - February - March 2002.
[2] C. Buckley, G. Salton, J. Allan, and A. Singhal. Automatic query expansion using SMART: TREC-3. InText REtrieval Conference, 1994. [3] C.-C. Chang and C.-J. Lin. LIBSVM: a library for support vector machines, 2001. Software available at
http://www.csie.ntu.edu.tw/˜cjlin/libsvm.
[4] P. Dai, U. Iurgel, and G. Rigoll. A novel feature combination approach for spoken document classification with support vector machines. 2003. [5] F. Debole and F. Sebastiani. Supervised term weighting for automated text categorization. InProceedings of the 2003 ACM symposium on Applied computing, pages 784–788. ACM Press, 2003.
[6] Z.-H. Deng, S.-W. Tang, D.-Q. Yang, M. Zhang, L.-Y. Li, and K. Q. Xie. A comparative study on feature weight in text categorization, March 2004. [7] T. G. Dietterich. Approximate statistical tests for comparing supervised classification learning algorithms. Neural Comput., 10(7):1895–1923, 1998.
[8] S. Dumais, J. Platt, D. Heckerman, and M. Sahami. Inductive learning algorithms and representations for text categorization. In Proceedings of the seventh international conference on Information and knowledge management, pages 148–155. ACM Press, 1998.
[9] T. Joachims. Text categorization with support vector machines: learning with many relevant features. In C. N´edellec and C. Rouveirol, editors,
Proceedings of ECML-98, 10th European Conference on Machine Learn-ing, number 1398, pages 137–142, Chemnitz, DE, 1998. Springer Verlag, Heidelberg, DE.
[10] A. Kehagias, V. Petridis, V. Kaburlasos, and P. Fragkou. A comparison of word- and sense-based text categorization using several classification algorithms. Journal of Intelligent Information Systems, 21(3):227–247, November 2003.
[11] D. D. Lewis. An evaluation of phrasal and clustered representations on a text categorization task. In N. J. Belkin, P. Ingwersen, and A. M. Pejtersen, editors,Proceedings of the 15th Annual International ACM SIGIR Conference on Research and Development in Information Retrieval. Copenhagen, Denmark, June 21-24, 1992, pages 37–50. ACM, 1992.
[12] D. D. Lewis, Y. Yang, T. G. Rose, and F. Li. Rcv1: A new benchmark collection for text categorization research. J. Mach. Learn. Res., 5:361– 397, 2004.
[13] D. Mladenic, J. Brank, M. Grobelnik, and N. Milic-Frayling. Feature selection using linear classifier weights: interaction with classification models. InProceedings of the 27th annual international conference on Research and development in information retrieval, pages 234–241. ACM Press, 2004.
[14] M. Porter. An algorithm for suffix stripping.Program, pages 130–137, 1980.
[15] G. Salton and C. Buckley. Term-weighting approaches in automatic text retrieval. Inf. Process. Manage., 24(5):513–523, 1988.
[16] F. Sebastiani. Machine learning in automated text categorization.ACM Comput. Surv., 34(1):1–47, 2002.
[17] H. Wu and G. Salton. A comparison of search term weighting: term relevance vs. inverse document frequency. In Proceedings of the 4th annual international ACM SIGIR conference on Information storage and retrieval, pages 30–39. ACM Press, 1981.