Statistics For Big Data For Dummies®
Published by: John Wiley & Sons, Inc., 111 River Street, Hoboken, NJ 07030-5774, www.wiley.com
Copyright © 2015 by John Wiley & Sons, Inc., Hoboken, New Jersey Published simultaneously in Canada
No part of this publication may be reproduced, stored in a retrieval system or transmitted in any form or by any means, electronic, mechanical, photocopying,
recording, scanning or otherwise, except as permitted under Sections 107 or 108 of the 1976 United States Copyright Act, without the prior written permission of the
Publisher. Requests to the Publisher for permission should be addressed to the Permissions Department, John Wiley & Sons, Inc., 111 River Street, Hoboken, NJ 07030, (201) 748-6011, fax (201) 748-6008, or online at
http://www.wiley.com/go/permissions.
Trademarks: Wiley, For Dummies, the Dummies Man logo, Dummies.com, Making Everything Easier, and related trade dress are trademarks or registered trademarks of John Wiley & Sons, Inc., and may not be used without written permission. All other trademarks are the property of their respective owners. John Wiley & Sons, Inc., is not associated with any product or vendor mentioned in this book.
LIMIT OF LIABILITY/DISCLAIMER OF WARRANTY: WHILE THE PUBLISHER AND AUTHOR HAVE USED THEIR BEST EFFORTS IN PREPARING THIS BOOK, THEY MAKE NO REPRESENTATIONS OR WARRANTIES WITH RESPECT TO THE ACCURACY OR
COMPLETENESS OF THE CONTENTS OF THIS BOOK AND SPECIFICALLY DISCLAIM ANY IMPLIED WARRANTIES OF
MERCHANTABILITY OR FITNESS FOR A PARTICULAR PURPOSE. NO WARRANTY MAY BE CREATED OR EXTENDED BY SALES
REPRESENTATIVES OR WRITTEN SALES MATERIALS. THE ADVICE AND STRATEGIES CONTAINED HEREIN MAY NOT BE SUITABLE FOR YOUR SITUATION. YOU SHOULD CONSULT WITH A PROFESSIONAL WHERE APPROPRIATE. NEITHER THE PUBLISHER NOR THE AUTHOR SHALL BE LIABLE FOR DAMAGES ARISING HEREFROM.
For general information on our other products and services, please contact our
Customer Care Department within the U.S. at 877-762-2974, outside the U.S. at 317-572-3993, or fax 317-572-4002. For technical support, please visit
www.wiley.com/techsupport.
www.wiley.com.
Library of Congress Control Number: 2015943222
Statistics For Big Data For Dummies
Part I: Introducing Big Data Statistics
Chapter 1: What Is Big Data and What Do You Do with It?
Characteristics of Big Data Exploratory Data Analysis (EDA) Statistical Analysis of Big Data
Chapter 2: Characteristics of Big Data: The Three Vs
Characteristics of Big Data
Traditional Database Management Systems (DBMS)
Chapter 3: Using Big Data: The Hot Applications
Chapter 5: Basic Statistical Ideas
Some Preliminaries Regarding Data Summary Statistical Measures Overview of Hypothesis Testing Higher-Order Measures
Part II: Preparing and Cleaning Data
Chapter 6: Dirty Work: Preparing Your Data for Analysis
Passing the Eye Test: Does Your Data Look Correct? Being Careful with Dates
Does the Data Make Sense?
Frequently Encountered Data Headaches Other Common Data Transformations
Chapter 7: Figuring the Format: Important Computer File Formats
Spreadsheet Formats Database Formats
Chapter 8: Checking Assumptions: Testing for Normality
Goodness of fit test Jarque-Bera test
Chapter 9: Dealing with Missing or Incomplete Data
Missing Data: What’s the Problem? Techniques for Dealing with Missing Data
Chapter 10: Sending Out a Posse: Searching for Outliers
Testing for Outliers Robust Statistics Dealing with Outliers
Part III: Exploratory Data Analysis (EDA)
Chapter 11: An Overview of Exploratory Data Analysis (EDA)
Graphical EDA Techniques
EDA Techniques for Testing Assumptions Quantitative EDA Techniques
Chapter 12: A Plot to Get Graphical: Graphical Techniques
Stem-and-Leaf Plots
Statistical Techniques
Counting Events Over a Time Interval: The Poisson Distribution Continuous Probability Distributions
Chapter 14: To All the Variables We’ve Encountered: Multivariate Statistical Techniques
Testing Hypotheses about Two Population Means
Using Analysis of Variance (ANOVA) to Test Hypotheses about Population Means The F-Distribution
F-Test for the Equality of Two Population Variances Correlation
Chapter 15: Regression Analysis
The Fundamental Assumption: Variables Have a Linear Relationship Defining the Population Regression Equation
Chapter 16: When You’ve Got the Time: Time Series Analysis
Key Properties of a Time Series
Forecasting with Decomposition Methods Smoothing Techniques
Seasonal Components
Modeling a Time Series with Regression Analysis Comparing Different Models: MAD and MSE
Part IV: Big Data Applications
Chapter 17: Using Your Crystal Ball: Forecasting with Big Data
ARIMA Modeling Simulation Techniques
Chapter 18: Crunching Numbers: Performing Statistical Analysis on Your Computer
Excelling at Excel
Programming with Visual Basic for Applications (VBA) R, Matey!
Chapter 19: Seeking Free Sources of Financial Data
Yahoo! Finance
Federal Reserve Economic Data (FRED)
U.S. Department of the Treasury Other Useful Financial Websites
Part V: The Part of Tens
Chapter 20: Ten (or So) Best Practices in Data Preparation
Check Data Formats
Check Your Assumptions about How the Data Is Distributed Back Up and Document Everything You Do
Chapter 21: Ten (or So) Questions Answered by Exploratory Data Analysis (EDA)
What Are the Key Properties of a Dataset? What’s the Center of the Data?
How Much Spread Is There in the Data? Is the Data Skewed?
What Distribution Does the Data Follow? Are the Elements in the Dataset Uncorrelated? Does the Center of the Dataset Change Over Time? Does the Spread of the Dataset Change Over Time? Are There Outliers in the Data?
Does the Data Conform to Our Assumptions?
About the Authors Cheat Sheet
Advertisement Page Connect with Dummies
Introduction
Welcome to Statistics For Big Data For Dummies! Every day, what has come to be known as big data is making its influence felt in our lives. Some of the most useful innovations of the past 20 years have been made possible by the advent of massive data-gathering capabilities combined with rapidly improving computer technology. For example, of course, we have become accustomed to finding almost any information we need through the Internet. You can locate nearly anything under the sun
immediately by using a search engine such as Google or DuckDuckGo. Finding information this way has become so commonplace that Google has slowly become a verb, as in “I don’t know where to find that restaurant — I’ll just Google it.” Just think how much more efficient our lives have become as a result of search engines. But how does Google work? Google couldn’t exist without the ability to process massive
quantities of information at an extremely rapid speed, and its software has to be extremely efficient.
Another area that has changed our lives forever is e-commerce, of which the classic example is Amazon.com. People can buy virtually every product they use in their daily lives online (and have it delivered promptly, too). Often online prices are lower than in traditional “brick-and-mortar” stores, and the range of choices is wider. Online
shopping also lets people find the best available items at the lowest possible prices. Another huge advantage to online shopping is the ability of the sellers to provide reviews of products and recommendations for future purchases. Reviews from other shoppers can give extremely important information that isn’t available from a simple product description provided by manufacturers. And recommendations for future purchases are a great way for consumers to find new products that they might not otherwise have known about. Recommendations are enabled by one application of big data — the use of highly sophisticated programs that analyze shopping data and
identify items that tend to be purchased by the same consumers.
Although online shopping is now second nature for many consumers, the reality is that e-commerce has only come into its own in the last 15–20 years, largely thanks to the rise of big data. A website such as Amazon.com must process quantities of information that would have been unthinkably gigantic just a few years ago, and that processing must be done quickly and efficiently. Thanks to rapidly improving technology, many traditional retailers now also offer the option of making purchases online; failure to do so would put a retailer at a huge competitive disadvantage.
In addition to search engines and e-commerce, big data is making a major impact in a surprising number of other areas that affect our daily lives:
Social media
Insurance Healthcare Energy
Political polling Weather forecasting Education
About This Book
This book is intended as an overview of the field of big data, with a focus on the statistical methods used. It also provides a look at several key applications of big data. Big data is a broad topic; it includes quantitative subjects such as math, statistics, computer science, and data science. Big data also covers many applications, such as weather forecasting, financial modeling, political polling methods, and so forth. Our intentions for this book specifically include the following:
Provide an overview of the field of big data. Introduce many useful applications of big data.
Show how data may be organized and checked for bad or missing information. Show how to handle outliers in a dataset.
Explain how to identify assumptions that are made when analyzing data. Provide a detailed explanation of how data may be analyzed with graphical techniques.
Cover several key univariate (involving only one variable) statistical techniques for analyzing data.
Explain widely used multivariate (involving more than one variable) statistical techniques.
Provide an overview of modeling techniques such as regression analysis. Explain the techniques that are commonly used to analyze time series data. Cover techniques used to forecast the future values of a dataset.
Provide a brief overview of software packages and how they can be used to analyze statistical data.
Because this is a For Dummies book, the chapters are written so you can pick and choose whichever topics that interest you the most and dive right in. There’s no need to read the chapters in sequential order, although you certainly could. We do suggest, though, that you make sure you’re comfortable with the ideas developed in Chapters 4
and 5 before proceeding to the later chapters in the book. Each chapter also contains several tips, reminders, and other tidbits, and in several cases there are links to websites you can use to further pursue the subject. There’s also an online Cheat Sheet that
includes a summary of key equations for ease of reference.
As mentioned, this is a big topic and a fairly new field. Space constraints make
Foolish Assumptions
We make some assumptions about you, the reader. Hopefully, one of the following descriptions fits you:
You’ve heard about big data and would like to learn more about it.
You’d like to use big data in an application but don’t have sufficient background in statistical modeling.
You don’t know how to implement statistical models in a software package.
Possibly all of these are true. This book should give you a good starting point for advancing your interest in this field. Clearly, you are already motivated.
Icons Used in This Book
Throughout the book, we include several icons designed to point out specific kinds of information. Keep an eye out for them:
A Tip points out especially helpful or practical information about a topic. It may be hard-won advice on the best way to do something or a useful insight that may not have been obvious at first glance.
A Warning is used when information must be treated carefully. These icons point out potential problems or trouble you may encounter. They also highlight mistaken assumptions that could lead to difficulties.
Technical Stuff points out stuff that may be interesting if you’re really curious about something, but which is not essential. You can safely skip these if you’re in a hurry or just looking for the basics.
Beyond the Book
Besides the pages or pixels you’re presently perusing, this book comes with even more goodies online. You can check out the Cheat Sheet at
www.dummies.com/cheatsheet/statisticsforbigdata.
We’ve also written some additional material that wouldn’t quite fit in the book. If this book were a DVD, these would be on the Bonus Content disc. This handful of extra articles on various mini-topics related to big data is available at
Where to Go From Here
You can approach this book from several different angles. You can, of course, start with
Chapter 1 and read straight through to the end. But you may not have time for that, or maybe you are already familiar with some of the basics. We suggest checking out the table of contents to see a map of what’s covered in the book and then flipping to any particular chapter that catches your eye. Or if you’ve got a specific big data issue or topic you’re burning to know more about, try looking it up in the index.
Once you’re done with the book, you can further your big data adventure (where else?) on the Internet. Instructional videos are available on websites such as YouTube. Online courses, many of them free, are also becoming available. Some are produced by private companies such as Coursera; others are offered by major universities such as Yale and M.I.T. Of course, many new books are being written in the field of big data due to its increasing importance.
If you’re even more ambitious, you will find specialized courses at the college
undergraduate and graduate levels in subject areas such as statistics, computer science, information technology, and so forth. In order to satisfy the expected future demand for big data specialists, several schools are now offering a concentration or a full degree in Data Science.
Introducing Big Data Statistics
In this part …
Introducing big data and stuff it’s used for Exploring the three Vs of big data
Checking out the hot big data applications
What Is Big Data and What Do You Do
with It?
In This Chapter
Understanding what big data is all about
Seeing how data may be analyzed using Exploratory Data Analysis (EDA)
Gaining insight into some of the key statistical techniques used to analyze big data
Big data refers to sets of data that are far too massive to be handled with traditional hardware. Big data is also problematic for software such as database systems, statistical packages, and so forth. In recent years, data-gathering capabilities have experienced explosive growth, so that storing and analyzing the resulting data has become
progressively more challenging.
Many fields have been affected by the increasing availability of data, including finance, marketing, and e-commerce. Big data has also revolutionized more traditional fields such as law and medicine. Of course, big data is gathered on a massive scale by search engines such as Google and social media sites such as Facebook. These developments have led to the evolution of an entirely new profession: the data scientist, someone who can combine the fields of statistics, math, computer science, and engineering with knowledge of a specific application.
Characteristics of Big Data
The three factors that distinguish big data from other types of data are volume,velocity,
and variety.
Clearly, with big data, the volume is massive. In fact, new terminology must be used to describe the size of these datasets. For example, one petabyte of data consists of
bytes of data. That’s 1,000 trillion bytes!
A byte is a single unit of storage in a computer’s memory. A byte is used to represent a single number, character, or symbol. A byte consists of eight bits, each consisting of either a 0 or a 1.
Velocity refers to the speed at which data is gathered. Big datasets consist of data that’s continuously gathered at very high speeds. For example, it has been estimated that Twitter users generate more than a quarter of a million tweets every minute. This requires a massive amount of storage space as well as real-time processing of the data.
Variety refers to the fact that the contents of a big dataset may consist of a number of different formats, including spreadsheets, videos, music clips, email messages, and so on. Storing a huge quantity of these incompatible types is one of the major challenges of big data.
Exploratory Data Analysis (EDA)
Before you apply statistical techniques to a dataset, it’s important to examine the data to understand its basic properties. You can use a series of techniques that are
collectively known as Exploratory Data Analysis (EDA) to analyze a dataset. EDA helps ensure that you choose the correct statistical techniques to analyze and forecast the data. The two basic types of EDA techniques are graphical techniques and
quantitative techniques.
Graphical EDA techniques
Graphical EDA techniques show the key properties of a dataset in a convenient format. It’s often easier to understand the properties of a variable and the relationships between variables by looking at graphs rather than looking at the raw data. You can use several graphical techniques, depending on the type of data being analyzed. Chapters 11 and 12
explain how to create and use the following:
Box plots Histograms
Normal probability plots Scatter plots
Quantitative EDA techniques
Quantitative EDA techniques provide a more rigorous method of determining the key properties of a dataset. Two of the most important of these techniques are
Interval estimation (discussed in Chapter 11). Hypothesis testing (introduced in Chapter 5).
Interval estimates are used to create a range of values within which a variable is likely to fall. Hypothesis testing is used to test various propositions about a dataset, such as
The mean value of the dataset.
The standard deviation of the dataset.
The probability distribution the dataset follows.
Statistical Analysis of Big Data
Gathering and storing massive quantities of data is a major challenge, but ultimately the biggest and most important challenge of big data is putting it to good use.
For example, a massive quantity of data can be helpful to a company’s marketing research department only if it can identify the key drivers of the demand for the company’s products. Political polling firms have access to massive amounts of
demographic data about voters; this information must be analyzed intensively to find the key factors that can lead to a successful political campaign. A hedge fund can develop trading strategies from massive quantities of financial data by finding obscure patterns in the data that can be turned into profitable strategies.
Many statistical techniques can be used to analyze data to find useful patterns:
Probability distributions are introduced in Chapter 4 and explored at greater length in Chapter 13.
Regression analysis is the main topic of Chapter 15. Time series analysis is the primary focus of Chapter 16. Forecasting techniques are discussed in Chapter 17.
Probability distributions
You use a probability distribution to compute the probabilities associated with the elements of a dataset. The following distributions are described and applied in this book:
Binomial distribution: You would use the binomial distribution to analyze variables that can assume only one of two values. For example, you could
determine the probability that a given percentage of members at a sports club are left-handed. See Chapter 4 for details.
Poisson distribution: You would use the Poisson distribution to describe the likelihood of a given number of events occurring over an interval of time. For example, it could be used to describe the probability of a specified number of hits on a website over the coming hour. See Chapter 13 for details.
The normal distribution works well with many applications. For example, it’s often used in the field of finance to describe the returns to financial assets. Due to its ease of interpretation and implementation, the normal distribution is sometimes used even when the assumption of normality is only approximately correct.
The Student’s t-distribution: The Student’s t-distribution is similar to the normal distribution, but with the Student’s t-distribution, extremely small or extremely large values are much more likely to occur. This distribution is often used in situations where a variable exhibits too much variation to be consistent with the normal distribution. This is true when the properties of small samples are being analyzed. With small samples, the variation among samples is likely to be quite considerable, so the normal distribution shouldn’t be used to describe their properties. See Chapter 13 for details.
Note: The Student’s t-distribution was developed by W.S. Gosset while employed at the Guinness brewing company. He was attempting to describe the properties of small sample means.
The chi-square distribution: The chi-square distribution is appropriate for several types of applications. For example, you can use it to determine whether a
population follows a particular probability distribution. You can also use it to test whether the variance of a population equals a specified value, and to test for the independence of two datasets. See Chapter 13 for details.
The F-distribution: The F-distribution is derived from the chi-square distribution. You use it to test whether the variances of two populations equal each other. The F-distribution is also useful in applications such as regression analysis (covered next). See Chapter 14 for details.
Regression analysis
Regression analysis is used to estimate the strength and direction of the relationship between variables that are linearly related to each other. Chapter 15 discusses this topic at length.
Two variables X and Y are said to be linearly related if the relationship between them can be written in the form
where
m is the slope, or the change in Y due to a given change in X b is the intercept, or the value of Y when X = 0
whether its advertising expenditures are actually increasing profits, and if so, by how much. The corporation gathers data on advertising and profits for the past 20 years and uses this data to estimate the following equation:
where
Y represents the annual profits of the corporation (in millions of dollars).
X represents the annual advertising expenditures of the corporation (in millions of dollars).
In this equation, the slope equals 0.25, and the intercept equals 50. Because the slope of the regression line is 0.25, this indicates that on average, for every $1 million increase in advertising expenditures, profits rise by $.25 million, or $250,000. Because the
intercept is 50, this indicates that with no advertising, profits would still be $50 million. This equation, therefore, can be used to forecast future profits based on planned
advertising expenditures. For example, if the corporation plans on spending $10 million on advertising next year, its expected profits will be as follows:
Hence, with an advertising budget of $10 million next year, profits are expected to be $52.5 million.
Time series analysis
A time series is a set of observations of a single variable collected over time. This topic is talked about at length in Chapter 16. The following are examples of time series:
The daily price of Apple stock over the past ten years.
The value of the Dow Jones Industrial Average at the end of each year for the past 20 years.
The daily price of gold over the past six months.
With time series analysis, you can use the statistical properties of a time series to predict the future values of a variable. There are many types of models that may be developed to explain and predict the behavior of a time series.
One place where time series analysis is used frequently is on Wall Street. Some analysts attempt to forecast the future value of an asset price, such as a stock, based entirely on the history of that stock’s price. This is known as technical analysis.
Technical analysis can work only if there are inefficiencies in the market.
Otherwise, all information about a stock’s history should already be reflected in its price, making technical trading strategies unprofitable.
Forecasting techniques
Many different techniques have been designed to forecast the future value of a variable. Two of these are time series regression models (Chapter 16) and simulation models (Chapter 17).
Time series regression models
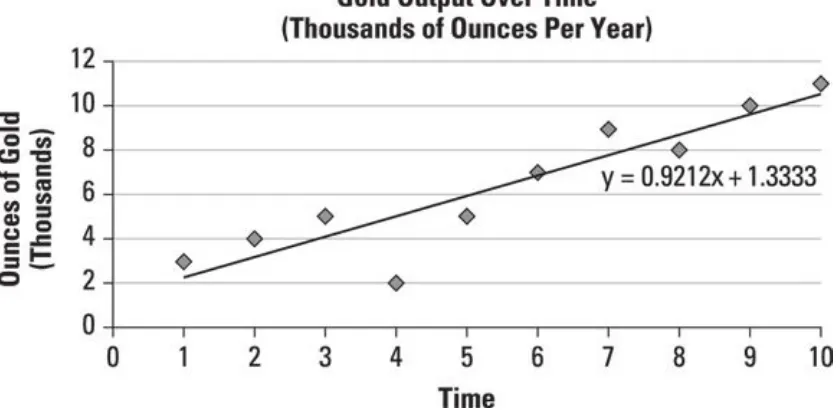
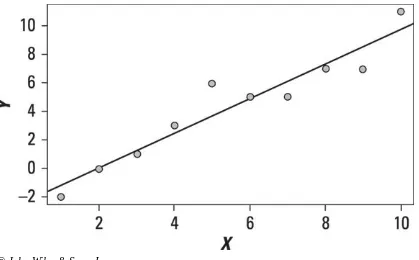
A time series regression model is used to estimate the trend followed by a variable over time, using regression techniques. A trend line shows the direction in which a variable is moving as time elapses.
As an example, Figure 1-1 shows a time series that represents the annual output of a gold mine (measured in thousands of ounces per year) since the mine opened ten years ago.
© John Wiley & Sons, Inc.
Figure 1-1: A time series showing gold output per year for the past ten years.
The equation of the trend line is estimated to be
where
X is the year.
Y is the annual production of gold (measured in thousands of ounces).
average, the output of the mine grows by 0.9212 thousand (921.2 ounces) each year. You could use this trend line to predict the output next year (the 11th year of operation) by substituting 11 for X, as follows:
Based on the trend line equation, the mine would be expected to produce 11,466.5 ounces of gold next year.
Simulation models
You can use simulation models to forecast a time series. Simulation models are
extremely flexible but can be extremely time-consuming to implement. Their accuracy also depends on assumptions being made about the time series data’s statistical
properties.
Two standard approaches to forecasting financial time series with simulation models are historical simulation and Monte Carlo simulation.
Historical simulation
Historical simulation is a technique used to generate a probability distribution for a variable as it evolves over time, based on its past values. If the properties of the
variable being simulated remain stable over time, this technique can be highly accurate. One drawback to this approach is that in order to get an accurate prediction, you need to have a lot of data. It also depends on the assumption that a variable’s past behavior will continue into the future.
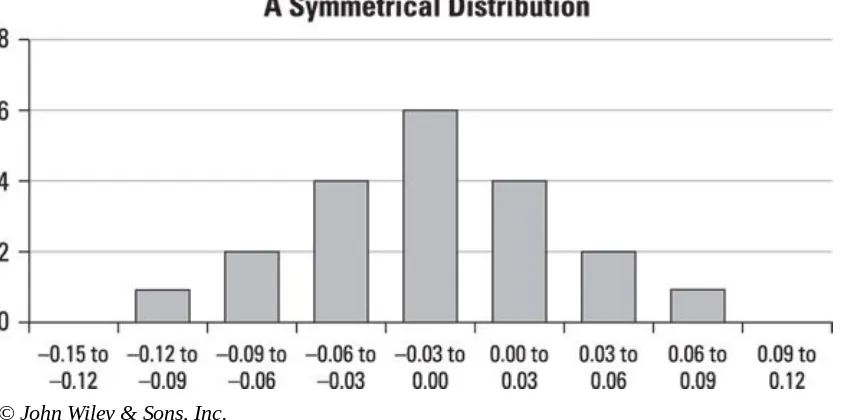
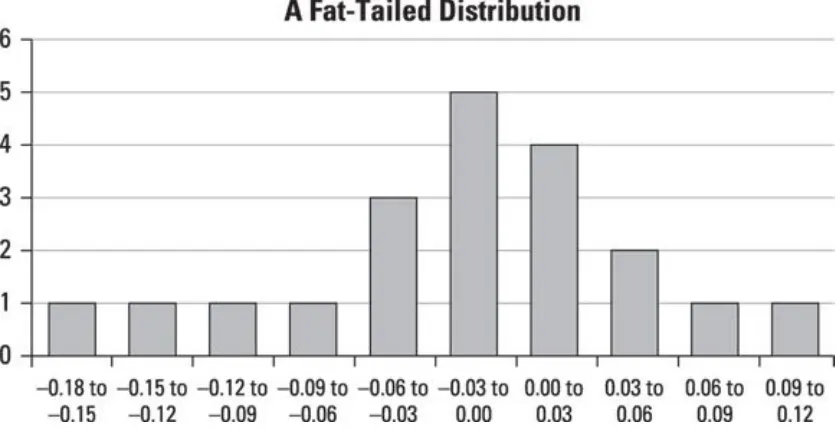
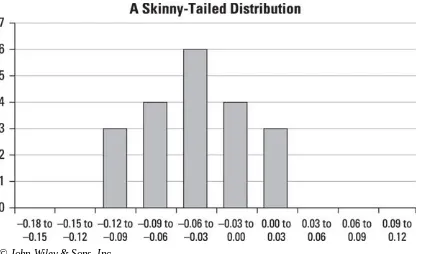
As an example, Figure 1-2 shows a histogram that represents the returns to a stock over the past 100 days.
Figure 1-2: A histogram of stock returns.
This histogram shows the probability distribution of returns on the stock based on the past 100 trading days. The graph shows that the most frequent return over the past 100 days was a loss of 2 percent, the second most frequent was a loss of 3 percent, and so on. You can use the information contained within this graph to create a probability distribution for the most likely return on this stock over the coming trading day. Monte Carlo simulation
Monte Carlo simulation is a technique in which random numbers are substituted into a statistical model in order to forecast the future values of a variable. This methodology is used in many different disciplines, including finance, economics, and the hard sciences, such as physics. Monte Carlo simulation can work very well but can also be extremely time-consuming to implement. Also, its accuracy depends on the statistical model being used to describe the behavior of the time series.
As you can see, we’ve got a lot to cover in this book. But don’t worry, we take it step by step. In Part I, we look at what big data is. We also build a statistical toolkit that we carry with us throughout the rest of the book. Part II focuses on the (extremely
important) process of preparing data for the application of the techniques just
Characteristics of Big Data: The Three Vs
In This Chapter
Understanding the characteristics of big data and how it can be classified
Checking out the features of the latest methods for storing and analyzing big data
The phrase big data refers to datasets (collections of data) that are too massive for traditional database management systems (DBMS) to handle properly. The rise of big data has occurred for several reasons, such as the massive increase in e-commerce, the explosion of social media usage, the advent of video and music websites, and so forth. Big data requires more sophisticated approaches than those used in the past to handle surges of information. This chapter explores the characteristics of big data and
Characteristics of Big Data
The three main characteristics that define big data are generally considered to be volume, velocity, and variety. These are the three Vs. Volume is easy to understand. There’s a lot of data. Velocity suggests that the data comes in faster than ever and must be stored faster than ever. Variety refers to the wide variety of data structures that may need to be stored. The mixture of incompatible data formats provides another challenge that couldn’t be easily managed by DBMS.
Volume
Volume refers, as you might expect, to the quantity of data being generated. A
proliferation of new sources generates massive amounts of data on a continuous basis. The sources include, but are certainly not limited to, the following:
Internet forums
The volume of data being created is accelerating rapidly, requiring new terminology to describe these massive quantities. This terminology includes names that describe progressively larger amounts of storage. These names can sound quite strange in a world where people are familiar with only megabytes (MB) and gigabytes (GB), and maybe terabytes (TB). Some examples are the petabyte (PB), the zettabyte (ZB), and the yottabyte (YB).
You are likely familiar with the megabyte: one thousand kilobytes, or one million bytes of storage. A gigabyte refers to one billion bytes of storage. Until recently, the storage capacity of hard drives and other storage devices was in the range of hundreds of gigabytes, but in 2015 1TB, 2TB, and 4TB internal and external hard drives are now common.
The next step up is the terabyte, which refers to one trillion bytes. One trillion is a
large number, expressed as a one followed by twelve zeros:
1,000,000,000,000
With scientific notation, a number is expressed as a constant multiplied by a power of ten. For example, 3,122 would be expressed as , because 103
equals 1,000. The constant always has one digit before the decimal point, and the remaining digits come after the decimal point.
For larger units of storage, the notation goes like this:
bytes = one petabyte bytes = one exabyte bytes = one zettabyte
bytes = one yottabyte
Here’s an interesting name for a very large number: is called a googol. The name of the search engine Google is derived from this word. Speaking of Google, the company is currently processing over 20 petabytes of information each day, which is more than the estimated amount of information currently stored at the Library of Congress.
Velocity
As the amount of available data has surged in recent years, the speed with which it becomes available has also accelerated dramatically. Rapidly received data can be classified as the following:
Streaming data
Complex event processing
Streaming data is data transferred to an application at an extremely high speed. The classic example would be the movies you download and watch from sources such as Netflix and Amazon. In these cases, the data is being downloaded while the movie is playing. If your Internet connection isn’t very fast, you’ve probably noticed annoying interruptions or glitches as the data downloads. In those cases, you need more velocity.
Streaming is useful when you need to make decisions in real time. For example, traders must make split-second decisions as new market information becomes available. An entire branch of finance known as market microstructure analyzes how prices are generated based on real-time trading activity. High-frequency trading (HFT) uses computer algorithms to generate trades based on incoming market data. The data arrives at a high speed, and the assets are held for only fractions of a second before being resold.
decisions may be made in real time. An example is your GPS device’s ability to reroute you based on traffic and accident data.
Variety
In addition to traditional data types (numeric and character fields in a file), data can assume a large number of different forms. Here are just a few:
Spreadsheets
Word-processing documents Videos
Photos Music Emails
Text messages
With such a variety of formats, storing and analyzing these kinds of data are extremely challenging. The formats are incompatible with each other, so combining them into one large database is problematic.
Traditional Database Management Systems
(DBMS)
A traditional DBMS stores data and enables it to be easily retrieved. There are several types of database management systems, which can be classified according to the way data is organized and cross-referenced. This section focuses on three of the most important types: relational model, hierarchical model, and network model databases.
Relational model databases
With a relational database, the data is organized into a series of tables. Data is accessed by the row and column in which it’s located. This model is very flexible and is easy to expand to include new information. You simply add more records to the bottom of an existing table, and you can create new categories by simply adding new rows or columns.
Table 2-1 shows a simple example of a table in a relational database.
Table 2-1
Employee Data Organized as a Relational Database
Name Title Years with Company Annual Salary
Smith, John Senior Accountant 8 $144,000 Jones, Mary VP, Research and Development 24 $250,000
Williams, Tony CFO 13 $210,000
… … … …
The data in Table 2-1 is organized as a series of records in a table. Each record contains information about one employee. Each record contains four fields: Name, Title, Years with Company, and Annual Salary.
Using this setup, you can find information about employees very quickly and easily. For example, if the human resources department wants to determine which employees have been with the company for at least ten years, a new table — with information drawn from this table — could be generated to list the employees. Table 2-2 shows the new table.
Table 2-2
Employees Who Have Been with the Company at Least Ten
Years
Name Years with Company
Jones, Mary 24 Williams, Tony 13
The relational database user accesses the information with a special type of software known as a query language. One of the most widely used query languages is SQL (Structured Query Language).
The “structure” of Structured Query Language is quite simple and is basically the same for all relational database systems. Syntax differs slightly from system to system. But in all cases, queries follow the same format (though not all elements need always be present).
Select (list of data fields you want to see)
From (list of tables containing the data)
Where (list of filtering and other conditions you want to use) Group by (instructions for summarizing the data)
Having (list of conditions on the summarized data) Order by (sorting instructions).
So for example, the report shown in Table 2-2 could have been generated by the following query:
Select Name, Years with Company
From Employee Data
Where Years with Company >10.
Currently, the relational model is the most commonly used type of DBMS. Some examples of relational database software include the following:
SQL Server
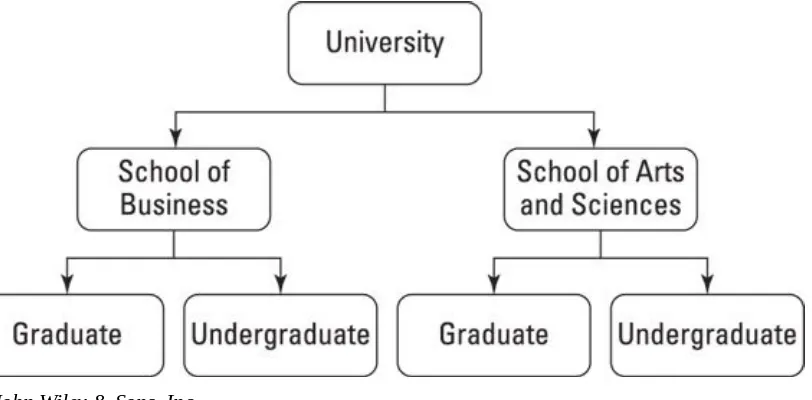
A hierarchical database is organized as a tree. Records are connected through links. This type of database has a top-down structure, with all searches for data starting at the top of the structure and continuing through the entire structure until the desired
information is found.
whether they attend the School of Business or the School of Arts and Sciences. Within each school, the students are further classified as undergraduates or graduate students.
© John Wiley & Sons, Inc.
Figure 2-1: A diagram of a hierarchical database.
You can think of each box in the diagram as a node, and each arrow as a branch. The University node is the parent of the School of Business and School of Arts and
Sciences nodes. The School of Business node is a child of the University node, as is the School of Arts node.
One of the drawbacks of this model is that accessing a record requires searching through the entire structure until the record is found — and that’s extremely time-consuming. For example, finding the record of a specific graduate business student requires starting with the University node, followed by the School of Business node, and then the Graduate node.
Another drawback to this model is that each parent node may have many child nodes, but each child node may only have one parent node. For many types of data, this doesn’t accurately describe the relationship among the records.
Hierarchical models are not nearly as prevalent as relational systems. They are useful when the data you are managing actually is a hierarchy. Perhaps the most familiar such instances are file managers, such as the Finder on the Mac and Windows Explorer in Windows.
Network model databases
The network model is a more flexible version of the hierarchical model. It’s also organized as a tree with branches and nodes. However, one important difference between the two models is that the network model allows for each child node to have more than one parent node. Because of this, much more complex relationships may be represented.
Alternatives to traditional database systems
The rise of big data has outstripped the capacity of traditional database management systems. Two approaches to addressing this have become commonplace in the Internet age: distributed storage and parallel processing. The basic idea behind them both is sharing the load.
Distributed storage
Distributed storage is exactly what it sounds like. Rather than gather all the data into a central location, the data is spread out over multiple storage devices. This allows quicker access because you don’t need to cull through a huge file to find the information you’re looking for.
Distributed storage also allows for more frequent backups. Because systems are writing data to a lot of small files, real-time backups become reasonable.
Distributed storage is the backbone of so-called cloud computing. Many find it
reassuring that all the books, music, and games they have ever purchased from the Web are backed up in the cloud. Even if you drop your iPad in the lake, for example, you could have everything restored and available on a new device with very little effort.
Parallel processing
Distributed storage allows another type of sharing to be done. Because the data is stored on different machines, it can be analyzed using different processors. This is known as parallel processing. It is particularly useful for mathematical and statistical applications involving very complex modeling techniques.
Even with the very powerful computers available today, big data analysis would still be impossible without parallel processing. The human genome project is wholly
dependent on having a server farm to sort out the seemingly infinite number of possibilities.
Parallel processing can be very widely distributed. To illustrate, there is a climate prediction project that has been managed through Oxford University for a little over a decade. The website Climateprediction.net manages a distributed computing array that is borrowing resources from almost 30,000 machines. There are similar arrays
Using Big Data: The Hot Applications
In This Chapter
Understanding the impact that big data is making in several diverse fields Checking out new products and services stemming from big data
Considering the challenges facing users of big data
Thanks to the continuing surge of computing power and storage capacity, it has become possible to gather, process, and analyze quantities of data that would have been
unimaginable just a decade ago. This has given rise to the entirely new field of big data. Big data bridges several disciplines, including statistics, mathematics, and computer science. It addresses the unique challenges associated with processing enormous volumes of information. Big data is already making major inroads into a wide variety of highly diversified fields, ranging from online shopping to healthcare services.
This chapter introduces several of the most exciting areas in which big data is having a major impact. In many cases, the acceleration of computer technology is increasing efficiency, lowering costs, making new services available, and improving the quality of life. Some of these areas include the following:
Weather forecasting
Of these fields, online shopping and search engines couldn’t exist at all without big data. Weather forecasting has benefited tremendously from the massive increase in data-processing speeds and data-gathering capabilities that has occurred in recent years. Other fields, such as retail services, finance, banking, insurance, education, and so forth, certainly predated the rise of big data, but have rapidly adopted it in order to
Gain a competitive edge.
Improve the quality of existing products and services. Lower production costs.
Big Data and Weather Forecasting
Weather forecasting has always been extremely challenging, given the number of variables involved and the complex interactions between those variables. Dramatic increases in the ability to gather and process data have greatly enhanced the ability of weather forecasters to pinpoint the timing and severity of hurricanes, floods,
snowstorms, and other weather events.
One example of an application of big data to weather forecasting is IBM’s Deep Thunder. Unlike many weather forecasting systems, which give general information about a broad geographical region, Deep Thunder provides forecasts for extremely specific locations, such as a single airport, so that local authorities can get critically important information in real time. Here are some examples of the information that Deep Thunder can provide:
Estimates of areas where flooding is likely to be most severe The strength and direction of tropical storms
The most likely amount of snow or rain that will fall in a specific area The most likely locations of downed power lines
Estimates of areas where wind speeds are likely to be greatest
The locations where bridges and roads most likely to be damaged by storms The likelihood of flights being cancelled at specific airports
This information is essential for emergency planning. Using big data, local authorities can better anticipate problems caused by weather before they occur. For example, planners can make preparations to evacuate low-lying areas that are likely to be flooded. It’s also possible to make plans to upgrade existing facilities. (For example, power lines that are prone to being disabled by heavy winds can be upgraded.)
One important customer of Deep Thunder is the city of Rio de Janeiro, Brazil, which will be using the system in planning for the 2016 Olympics. Using the technology, the city will make use of improved forecasts for storms, floods, and other natural disasters in order to ensure that the Olympics won’t be disrupted by such events.
IBM is also providing massive computing power to the Korean Meteorological Administration (KMA) to fully embrace big data technology. The KMA gathers over 1.5 terabytes of meteorological data each day, which requires a staggering amount of storage and processing power to analyze. By using big data, the KMA will be able to improve its forecasts regarding the strength and location of tropical storms and other weather systems.
that in perspective, you would need around 1,500 CDs to store a single terabyte. Including their plastic cases, that would stack up as a 40-foot tall tower of CDs. Another example of using big data in weather forecasting took place during Hurricane Sandy in 2012 — the “storm of the century.” The National Hurricane Center was able to use big data technology to predict the hurricane’s landfall to within 30 miles a full five days in advance. That is a dramatic increase in accuracy from what was possible even 20 years ago. As a result, FEMA and other disaster management organizations were far better prepared to deal with the mess than they might have been had it occurred in the 1990s or earlier.
One of the interesting consequences of gathering and processing more weather data is the appearance of corporations that sell customized insurance to protect against
weather damage. One example is the Climate Corporation, which was formed in 2006 by two former employees of Google. The Climate Corporation sells
weather-forecasting services and specialized insurance to farmers seeking to hedge the risk of crop damage. The company uses big data to pinpoint the types of risks that are relevant to a specific area, based on massive amounts of data on moisture, soil type, past crop yields, and so on.
Farming is an exceptionally risky business, because the variable of weather is far less predictable than the variables that affect most other businesses, such as interest rates, the state of the economy, and so forth. Although farm insurance is available from the federal government, in many cases it isn’t sufficient to meet the more specialized types of risks that plague individual famers. The Climate Corporation fills gaps in federal insurance — gaps that would be impossible to offer without an improved
Big Data and Healthcare Services
Healthcare is one area where big data has the potential to make dramatic improvements in the quality of life. The increasing availability of massive amounts of data and rapidly increasing computer power could enable researchers to make breakthroughs, such as the following:
Predicting outbreaks of diseases
Gaining a better understanding of the effectiveness and side effects of drugs Developing customized treatments based on patient histories
Reducing the cost of developing new treatments
One of the biggest challenges facing the use of big data in healthcare is that much of the data is stored in independent “silos.” A data silo is a collection of data that isn’t used on a regular basis and so isn’t accessible outside of the silo. Healthcare data comes from multiple sources:
Much of the data is scattered and not readily accessible. Also, the data may be stored in many different formats — some of it still on paper! As a result, much information that could be potentially useful in some applications may be difficult and time-consuming to acquire.
Once this data has been combined properly, the potential exists to dramatically improve the analytical techniques used to diagnose patients. For example, it may eventually become possible to provide genetic sequencing for each individual patient; at the moment, this would be a prohibitively expensive and lengthy process in most cases. Here are some other potential benefits of using big data in healthcare:
Increased ability of patients to monitor their own treatments
Improved ability of doctors to choose the best treatments for patients
More efficient matching of patients with the appropriate healthcare professionals
Big Data and Insurance
The insurance industry couldn’t survive without the ability to gather and process substantial quantities of data. In order to determine the appropriate premiums for their policies, insurance companies must be able to analyze the risks that policyholders face and be able to determine the likelihood of these risks actually materializing.
Due to substantial increases in the availability of data and the speed and storage capacity of computers, new opportunities have arisen for the insurance industry to increase profits through the improved modeling of risks, the use of more efficient pricing practices, and the ability to offer more specialized products. Additionally, big data may be used for security purposes, such as detecting and preventing insurance fraud.
A good example of the use of big data in the insurance industry is the growing use of telematics devices in the auto insurance industry.
A telematics device transmits computer data wirelessly. It may be used for many purposes, such as increasing the quality of a product or ensuring the safety of a process. A Global Positioning System (GPS) is an example of a telematics device.
An auto insurance company may install a telematics device in a vehicle, with the resulting data transmitted to the insurance company in real time. The data may include the following details:
Speed
Number of miles driven Braking patterns
Time of day when driving takes place
These data can help an insurance company determine the likelihood of a given driver becoming involved in an accident. The company can use this information to set the premium paid by the individual driver.
The benefit to the driver is that he or she may be eligible for lower premiums if the data show a pattern of safe driving. Another benefit is that the driver will have a better
understanding of his or her own driving habits, and will gain knowledge about how to drive more safely.
One of the drawbacks of using telematics devices is the need to process and store significant amounts of data. Another potential issue is that insurance companies may receive telematics data from multiple providers, raising the possibility of
Another huge challenge for insurance companies is identifying and quantifying the most important risk factors from the massive amounts of data being gathered. For example, the insurance company must decide how much each mile driven contributes to the likelihood of an accident. This requires a great deal of sophisticated statistical modeling.
Despite these potential problems, the use of telematics devices in the auto insurance industry is expected to grow rapidly in the next few years as the ability to process the required data continues to improve and public acceptance of the idea grows.
Telematics is currently being used far more widely in commercial auto insurance than for personal auto owners. Fleets of trucks and taxis are good examples. But it is
beginning to move into the personal auto space on a voluntary basis. Everybody thinks they are a good driver and wants to get a discount for being one.
But this does raise a larger point about big data and privacy. With all this data floating around, where is the line drawn about what companies and governments can legally know about you? There is no simple answer to that question and in fact it is a constant topic of debate in Congress. Beyond your driving habits, everything from location tracking on your mobile device to which websites you surf is potentially out there to be had. And given people’s apparent willingness to sacrifice privacy for convenience, it’s worth keeping an eye on what companies are doing with your personal data.
Big Data and Finance
One area of the finance industry that has been dramatically affected by big data is the trading activities of banks and other financial institutions. An example is
high-frequency trading (HFT), a relatively new mode of trading that depends on the ability to execute massive volumes of trades in extremely short time intervals. HFT traders make money by executing a huge number of trades, each of which earns a miniscule profit. Unlike traditional traders, HFT traders don’t attempt to hold positions for any great length of time and don’t base their trades on fundamental factors such as interest rates, exchange rates, commodity prices, and so forth. The success of HFT trades depends critically on the speed of execution, as they are based on rapid fluctuations in market prices.
As more and more resources have been dedicated to HFT trading in the last couple of years, leading to an “arms race” in progressively faster hardware and software, the profitability of high-frequency trading has declined. As the speed of transactions has increased, the ability to make money based on speed alone has diminished. Further increases in speed are now bringing steadily diminishing returns — the profit per transaction has plunged. As a result, successful trading now depends less and less on hardware and more on software in the form of sophisticated trading algorithms.
An algorithm is a set of instructions used to carry out a procedure, kind of like a recipe. Algorithms are heavily used by computer scientists to instruct computers on how to perform various tasks, such as carrying out mathematical operations.
The use of advanced algorithms for trading strategies carries several potential
advantages, such as the ability to test ideas on historical data before risking any money. With HFT trading, there’s no time to test any potential trading strategies, because they must be implemented immediately.
Another advantage to using trading algorithms is that they can be based on
fundamental variables, such as interest rates and exchange rates, instead of simply searching through trades to look for temporary price changes. As a result, algorithms can be developed to find ever more complex relationships among securities prices and use this information to earn trading profits. Big data enhances algorithmic trading by providing the ability to search through enormous volumes of data looking for patterns that might not be detectable with smaller amounts of data or slower processing speeds. With shrinking profits from HFT, algorithmic trading appears to have a bright future, as the increasing availability of data and computer speed enable more and more
Big Data and Electric Utilities
One area where big data has made an impact on electric utilities is the development of smart meters. Smart meters provide a more accurate measure of energy usage by giving far more frequent readings than traditional meters. A smart meter may give several readings a day, not just once a month or once a quarter.
The information gathered by these meters help customers conserve electricity (by providing them with a more accurate picture of their consumption patterns). It can also enable them to better plan their electricity usage to avoid peak hours and save money. Smart meters also provide utilities with several advantages:
More accurate forecasts of future energy demand Improvement in the scheduling of maintenance Increase in ability to detect fraud
Reduction in power outages
Better compliance with regulatory requirements
With smart meters, utilities can determine not only how much electricity is being used, but at what times of day it’s being used. This information is critical in forecasting the demand for electricity at peak hours. Because electricity can’t be stored, capacity must match use at peak hours — the rest of the time, much of this capacity remains idle. As a result, the more accurately utilities can measure peak demand, the more efficiently they can plan for capacity needs.
The biggest challenge to the utilities that use smart meters is that the amount of data being generated is dramatically greater than the amount generated by traditional
meters. This fact requires a massive upgrade in the hardware and software capabilities of many utilities. Another problem is that the data being gathered may come from many different sources, leading to potential compatibility problems.
Big Data and Higher Education
Big data is making dramatic changes in the field of education. One area that has shown particular promise is computerized learning programs, which provide instant feedback to educators. The data gathered from these programs can provide key information to identify key challenges:
Students who need extra help
Students who are ready for more advanced material Topics that students are finding especially difficult Different learning styles
This information enables educators to identify problem areas and come up with
alternative methods for presenting material. Computerized testing can also be used to better understand the different techniques used by students to learn the same material. For example, some students do better with visual examples, but others do better with more numerically oriented examples. Educators can use data to customize training to the needs of individual students.
Additional advantages of using big data in education include the following:
Improved ability to develop curricula that address student needs Development of customized instruction for each student
Improvement of tools used to assess student performance
Several issues can arise with the use of big data in education. To use the data that’s gathered, large investments may be required to upgrade hardware and software capabilities. Another potential issue is privacy concerns as student data becomes
Big Data and Retailers
Retailers collect and maintain sales records for large number of customers. The
challenge has always been to put this data to good use. Ideally, a retailer would like to understand the demographic characteristics of its customers and what types of goods and services they are interested in buying. The continued improvement in computing capacity has made it possible to sift through huge volumes of data in order to find patterns that can be used to forecast demand for different products, based on customer characteristics.
Another issue that big data can help with is pricing strategies, specifically
understanding how sensitive different customers are to prices. Choosing the right price for a product has sometimes been based on guesswork. By contrast, big data can
increase the retailer’s ability to use customer habits to identify the profit-maximizing price for their goods. Another benefit to using big data is that retail stores can better plan the placement of merchandise throughout the store, based on customer shopping habits.
Big data can also help retailers with inventory management. Many retailers sell a wide variety of different products, and keeping track of this information is a huge challenge. With big data, retailers can have instantly updated information about the size and location of their inventories.
One of the most important uses of big data for a retailer is the ability to target
individual consumers with promotions based on his or her preferences. Such targeting not only increases the efficiency of advertising, it gives customers a more personal relationship with the retailer, thereby encouraging repeat business. In addition, knowledge of customer preferences enables the retailer to provide recommendations for future purchases, which further increases repeat business.
Nordstrom
As an example, Nordstrom has heavily embraced the use of big data. It was one of the first retail stores to offer customers the option of shopping online. The company has developed a smartphone app that lets customers shop directly from their iPads,
iPhones, and other mobile devices. Nordstrom also shows customers which of its stores carries specific merchandise; for merchandise that must be ordered from other stores, Nordstrom can provide a highly accurate estimate of delivery time.
Nordstrom uses its big data capabilities to target customers with personalized ads based on their shopping experiences. This information can come from Nordstrom’s store sales, its website, and from social media sites such as Facebook and Twitter.
Nordstrom conducts research into improving the customer shopping experience
Walmart
Walmart is another major retailer that has embraced big data. Based on sales volume, Walmart is the largest retailer in the United States. It’s also the largest private employer in the country.
In the past few years, Walmart has made a major push into e-commerce, enabling it to compete directly with Amazon.com and other online retailers. In 2011, Walmart
acquired a company called Kosmix to take advantage of that company’s proprietary search engine capabilities (Kosmix was renamed Walmart Labs). Since then, Walmart Labs has developed several new products based on big data technology. One of these is called Social Genome, which enables Walmart to target individual customers with discounts based on preferences the customers have expressed through various sites on the Internet. Another product developed by Walmart Labs is Shoppycat, an app that provides gift recommendations based on information found on Facebook.
Although e-commerce still accounts for a relatively small percentage of Walmart’s annual revenues, the investments the company has made in big data technology show that it expects online sales to become a progressively more important source of
revenues in the future.
Amazon.com
The best example of using big data in retail is Amazon.com, which couldn’t even exist without big data technology. Amazon started out selling books and has expanded into just about every area of retail imaginable, including furniture, appliances, clothes, and electronics. As a result, Amazon raked in $89 billion in revenues in 2014, making it one of the top ten retailers in the U.S., and the largest online retailer.
Like online retailers, Amazon uses big data for several applications:
Managing its massive inventories Accurately keeping track of orders
Making recommendations for future purchases
Amazon provides its recommendations through a process known as item-to-item collaborative filtering. This filtering is based on algorithms designed to identify the key details that can lead a customer to purchase a product, such as past purchases, items viewed, purchases made by customers with similar characteristics, and so forth. Amazon also provides recommendations by email, chosen based on the highest
potential sales.
Amazon EMR enables businesses to analyze enormous quantities of data by using Amazon’s computer hardware. This hardware is accessible through the Amazon Cloud Drive, where businesses can pay to store their data. For many businesses, using these facilities is cheaper than building the computer infrastructure that would be required to handle the demands of big data. AWS provides a large variety of computer services through Amazon Cloud Drive, including storage facilities, database management systems, networking, and so on.
One interesting extension of Amazon’s use of big data is its plan to ship merchandise to customers before they order it! The company received a patent in 2014 for its
Big Data and Search Engines
Big data has made possible the development of highly capable online search engines. A search engine finding web pages based on search terms requires sophisticated
algorithms and the ability to process a staggering number of requests. Here are four of the most widely used search engines:
Microsoft Bing Yahoo!
Ask
The use of Google dwarfs its competitors. As of February 2015, Google is estimated to receive 1.1 billion unique visitors each month. Bing is a distant second with 350
million; Yahoo! gets 300 million, and Ask, 245 million. Although Google isn’t the oldest search engine, it has become by far the most popular. The amount of data that Google handles each day is estimated to be about 20 petabytes ( bytes). All this traffic is profitable for Google — the bulk of its revenues come from advertising.
Google also provides computer services to organizations that don’t have their own capabilities for processing big data. Google recently introduced Google Cloud
Big Data and Social Media
Social media wouldn’t be possible without big data. Social media websites let people share photos, videos, personal data, commentary, and so forth. Some of the best examples of social media websites include these:
Facebook Twitter LinkedIn Instagram
Facebook was created in 2004 by Harvard students. It has since grown into the largest social media site in the world. As of 2014, Facebook has an estimated 900 million unique visitors each month, followed by Twitter with 310 million and LinkedIn with 225 million. Instagram has an estimated 100 million unique visitors per month. Facebook allows users to stay informed about their friends, family members,
acquaintances, and so on. Users can post photos, personal information, and news items, and use Facebook to locate friends. Twitter enables short messages called tweets to be posted. LinkedIn is a networking site intended to enable working professionals to stay in contact with each other, whereas the Instagram website lets users post photos for other users to see.
It’s estimated that Facebook processes more than 500 terabytes of data every day, requiring an extensive investment in big data technology. Like Google, Facebook earns the bulk of its revenues from advertising, much of it from the largest corporations in the United States.
Regardless of what industry you’re in, the techniques discussed in the remainder of this book will be helpful in your attempts to make smarter decisions. Hopefully, the
Understanding Probabilities
In This Chapter
Understanding the basic structure of probability spaces
Understanding discrete and continuous probability distributions Getting familiar with the binomial and normal distributions
Learning the fundamental concepts of multivariate probability distributions
The Core Structure: Probability Spaces
Beneath every statistical application, there lies a group of possible outcomes. A coin may come up heads or tails. A stock may go up or down. A baby may be born with blue, green, or brown eyes. These are generally referred to as experiments. In any situation where probability and statistics are applied, it is important to understand the entire set of possible outcomes. This set of possible outcomes is known as the event space. It is generally denoted by a capital E.
An event is a subset of the event space. An event can consist of more than one
particular outcome. For example, the event that a stock advances by more than $10 on a given day consists of many specific outcomes. It could advance by $10.01, or $10.02, and so on. If any one of these outcomes occurs, we say the event occurs.
The second important thing to understand is the likelihood of various events occurring. For a fair coin flip, both heads and tails are equally likely and each is assigned a
probability of 1/2. This assignment of probabilities to events is known as a probability measure. A probability measure is frequently represented by the letter P (not
surprisingly). So, in the case of the coin flip example, we would write to represent the fact that the probability of obtaining heads is 50%.
We’re being a little bit loose with the notion of an event space here.
Technically, the set of all possible outcomes is called the sample space. The event space is actually derived from the sample space by assigning probabilities to various subsets of the sample space. Believe it or not, it is in general not possible to assign every subset of your event space a probability. So, the event space consists of a collection of measurable subsets of the sample space. However, those subsets that are not measurable are weird-looking beasts. We don’t
encounter them in the applications discussed in this book. From here on out, we’ll treat the event space as the fundamental structure.
There are four basic properties that all probability measures share. They are all simple and quite intuitive:
All probabilities are between 0 and 1.
The probability of the entire event space is 1 or .
The probability of nothing happening is 0 or . The symbol ∅ is generally used to represent the empty set.
If two events don’t overlap, then the probability of one or the other happening is the sum of their individual probabilities. Symbolically, if , then it is always