Abstract
This study examines journey to work by train in Sydney and the relationship with urban form, socio-economic and demographic variables by using multiple regression model. Train modal share between area located close to and away from a rail station is compared by using analysis of variance. Results of analyses indicate that the proportion using train between area close to and away from rail station is significantly different. Several urban form variables are related to the proportion using train for work trips. However, when socio-economic factors are included in the analysis, car ownership is the main determinant for the proportion using train whilst urban form variable such as density does not have a significant influence. Although urban form variables are not the most important predictor for rail modal share, urban form does influence the proportion using train in different parts of the metropolitan region. The findings support the use of urban form policies to reduce the dependence on car. A variety of non-urban form factors that affect mode choice are also identified.
Keywords:Train modal share, urban form, socio-economic, demographic. Abstrak
Studi ini menganalisis perjalanan kerja dengan kereta api di Kota Sydney dan keterkaitannya dengan variabel bentuk kota, sosial ekonomi dan demographi dengan model regresi berganda. Penggunaan kereta api antara lokasi yang dekat dan yang jauh dari stasiun kereta api dibandingkan dengan menggunakan analisis varian. Hasil analisis memperlihatkan bahwa proporsi penggunaan kereta api antara lokasi yang dekat dan yang jauh dari stasiun berbeda secara signifikan. Beberapa variabel bentuk kota terkait dengan proporsi pemakaian kereta api untuk tujuan kerja. Akan tetapi, ketika faktor sosial-ekonomi juga disertakan, kepemilikan kendaraan pribadi menjadi faktor yang dominan, sedangkan variabel bentuk kota seperti halnya kepadatan, tidak memiliki pengaruh yang signifikan. Walaupun variabel bentuk kota bukanlah variabel terpenting terkait penggunaan kereta api, tetapi variabel bentuk kota juga mempengaruhi pemakaian kereta api pada bagian-bagian yang berbeda di wilayah kota metropolitan. Temuan dari studi ini mendukung penerapan kebijakan untuk mengurangi ketergantungan pada kendaraan pribadi. Berbagai variabel selain bentuk kota yang mempengaruhi pemilihan moda juga diidentifikasi.
Kata-kata Kunci:Penggunaan kereta api, bentuk kota, sosial-ekonomi, demographi.
Relationship between Urban Form, Socio-Economic, and Demographic
With Journey to Work by Train in Sydney, Australia
Putu Alit Suthanaya
Department of Civil Engineering, Faculty of Engineering, Udayana University, Bukit Jimbaran - Bali E-mail: [email protected]
Jurnal Teoretis dan Terapan Bidang Rekayasa Sipil Jurnal Teoretis dan Terapan Bidang Rekayasa Sipil
1. Introduction
Suburbanization of employment and decentralization of residential workers experienced by most cities has contributed to more dependence on the car and a decreasing trend in public transportation share, lead-ing to a less sustainable city over time. In addition to the growth of vehicle numbers, the social development of more complex travel patterns (based on the car) have been seen as major limitations for the achieve-ment of sustainable urban developachieve-ment. The main challenge in achieving a more sustainable city is to reduce car dependence (Newman and Kenworthy, 1999). One of the common policy objectives
espe-cially in the USA and Australia is to increase the pub-lic transport share of travel, in particular rail transport, through transit-oriented development.
resi-dents of areas with lower densities. In North America, Ewing (1995) reported that about 40 transit-oriented development (TOD) manuals are available with a general agreement that medium densities and a mix-ture of land-uses are required to support transit ser-vice. However, he criticised these manuals as they rely too heavily on intuition and lack of empirical support.
To better understand how urban form, socio-economic and demographic factors influence the proportion using train, a micro-level analysis focusing on zones close to a rail station is required. In this way, a better understanding of Journey to Work (JTW) market and the factors influencing the use of train can be achieved. In order to provide more empirical evidence on variables influencing rail modal share, this study use Journey to Work data over a 15-year period from 1981 to 1996 in Sydney, Australia. The objectives of this study are: to evaluate the trend and trip length in rail use over a 15-year period in Sydney, to compare the proportion using train between area close to (within walking distance, i.e. 800 m) and away from a rail station (beyond 800 m), and to investigate the relationship between urban form and the proportion using train controlling for non-urban form factors.
2. Literature Review
In Europe, before 1800, the physical expansion of a city was defined by the maximum distance people could comfortably walk to work. In that time, walking was the dominant mode of transportation. With the introduction of the new technology, passenger trans-portation modes (railways, trams) started replacing the walking mode and encouraged expansion outside the city (Hass-Klau, 1990). A similar situation was also experienced in Sydney with a steady progression from a compact “walking city” to a sprawling, car dependent city with low residential housing densities by world standards (Black, 1993).
Decentralization of both housing and jobs towards the outer areas has been experienced in many cities in the world and this has led to a change in the relative housing-jobs location. Increasing the availability of job opportunities close to a zone is thought to reduce the need for residents to travel longer distances to reach their job destinations. Several studies have pro-moted a policy of jobs-housing balance. They believe that decentralization of jobs closer to where residents live would reduce travel distances. However, Levine (1998) argued that jobs-housing balance does not reduce congestion and it has little impact on average travel speed. He stated further that the closer location of jobs to housing might improve matches between home and workplace and increase the range of resi-dents’ choice on available job opportunities.
There are many factors influencing travel behavior: urban form, socio-economic, demographic, pricing, actors involved, travel demand management (TDM), supply of road and public transportation, technology (fuel efficient car, catalytic converters, and intelligent transportation system), individual behavior or atti-tudes, and other factors (Neutze, 1977; Newman and Kenworthy, 1999; Stead, 2001; Madhavan and McGrath, 1999; Mokhtarian et al., 1995; Nijkamp, 1994; and Richardson, 1999). These factors interact with each other in a complex way.
In an attempt to increase public transportation patron-age, many researchers and planners promote the development of higher density for both population and employment around public transportation stations. It is hypothesized that increasing density and mixed use around public transportation stations will attract more people to use public transportation. By comparing cities at the mega level in their study, Newman and Kenworthy (1989) concluded that below 20 persons per hectare (eight persons per acre and eight to ten dwelling units per residential acre), there is a marked difference in driving, and below 30 persons per hec-tare the bus service becomes poor. They recom-mended densities above 30 to 40 persons per hectare (12 to 16 persons per acre) for public transportation-oriented urban lifestyles. Relationship between density and automobile use at mega cities scale is also studied by Suzuki and Muromachi (2007). They found that increase in average travel speed and car share contribute to total urban area and total car-kilometers. Study in Germany by Scheiner (2010) indicated that the increase in car use is influenced by built environ-ment and is not related much to trip distances.
More detailed study conducted by Harvey (1990), Holtzclaw (1990), and others suggests that a doubling of residential densities (persons per residential acre) correlate with a decrease of 20 percent to 30 percent in VMT per capita. The analysis of individual rail sys-tems shows that employment densities at station throughout the system affect boardings. For Chicago’s commuter and rapid rail, a doubling of station area employment increases boardings by 25 to 50 percent (Parsons Brinckerhoff Inc., 1996). Cervero (1993) found that proximity to a rail station was perhaps the strongest determinant for a resident’s use of rail.
factors and travel patterns. At the ward level, he found that areas with low ward-level population density (fewer than 10 persons per hectare) have higher aver-age travel distance by up to 14 kilometers per person. However, increasing density alone might not be able to reach the expected level of train ridership. Wibowo and Chalermpong (2009) who studied commuter travel behavior in Bangkok and Manila found that access distance and car availability have crucial influ-ence on the mass transit use.
Commenting on Newman and Kenworty (1989) findings, Banister (1992) stated that the difficulty with an international comparative analysis is the quality of the data and the opportunity for large-scale generaliza-tion with policies being rather prescriptive. Miller and Ibrahim (1998) also criticized empirical studies involving analysis of data from many different cities. They claimed that the characterization of the entire urban areas’ urban form in a few simple variables is suspect for statistical analysis.
The simple relationships between specific urban form variables and travel behavior are, in fact, complicated by other uncontrolled variables. Most of these studies are subject to criticism in that they have not formally controlled for non-urban form characteristics. Some researchers are more skeptical of the strength of the density as an explanatory variable. Researchers in this camp suggest that although the intensity of devel-opment may appear to affect travel behavior, the un-derlying causes are socio-economic and demographic factors. By using Household Survey data from 1990 and 1993 in Manchester, Senior (2009) found that higher frequency rail use tends to be associated with respondents who have limited or no car availability, who are in employment, who are of non-manual social class and who are aged 18-44 years. As urban form is not the only factor influencing rail patronage, this study considers urban form, socio-economic and demographic variables to explain the proportion using train in Sydney.
3. Methodology
3.1 Study area and data sources
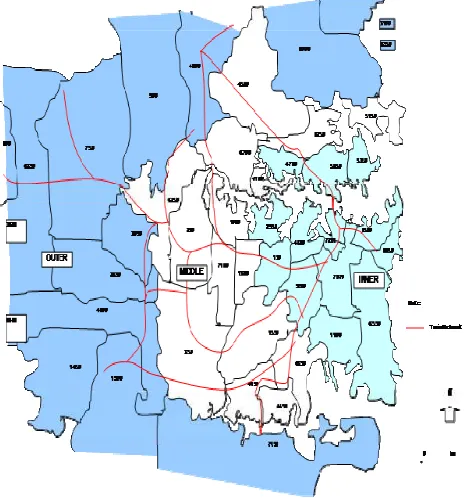
In 1996, Sydney’s population reached 3.8 million. It is estimated to reach 4.3 million between 2011 and 2016. The population in the outer suburbs has increased at a much faster rate than that in the inner and middle ring suburbs. Sydney’s metropolitan rail network as shown in Figure 1 (1,400 km of track along 651 km of routes) is the largest urban rail commuter network in Australia (with almost 270 million journeys in 1996/97). The primary data sources are 1981, 1991 and 1996 journey-to-work data for analyzing the trend in the proportion using train and the 1996 journey-to-work data for analyzing the link between urban form,
socio-economic and demographic characteristics and the proportion using train. All data are at the same level of geographic detail - traffic zone (TZ) level. There are 151 travel zones within walking distance (800 m) from a rail station and 115 zones located away from a rail station, therefore, 266 zones in total have been selected for this study.
3.2 The variables
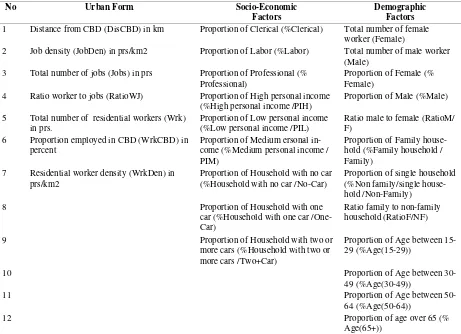
The dependent variable investigated is the proportion using train (%Train) while there are three groups of independent variables considered: urban form; socio-economic; and demographic characteristics. The list of urban form, socio-economic and demographic factors as independent variables are presented in Table 1.
3.3 Analytical method
The analyses comprise three sequential aspects. First, an evaluation of the trends in the proportion using train over a 15-year period from 1981 to 1996. Second, the problem of comparing proportion using train between zones close to and away from a rail sta-tion, stratified further into inner, middle and outer ring zones which is addressed through analysis of variance (ANOVA) using the Benferroni method. Third, inves-tigation of the relationship between urban form, socio-economic and demographic characteristics with the proportion using train using pearson correlation and multiple regression analysis for zones close to a rail station which is stratified into inner, middle and outer ring zones.
4. Results and Discussions
4.1 Trends in the proportion using train in metro-politan Sydney (1981-1996)
At the metropolitan level, the proportion using train for work trips in Sydney has decreased consistently from 19.4 percent in 1981 to 18.3 percent in 1996 (only three modes of transportation are considered – car (driver), bus and train). Figure 2 shows the LGA maximum, minimum, mean and median values of the proportion using train over a 15-year period in Sydney from 1981 to 1996. The Local Government Area (LGA) mean trip length by train has increased slightly from 23.8 km in 1981 to 24.3 km in 1991 and 24.4 km in 1996.
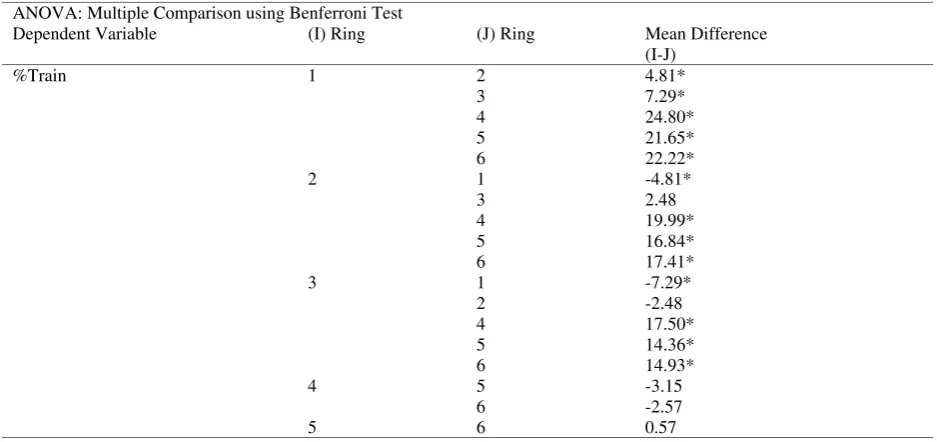
4.2 Comparison between areas close to and away from a rail station
Figure 1. Train network in Sydney
Source: NSW Transport Data Center (2002)
located away from a rail station in the inner, middle and outer ring, respectively. The proportion using train for travel zones located close to a rail station is signifi-cantly higher than that located away from a rail station. In the inner ring, zones located close to a rail station show the proportion using train is about 24.8 percent higher than those located away from a rail station. In the middle ring, residents living in zones close to a rail station have a higher rail modal share of about 16.8 percent more than those living in zones away from a rail station. Similarly, in the outer ring, it is
No Urban Form Socio-Economic Factors
Demographic Factors 1 Distance from CBD (DisCBD) in km Proportion of Clerical (%Clerical) Total number of female
worker (Female)
2 Job density (JobDen) in prs/km2 Proportion of Labor (%Labor) Total number of male worker (Male)
3 Total number of jobs (Jobs) in prs Proportion of Professional (% Professional)
Proportion of Female (% Female)
4 Ratio worker to jobs (RatioWJ) Proportion of High personal income (%High personal income /PIH)
Proportion of Male (%Male)
5 Total number of residential workers (Wrk) in prs.
Proportion of Low personal income (%Low personal income /PIL)
Ratio male to female (RatioM/ F)
6 Proportion employed in CBD (WrkCBD) in percent
Proportion of Medium ersonal in-come (%Medium personal inin-come / PIM)
Proportion of Family house-hold (%Family househouse-hold / Family)
7 Residential worker density (WrkDen) in prs/km2
Proportion of Household with no car (%Household with no car /No-Car)
Proportion of single household (%Non family/single house-hold /Non-Family)
8 Proportion of Household with one
car (%Household with one car /One-Car)
Ratio family to non-family household (RatioF/NF)
9 Proportion of Household with two or
more cars (%Household with two or more cars /Two+Car)
Proportion of Age between 15-29 (%Age(15-15-29))
10 Proportion of Age between
30-49 (%Age(30-30-49))
11 Proportion of Age between
50-64 (%Age(50-50-64))
12 Proportion of age over 65 (%
Age(65+))
Table 1. Independent variables
Source: NSW Transport Data Center (2002); Suthanaya (2003)
Figure 2. Proportion using train for the journey-to-work in Sydney (1981-1996)
ANOVA: Multiple Comparison using Benferroni Test
Dependent Variable (I) Ring (J) Ring Mean Difference (I-J)
Table 2. Comparison of the proportion using train in Sydney, 1996
* The mean difference is significant at 0.05 level
Source: Analysis results, 2009
4.3 Regional ring model of the proportion using train
4.3.1 Inner ring model
By stratifying the travel zones into inner, middle and outer rings, a regression model is developed for each regional ring. Table 3 shows the multiple regression model for the proportion using train for zones located close to a rail station in the inner ring. Three variables enter the model, i.e. the proportion of households with two cars or more, zone distances from the CBD and the proportion of workers aged 65 or over. The propor-tion of households with two or more cars is the most important predictor as indicated by the standardized coefficient value. The model reveals that, holding other factors constant, an increase of 10 percent of households with two or more cars within a rail station catchment area in the inner ring decreases the propor-tion using train by about 7.6 percent. The model shows that an increase in distance from the CBD of about 1 km adds about 2 percent to rail modal share.
Further-more, an increase in the proportion of workers aged 65 and over of about 10 percent leads to an increase in rail patronage by about 17 percent. Although all predictors are statistically significant, the model only explains about 31 percent in the variation of propor-tion using train.
4.3.2 Middle ring model
Table 4 shows the multiple regression model for the proportion using train for residents living close to a rail station in the middle ring. From five variables that enter the model, the proportion of laborer is the most important predictor as indicated by the standardized coefficient. Controlling for the other factors, the pro-portion of laborers, the propro-portion of households with no-cars and proportion of workers employed in the CBD have a positive association with the proportion using train. On the other hand, the proportion of workers aged between 30 and 49 and the proportion of workers with low income has a negative associa-tion.
No Variable Unstandardized Coeff. Standardized Coeff. (beta)
t Sig.
Constant 48 9.52 0.000
1 %TwoCar+ -0.76 -0.640 -4.31 0.000
2 DisCBD 1.99 0.453 3.26 0.002
3 %Age(65+) 1.67 0.282 0.28 0.050
R = 0.55 R2 = 0.31 Adj. R2 = 0.26 F = 6.89 Sig = 0.001
Table 3. Regression model for the proportion using train in the inner ring
Table 4. Regression model for the proportion using train in the middle ring
No Variable Unstandardized Coeff. Standardized Coeff. (beta) t Sig.
Constant 37.71 5.22 0.000
1 %NoCar 0.91 0.639 10.15 0.000
2 %WrkCBD 0.91 0.486 6.32 0.000
3 %Age(30-49) -0.49 -0.288 -4.25 0.000
4 %Laborer 1.18 0.647 4.47 0.000
5 %LowIncome (PIL) -0.27 -0.344 -2.46 0.017
R = 0.89 R2 = 0.80 Adj. R2 = 0.78 F = 51.77 Sig = 0.000
The model reveals that, holding other factors con-stant, an increase of 10 percent in laborers for zones located close to a rail station in the middle ring in-creases rail modal share by about 12 percent. Increas-ing by 10 percent the proportion of households with no-cars leads to an increase in the proportion using train of about 9 percent. Similarly, increasing the pro-portion of workers employed in the CBD by 10 cent increases rail modal share also by about 9 per-cent. By increasing the proportion of workers aged between 30 and 49 and the proportion of workers with low income by 10 percent it decreases the proportion using train by about 5 percent and 3 percent, respec-tively. All predictors are statistically significant and the model predicts 80 percent variation in the propor-tion using train for zones located close to a rail stapropor-tion in the middle ring.
4.3.3 Outer ring model
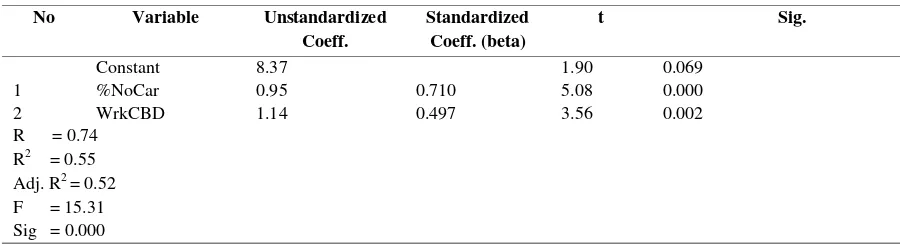
In the case of zones located close to rail stations in the outer ring, Table 5 shows the multiple regression model for the proportion using train. Only two vari-ables enter the model, i.e. the proportion of house-holds with no-cars and the proportion of workers em-ployed in the CBD. By controlling for the proportion of workers employed in the CBD, an increase in the proportion of households in a zone with no-cars by 10 percent, there is an increase in the proportion using train of that zone by 9.5 percent. Increases in the pro-portion of workers employed in the CBD by 10 per-cent leads to an increase in the rail modal share of
about 11 percent. The constant is not statistically sig-nificant but both of the predictor variables are statisti-cally significant. The model explains 55 percent varia-tion in the proporvaria-tion using train for the outer ring residents located close to rail station.
5. Conclusions
Analyses of trends in rail modal share have indicated that the rail modal share for work trips in Sydney has decreased marginally. The mean trip length by train for work trips increased from 23.8 km in 1981 to 24.4 km in 1996. Comparison of mode choice using analy-sis of variance identified that the rail modal share for residents living close to rail stations was significantly higher than those living away from rail stations. Resi-dents living close to a rail station in the inner ring were the highest train users in Sydney. Results of multiple regression analysis considering three independent vari-ables simultaneously indicated that for the inner ring zones, distance from the CBD was found to be the key urban form variable, while the proportion of workers employed in the CBD entered the middle and outer ring models. The inner ring model reveals that, hold-ing other factors constant, an increase of 10 percent of households with two or more cars within a rail station catchment area decreases the proportion using train by about 7.6 percent. The model also shows that an in-crease in distance from the CBD of about 1 km adds about 2 percent to rail modal share. Furthermore, an increase in the proportion of workers aged 65 and over
Table 5. Regression model for the proportion using train in the outer ring
No Variable Unstandardized Coeff.
Standardized Coeff. (beta)
t Sig.
Constant 8.37 1.90 0.069
1 %NoCar 0.95 0.710 5.08 0.000
2 WrkCBD 1.14 0.497 3.56 0.002
by about 10 percent leads to an increase in rail patron-age by about 17 percent. The middle ring model indi-cated that an increase of 10 percent in laborers for zones located close to a rail station, increases rail mo-dal share by about 12 percent. Increasing by 10 percent the proportion of households with no-cars leads to an increase in the proportion using train of about 9 per-cent. Similarly, increasing the proportion of workers employed in the CBD by 10 percent increases rail mo-dal share also by about 9 percent. By increasing the proportion of workers aged between 30 and 49 and the proportion of workers with low income by 10 percent it decreases the proportion using train by about 5 per-cent and 3 perper-cent, respectively. The outer ring model showed that an increase in the proportion of house-holds in a zone with no-cars by 10 percent leads to an increase in the proportion using train of that zone by 9.5 percent. An increase in the proportion of workers employed in the CBD by 10 percent leads to an in-crease in the rail modal share of about 11 percent. These findings suggest that although urban form vari-ables are not the most important predictor for rail mo-dal share, urban form does influence the proportion using train in different parts of the metropolitan re-gion. The findings support the use of urban form poli-cies to reduce the dependence on car. They also iden-tify a variety of non-urban form factors that affect mode choice.
6. Acknowledgements
I would like to thank to Professor John Black, the Uni-versity of New South Wales, Sydney, Australia for his great support. My deep appreciation also goes to NSW Transport Data Centre for providing data.
References
Banister, D., 1992, Energy Use, Transport and Setle-ment Patterns. In M.J. Breheny (ed.), Sustain-able Development and Urban Form, pp. 160-181. London: European Research in Regional Science 2. Pion.
Black, J.A., 1993, Energy Efficient Coordination of Land Use and Transport Interaction in Austra-lian Cities – A Perspective on Higher Housing Densities. New South Wales, Australia: A Paper Prepared for SIG 1 Seminar on Envi-ronmental Challenges in Land Use Transport Coordination. Blackheath.
Cervero, R., 1988, Land-Use Mixing and Suburban Mobility. Transportation Quarterly, 43 (3), pp. 429-446.
Cervero, R., 1993, Ridership Impacts of Transit Focused Development in California. Berkeley,
Research Report, University of California.
Ewing, R., 1995, Best Development Practices: Doing the Right Thing and Making Money at the Same Time, Chicago: American Planning Association.
Hass-Klau, C., 1990, Public Transport and Integrated Transport Policies in Large Metropolitan Areas of Europe. The Planner, 25th May, pp. 13-20. Harvey, G., 1990, Relation of Residential Density to
VMT per Resident. Metropolitan Transporta-tion Commission. Oakland.
Holtzclaw, J., 1990, Explaining Urban Density and Transit Impacts on Auto Use. Presented by the Natural Resource Defense Council and the Sierra Club to the State of California Energy Resources Conservation and Development Commission.
Levine, J., 1998, Rethinking Accessibility and Jobs-Housing Balance. Journal of American Plan-ning Association, 64 (2), pp.133-149.
Madhavan, S. and McGrath, D., 1999, The Environ-mental Dimension in Motor Transport with Special Reference to Technology Transfer in the Global Automobile Industry. In H. Meers-man, E. Van de Voorde and W. Winkelmans (eds). Selected Proceedings of 8th World Conference on Transport Research, Antwerp, Belgium, 12-17 July 1998, Volume 4: Trans-port Policy, pp.141-152.
Miller, E.J. and Ibrahim, A., 1998, Urban Form and Vehicular Travel: Some Empirical Findings. Transportation Research Record, 1617, pp. 18-27.
Mokhtarian, P.L., Handy, S.L. and Salomon, I., 1995,
Methodological Issues in the Estimation of the Travel, Energy, and Air Quality Impacts of Telecommuting. Transport Research Part A: Policy and Practice, 29 (4), pp. 283-302.
Newman, P.W.G. and Kenworthy, J.R., 1989, Cities and Automobile Dependence: A Sourcebook,
Gower, Brookfield, Vt.
Newman, P. and Kenworthy, J., 1999, Sustainability and Cities: Overcoming Automobile Dependence, Washington, D.C: Island Press.
Neutze, M., 1977, Urban Development in Australia: A Descriptive Analysis. Australia: George Allen and Unwin Australia Pty Ltd.
NSW Transport Data Center, 2002, Journey to Work Data. Sydney, Australia: New South Wales Department of Transport.
Pushkarev, B. and Zupan, J., 1976, Urban Densities for Public Transportation, New York: Tri-State Regional Planning Administration.
Pushkarev, B.S. and Zupan, J.M., 1977, Public Trans-portation and Land Use Policy, Bloomington, Indiana University Press.
Richardson, B.C., 1999, Toward a Policy on a Sus-tainable Transportation System. Transportation Research Record, 1670, pp. 27-34.
Senior, M.L., 2009, Impacts on travel behaviour of Greater Manchester’s light rail investment (Metrolink Phase 1): evidence from household surveys and Census data. Journal of Transport Geography, Vol. 17, Issue 3, pp. 187-197. Scheiner, J., 2010, Interrelations between Travel
Mode Choice and Trip Distance: Trends in Germany 1976-2002. Journal of Transport Geography, Vol. 18, Issue 1, pp. 75=-84. Spillar, R.J., and Rutherford, G.S., 1990, The Effects
of Population Density and Income On Per Capita Transit Ridership in Western American Cities, Washington, D.C: ITE 1990 Compen-dium of Technical Papers, Institute of Trans-portation Engineers, 327-331.
Suthanaya, P.A., 2003, Sustainable Transportation Indicators with Reference to Urban Form and Journey to Work Travel in the Sydney Metro-politan Region. Sydney, Australia: PhD Thesis, School of Civil and Environmental Engineer-ing, University of New South Wales.
Suzuki, T. and Muromachi, Y., 2007, Population Density-Automobile Use Relationship: Re-examination in Asian and American Mega-Cities. Proceedings of the Eastern Asia Society for Transportation Studies, Vol. 7.
Stead, D., 2001, Relationship between Land Use, Socioeconomic Factors, and Travel Patterns in Britain. Environment and Planning B: Plan-ning and Design, 28, pp. 499-528.
Wibowo, S.S. and Chalrempong, S., 2009, Role of Access Distance and Mode Attributes on the Mode Selection within Mass Transit Corridors.