Tofael Ahamed
Associate Professor
Faculty of Life and Environmental
Sciences
Inbound Mobility Program
University of Jember, Indonesia
Integrating Environment,
Agriculture and
Sustainability for Food
Security
-
Global Environmental
Food Security
4
Cyclone Phalin
October 2013
December 2013 Cairo, Egypt
Jerusalem
December 2013
Vietnam
December 2013
Global Environmental Change
Changes in the biogeophysical
environment caused or strongly infuenced by human activities
Land cover & soils
Atmospheric composition Climate variability & means Water availability & quality Nitrogen availability & cycling Biodiversity
Sea currents & salinity Sea level
Global Environmental Change
Examples of human activities leading to GEC
Deforestation
Fossil fuel consumption Urbanisation
Land reclamation
Agricultural intensification Freshwater extraction
Fisheries overexploitation Waste production
Global GHG Emission Sources
IPCC SRES estimates- Intergovernmental Panel on Climate Change
Climate Change Impacts on Grain
Yields
Percentage change in average crop yields. Efects of CO2 are taken into account. Crops
modelled are: wheat, maize and rice.
Cereal production
-12
Global production
Crop Topt,
Soybean 28 39 3.41 3.41 3.06 10
Dry bean 22 32 2.87 1.39 0.00 100
Peanut 25 40 3.38 3.22 2.58 20
Grain sorghum
26 35 12.24 11.75 6.95 41
Crop Productivity: Temperature Efects
Land Use for Agriculture
Harvested land in world increased by 24% 1961 to 2003 to 1.2 billion ha.
Agricultural conversion to croplands and managed pastures has affected some 3.3 billion ha—roughly 26% of the land area.
Agriculture has displaced one-third of temperate and tropical forests and one-quarter of natural grasslands.
World Resources Institute calculations, 2000;
Comprehensive Assessment of Water Management in Agriculture, 2007
Water Use in Agriculture
About 70% of global freshwater withdrawal
is for agriculture
Compared to 20% for industry and 10% for
municipalities
However, 55% of the gross value of crop
production grown under rainfed agriculture on 72% of harvested land.
Food balance sheet 1994-96
Most Important Food Crops
Globally
IPCC AR4 WGII
Concept and Scopes with Food
Secuirty
Sustainability and Sustainable
Development
Sustainability
Maximizing the net benefits of economic
development subject to maintain the services and quality of natural resources over the time
(Pearce and Turner 1990)
Environmental Sustainability Indicators (ESI)
ESI is single number derived from a list of
indicators that are each given the same weight
Total Productivity Factor (TFP)
TFP attempts to measure an efficiency of production by including of all of the costs
Food Security, Concept,
Dimension
Food Security
25
A person, household or community, nation
or region is food secure when all members at all times have physical and economic
access to buy, produce, obtain or consume sufficient, safe and nutritious food to meet their dietary needs and food preferences for a healthy and active life.
Food Security
FOOD UTILISATION
FOOD ACCESS
•Affordability
•Allocation
•Preference
•Nutritional Value
•Social Value
•Food Safety
FOOD AVAILABILITY
•Production
•Distribution
•Exchange
Environmental Welfare
• Ecosystem stocks & flows • Ecosystem
services • Access to
natural capital
Social Welfare
• Income
• Employment • Wealth
• Social capital • Political capital • Human capital
Food System OUTCOMES Contributing to:
Food System ACTIVITIES
Producing food: natural resources, inputs, technology, …
Processing & packaging food: raw materials, standards, storage requirement, …
Distributing & retailing food: transport, marketing, advertising, …
Consuming food: acquisition, preparation, customs, …
Ericksen, P. 2008. Global Env. Change
Afordability
Measures the ability of consumers to purchase
food, their vulnerability to price shocks, and the
presence of programes and policies to support consumers when shocks occur.
Food consumption as a share of household
expenditure
Proportion of population under global poverty
line
Gross domestic product per capita
Agricultural import tariffs
Availability
Measures the sufficiency of the national
food supply, the risk of supply disruption, national capacity to disseminate food, and research efforts to expand agricultural
output
Sufficiency of supply
Public expenditure on agricultural R&D
Agricultural infrastructure
Volatility of agricultural production
Quality and Safety
Measures the variety and nutritional quality
of average diets, as well as the safety of food.
Diet diversification
Nutritional standards
Micronutrient availability
Protein quality
Food Security Dimension -
Availability
Food Security Dimension - Access
Source: Calculations based on FAO data
0 100 200 300 400 500 600
Sub-Saharan Africa
South Asia Latin America and Caribbean
East Asia
1990 1999 2015
Food Insecurity- Negative Impact
Misselhorn 2005 Global Environmental Change
Multiple Exposure: Food insecurity arises from overlapping and interacting stressors
Infuencing Factors
Sustainable
intensifcation
Producing more food from the same area of
land while reducing the environmental impacts requires what has been called “sustainable intensification”,
we used many ways to reduce negative
externalities, agricultural land and water bodies used for aquaculture and fisheries can be managed in ways specifically
Reducing Waste
Roughly 30 to
40% of food in both the
developed and developing
worlds is lost to waste,
though the
Closing Yield Gap
There is wide geographic variation in crop
and livestock productivity, across regions that experience similar climates.
The different between realized productivity
and the best that can be achieved using current genetic material and available technologies and management is termed the “Yield Gap”
Developing climate adaptive/resilience
Changing diet
The conversion of plant in to animal mater
is about 10%
More people can be supported from same
amount of land if they are vegetarians.
One-third of global cereal production is fed
to animal, and the demand of meat and dairy increasing.
Increased wealth of consumers everywhere,
Expanding Aquaculture
Aquatic products provide 3 billion people with at
Crop Modeli ng for Yield Prediction
Changes in biophysical conditions
Changes in socioeconomic conditions in response to changes
in crop productivity (farmers’ income; markets and prices; poverty; malnutrition and risk of hunger;
migration)
POSSIBLE BENEFITS
POSSIBLE DRAWBACKS
CO2
CARBON DIOXIDE FERTILIZATION FLOODING AND SALINIZATION
POSSIBLE BENEFITS
POSSIBLE DRAWBACKS
CO2
Water
Carbon
Nitrogen
Crop Models
Based on
Understanding of plants, soil, weather, management
Calculate
Require
Growth, yield, fertilizer & water requirements, etc
43
Food Security Model
Food
FOODPROD FOREXFOREX
Supply
Supply
House Hold Access Index
House Hold Access Index
Demand
Demand
GDPGRWTH
GDPGRWTH
National Food Self Resilience Index
National Food Self Resilience Index
Performance Index
Performance Index
FOODINDEX
FOODINDEX FOREXINDFOREXIND
GNP
GNP CALORIECALORIE INFANTSINFANTS
Yield
44 Data
Minimizing Risk
Maximizing Production
Linear Program
ming
Baseline Survey
Primary Data
Secondary Data
FAO,UNDP, IFC, WB
multi-stage systematic sampling technique
ERDAS Imagine
GIS
Methodologies…
Satellite TimeSeries Data ( MODIS)
Satellite Time Series Data ( Land
Sat)
Food Security Research
Information Technology could have as big an impact on agriculture in the next half century as mechanization had in the previous century.
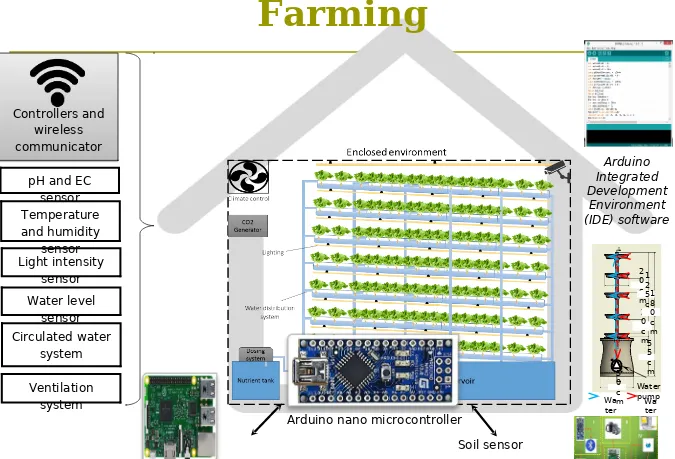
Circulated water system Light intensity
sensor Temperature and humidity
sensor
Ventilation system pH and EC
sensor
Water level sensor
Controllers and wireless communicator
Controllers and wireless communicator
Soilless Culture:Smart Indoor
Farming
Arduino Integrated Development
Environment (IDE) software
Contr oller set
Figure 39: Controller setup. Arduino nano microcontroller Light
Controlled Environment for
Agriculture
47
MICROCONTRO LLER
LCD display
LCD display
Bluetooth/ Wi-Fi module
Bluetooth/ Wi-Fi module
Control Block
Grow light
Grow light
Ventilator/ Fog system
Ventilator/ Fog system
Water pump
Water pump
Humidifer
Humidifer
Aeration pump for DO
Aeration pump for DO
pH dozer
pH dozer
Sensor Block
Environment Control
Environment Control
Temperature sensor
Temperature sensor
Light sensor
Light sensor
Humidity sensor
Humidity sensor
CO2 sensor
CO2 sensor
Dissolved oxygen sensor
Dissolved oxygen sensor
pH sensor
pH sensor EC
sensor
EC sensor
Water level sensor
Water level sensor
Root Zone Control
Root Zone Control
Moisture sensor
Moisture sensor
iFarm controller, Sesa Design Inc.
The Growtronix Automation System, Growtronix Agrowtek GC Pro, Agrowtek
Intelliclimate and Intellidose, Autogrow
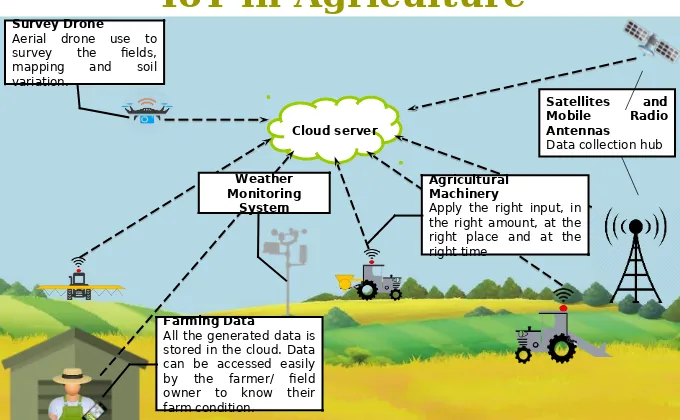
Cloud server
Farming Data
All the generated data is stored in the cloud. Data can be accessed easily by the farmer/ feld owner to know their farm condition.
Survey Drone
Aerial drone use to survey the felds, mapping and soil variation.
Agricultural Machinery
Apply the right input, in the right amount, at the right place and at the right time
Satellites and Mobile Radio Antennas
Data collection hub
Weather Monitoring
System
IoT in Agriculture
Suitability Map
Suitable sites for rice production in northern
part of Bangladesh.
GIS Database
Database of Asia Map
NDVI Mapping
Decision Support Systems
49
Website
NDVI map Developed
ICT Tools Radio App
ICT-based marketing to minimize postharvest losses in Afghanistan
RS
GIS Dataset
- Population
- Road, land use parcels - Soil types
- GPS points (Field survey data)
Centralized Geodatabase
- Store - Retrieve - Edit/update
- Manage spatial data
Spatial Modeling
- Site suitability analysis - Land use change model
- Deforestation process - Land degradation process
Decision Support System
- Site selection - Land use planning - Policy making - Precision farming - Natural resources management
End Users
Agricultural unions Urban planners Policy makers
Remote Sensing Data
Panchromatic images Multispectral
images Surface temperature Land use/ cover NDVI
LULC Changes
Land use/cover change in suburb areas of Karawang city, Indonesia in 2000 and
2016. NDVI Map in Serang city
of Indonesia.
Data Manageme
nt Machine
Optimizati on
Targeting Agronom
y
Variable rate planting Variable rate
irrigation Variable rate
fertilizer Variable rate
pesticides
Site and time-specifc at feld level (Agronomy is Local)
Outsourcing Personal storage Cloud
Data
sharing securityData
Data primary
user right
Big Data cloud server
Quality of data mapping and
sensing
Management High
resolution Synergy
Genetic potentials of crops for
micro-climatic adaptability Remote access to
on-board and optimization of machinery operation
Agronomic decision with weather
adaptation
Conclusions
Innovative Research Frame Works are Required to meet the
Challenges of Food Security:
Site-specific solution which deal with micro climatic adaptation Tolerance proof (water, drought) variety development
Access of food should go through logistics management
Utilization of food should be with value-added, capture value throughout
the supply and value chain.
Food nutritional safety needs to be ensured throughout the critical control
points of supply chain
Research Adaption Policy, Factors. Food Security Challenges Crop Models
Yield Forecasting
Food Security Index (FSI)
National Food Self Reliance Index (NRI)