45 CHAPTER IV
RESEARCH FINDINGS AND DISCUSSIONS
This chapter means to present the result of research that was done for six meetings of Junior High School 1 Pariangan. The study was started on April, 7th 2017 and ended May, 9th 2017. At the end of the research the students were given writing test. The analysis of the collected data was carried out to find whether Story Mapping Technique can improve students’ writing ability at Junior High School 1 Pariangan. The data were analyzed by using t-test, which is proposed by Sudjana (1992: 239).
A.Data Description
Based on the research that had been done in class sample, it got result
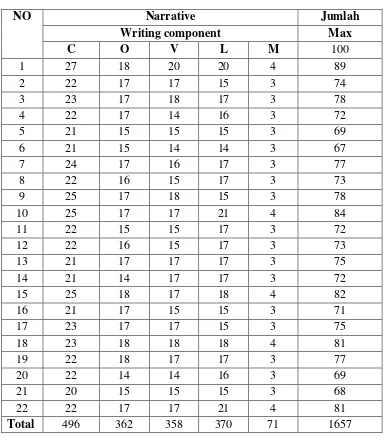
Table 4.1 Students’ Score of Post-test of Experimental Class (VIII4)
NO Narrative Jumlah
Writing component Max
C O V L M 100
1 27 18 20 20 4 89
2 22 17 17 15 3 74
3 23 17 18 17 3 78
4 22 17 14 16 3 72
5 21 15 15 15 3 69
6 21 15 14 14 3 67
7 24 17 16 17 3 77
8 22 16 15 17 3 73
9 25 17 18 15 3 78
10 25 17 17 21 4 84
11 22 15 15 17 3 72
12 22 16 15 17 3 73
13 21 17 17 17 3 75
14 21 14 17 17 3 72
15 25 18 17 18 4 82
16 21 17 15 15 3 71
17 23 17 17 15 3 75
18 23 18 18 18 4 81
19 22 18 17 17 3 77
20 22 14 14 16 3 69
21 20 15 15 15 3 68
22 22 17 17 21 4 81
Total 496 362 358 370 71 1657
Table 4.2 Calculation of Comparison Mean, Higher score, and Lower score of Component Writing in Experimental Class
C O V L M Sum
Mean 22,54 16,45 16,27 16,81 3,22 75,32
Higher score 25 18 20 21 4 89
The table above is students’ post-test score of experimental class. It can be described as follows; there are 22 students at experimental class with the
Table 4.3 Students’ Score of Post-Test of Control Class (VIII3)
NO Narrative Jumlah
Writing component Max
C O V L M 100
1 21 17 17 16 2 73
2 15 10 10 15 2 52
3 24 17 17 17 3 78
4 21 15 15 14 2 67
5 23 15 15 16 3 72
6 22 16 17 16 3 74
7 21 15 15 15 2 68
8 25 18 17 16 4 80
9 24 17 16 16 3 76
10 22 17 17 15 3 74
11 17 15 16 10 3 61
12 15 15 10 10 2 52
13 17 15 15 14 2 63
14 21 15 16 15 3 70
15 16 9 10 10 2 47
16 20 14 15 14 2 65
17 23 15 15 14 2 69
18 15 9 10 10 2 46
19 21 14 15 14 2 66
20 17 14 17 15 2 65
21 21 14 16 15 2 68
22 19 15 14 13 2 63
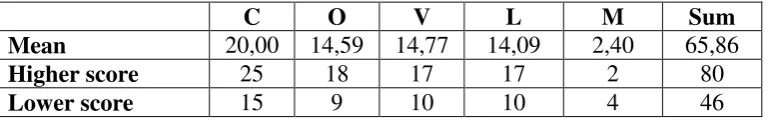
Table 4.4 Calculation of Comparison Mean, Higher score, and Lower score of Component Writing in Control Class
C O V L M Sum
Mean 20,00 14,59 14,77 14,09 2,40 65,86
Higher score 25 18 17 17 2 80
Lower score 15 9 10 10 4 46
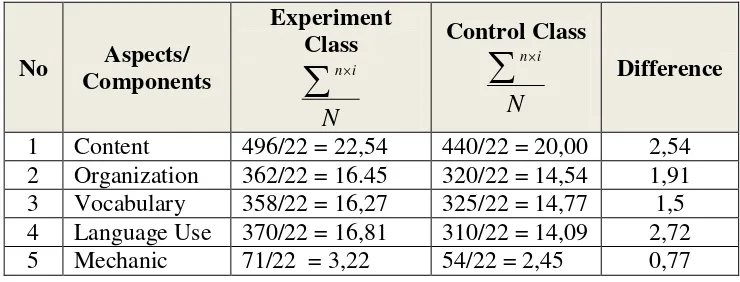
Table 4.5 The Calculation of Comparison of Means of Post-Test of Experiment and Control Class
No Aspects/ Components
Experiment Class
N i n
Control Class
N i n
Difference
1 Content 496/22 = 22,54 440/22 = 20,00 2,54 2 Organization 362/22 = 16.45 320/22 = 14,54 1,91 3 Vocabulary 358/22 = 16,27 325/22 = 14,77 1,5 4 Language Use 370/22 = 16,81 310/22 = 14,09 2,72 5 Mechanic 71/22 = 3,22 54/22 = 2,45 0,77
From the table above can be explained that: 1. Content
In experimental class, the mean post test scores of the students’
content was 22,54 while in control class, the mean of post test was 20.00 with difference 2,54. It can be concluded that Story Mapping Technique helped the students in developing their ideas fluently in writing. Besides, it helped to encouraged their thinking and imagination about what they are going to write and expand it.
2. Organization
In experimental class, the mean post test score of the students’
3. Vocabulary
In experimental class, the mean post test score of the students’
vocabulary was 16,27 while in control class, the mean scores of post test was 14,77 with difference 1,5. It can be concluded that Story Mapping Technique helped the students highly in mastering vocabulary.
4. Language use
In experimental class, the mean post test score of the students’
language use was 16,81 while in control class, the mean scores of post test was 14,09 with difference 2,72. It can be concluded that Story Mapping Technique helped the students in mastering the language use. 5. Mechanics
In experimental class, the mean post test score of the students’
mechanic was 3.22 while in control class, the mean scores of post test was 2.45 with difference 0,77. It can be concluded that Story Mapping Technique improved the student’s knowledge in using mechanic in writing such as in capitalization (e.g. semicolon, colon), and capitalization.
explanation above, the researcher can conclude that the component of students’ writing were mostly improve is language use with different 2,72 from the both classes.
Based on the explanation above showed the students’ writing
competence in aspects of content, organization, vocabulary, language use and mechanic has really developed and the use of story mapping technique for experimental group gave significance effect than the conventional one. It means that the hypothesis of this research was accepted.
B.Descriptive Data Analysis
The data will be analyzed by using t-test formula. The calculation of t-test between mean score of post t-test of experimental class and control class is as follow; Besides that, the students’ interval score in experiment class can be seen from the table below :
1. Tabulating
Based on data which was gathered from 44 students specified by as
sample, data of students’ achievement on writing ability will be tabulated as
follow. Before going to the tabulating, we had to find those interval. a. Experimental Class
H= 89 n= 22 RHL + 1
L= 67 I = R/K K13.3logn
Note:
I = Interval
R = 89- 67 +1 = 23
K = 1+3,3. Log n
= 1+ 3,3 . Log 22 = 1+ 3,3. 1.34 = 1+ 4,42 = 5,42 I = R/K = 23/5,42 = 4,24 = 4
So, the interval of students writing score is 4.
Then, the students’ score of test in experimental class can be seen
in the table below :
Table 4.6 The Interval Data of Experimental Class Post Test Score (VIII.4)
No Interval Frequency Percentage
(Students’ Writing Scores)
1. 87 – 90 1 4 %
2. 83 – 86 1 4 %
3. 79 – 82 3 16,63 %
4. 75 – 78 6 27,27 %
5. 71 – 74 7 31,81 %
6. 67 – 70 4 18,18 %
Total 22 100 %
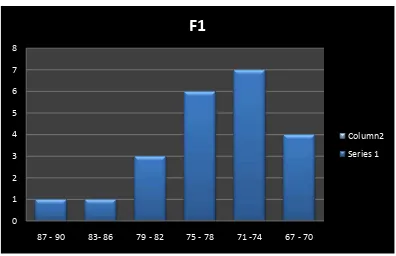
From the table above, it was found that most of students’ writing
students got scores at that interval or 18,18 % while the interval 71-74 there were 7 students too got the scores at that intervals or 31,81 % then the interval 75-78 there were 6 students got score at that interval or 27,27%, beside that the interval 79-82 there were 3 students got score at that interval or 16,63%. In the other hand the interval 83-86 there were students got score at that interval or 4 %, meanwhile interval 87-90 there were 1 student got score at that interval or 4%, it can be said that there were no students got the scores under 67.
b. Control Class
H= 80 n= 22 RHL + 1
L= 46 I = R/K K13.3logn
R = 80- 46+ 1 = 34
K = 1+3,3. Log n = 1+ 3,3 . Log 22 = 1+ 3,3. 1.34
= 1+ 4.42
= 5,42 I = R/K = 34/5,42 = 6,27 = 6
Then, the students’ score of test in control class can be seen in the
table below :
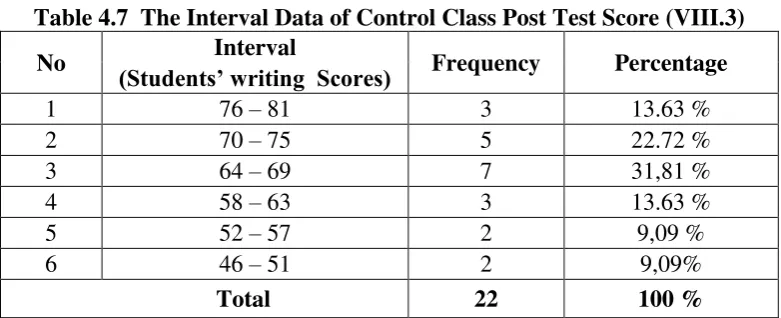
Table 4.7 The Interval Data of Control Class Post Test Score (VIII.3)
No Interval Frequency Percentage
(Students’ writing Scores)
1 76 – 81 3 13.63 %
2 70 – 75 5 22.72 %
3 64 – 69 7 31,81 %
4 58 – 63 3 13.63 %
5 52 – 57 2 9,09 %
6 46 – 51 2 9,09%
Total 22 100 %
From the table above, it was found that most of students’ writing
scores of post-test in the control class was about 46-51 there were 2 students got scores at that interval or 9,09% while the interval 52-57 there were 2 students got the scores at that intervals or 9.09 % then the interval 58-63 there were 3 students got score at that interval or 13,63% beside that the interval 64-69 there were 7 students got score at that interval or 31,81%. In the other hand the interval 70-75 there were 5 students got score at that interval or 22.72 % while 76-81 there were 3 students got score at that interval or 13.63 % and nobody got scores at 82 anymore.
2. Mean Scores and Standard Deviation
After tabulating, we looked for the mean scores in both experimental
and control classes. The formula of means score;
1 1 1 1
F X F X
a. Experiment Class
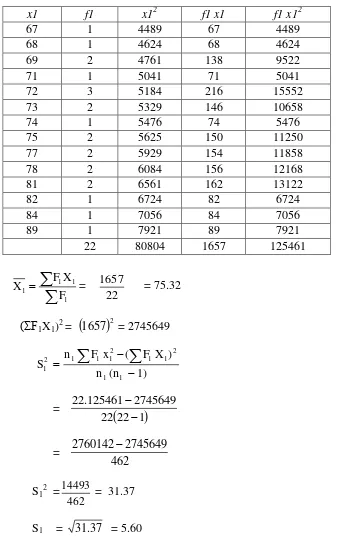
Table 4.8 Calculation Process of Mean and Standard Deviation of Writing Test Experimental Group
b. Control Class
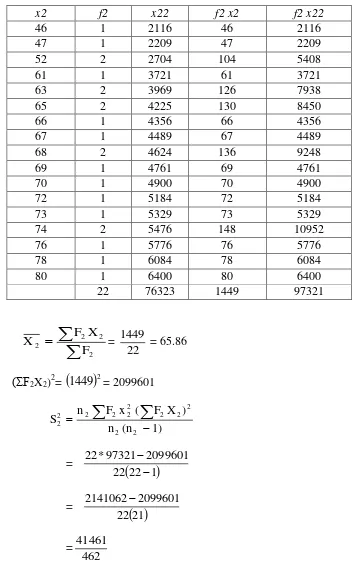
Table 4.9 Calculation Process of Mean and Standard Deviation of Writing Test Control Group
S 22 = 89.74 S2 = 89.74 S2 = 9.47
Table 4.8 The Calculation of Comparison Standard Deviation of Test
Class N Highest Score
Lowest Score
Mean (X)
Total score
Standard Deviation
Experimental 22 89 67 75.32 1657 5.60
Control 22 80 46 65.86 1449 9.47
3. Graphs
Graph 1 Post-Test Score of Experimental Class VIII.4
0 1 2 3 4 5 6 7 8
87 - 90 83- 86 79 - 82 75 - 78 71 -74 67 - 70
F1
Column2
Graph 2 Post-Test Score of Control Class VIII.3
Graph 3 Descriptive Data Analysis
0
Interval of Students’ Writing Score at Control Class
Graph. 4. Mean Score of Writing Component between Experiment and Control
C.Inferential Data Analysis
1. Prerequisite Hypotesis Testing
The prerequisite is necessary to determine whether the analysis of data for hypothesis testing can be continued or not. Some data analysis technique demanding test prerequisite analysis. Analysis of variance requisite that data come from a populatioan with normal distribution and group compared to homogenity of data.
A variety of prerequisite testing analysis, such as a normality test and homogenity test. the prerequisite analysis of data will be mentioned on the next point.
0 20 40 60 80
a. The normality of distribution test
Normality test had an objective to know the population normal or not. In this research, to doing the normality test the researcher used Kolmogrov Smirnov and Shapiro Wilk. Test was performed in SPSS test. Testing criterion and distributed normal if the data was more than 0.05. The class was normal. Based on that test, the researcher got test of normality class VIII4 as experiment class.
Table 4.10 Result of Normality Distribution Test on Post-Test
Tests of Normality
Kelas Kolmogorov-Smirnova Shapiro-Wilk Statistic Df Sig. Statistic df Sig. nilai
Ex .115 22 .200* .959 22 .471
Contro
l .154 22 .190 .927 22 .105
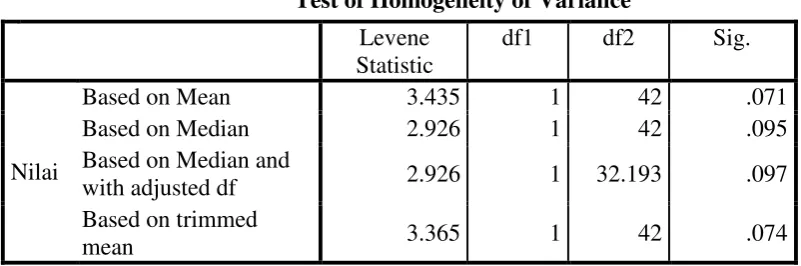
b. The homogeneity of variance test
To check the homogeneity of variance of the data, Levene’s test
was conducted. The result of calculating using Levene test are as follows: Test of Homogeneity of Variance
Levene Statistic
df1 df2 Sig.
Nilai
Based on Mean 3.435 1 42 .071
Based on Median 2.926 1 42 .095
Based on Median and
with adjusted df 2.926 1 32.193 .097
Based on trimmed
mean 3.365 1 42 .074
The table shows that the significance value (based on mean) is 0.71. It means that the probability is higher than 0.05 (p >0.05).
both classes were equal. The table of the homogeneity of variance test result can be seen clearly at the appendix.
D.Hypothesis Testing
In order to see the effect of Story Mapping Technique gave any
significant difference on students’ writing ability in these classes, the data that was observed of this research was analyzed by using Ttest.
The calculation of Ttest between mean score of experiment and control group could be figured bellow:
S = 7,78 4.06 while critical value of the t- table is 1,684 at the degree of freedom is 42
and the level of significant is 0.05. In conclusion, the value of t –calculated is bigger than the value of t-table. It means that the use of story mapping
technique towards students’ writing significantly.
E.Discussion on Research Finding
The first step taken by the researcher after got the data from doing experiment research at Junior High School 1 Pariangan to find whether they were homogenous or not. From the apparent data, the outcome of the data was different between the two groups. The data analysis showed that they are.
Story Mapping Technique could highly help students identify elements of story this opinion relevant with the Schaefer (2001:47) state story mapping help students identify the main character, setting, problem, and solution. Facts that highly develop their writing skills and help them come up well organized idea of stories based on clear elements. According Thomson (2003:135) Story Mapping Technique provides a structure for students to develop their narratives and to locate their ideas in relation to different story elements: main character, supporting characters, relationship among characters, setting, events, complication and resolution.
Related to the purpose of the research to determine whether there is any
significant difference on students’ writing ability by using Story Mapping
Technique, the researcher can say that there is any significant difference on
students’ writing ability between those who taught by using Story Mapping
could be seen on findings. It is shown by the post-test result for both classes
after giving the treatment by applying Story Mapping Technique.
In doing this research, there are several steps in the technique the
researcher forgot to apply it, for which the researcher asked for the negligence.
In this research, there were five components of writing that should be
measured in conducting the writing activity, namely: content, organization,
vocabulary, language use, and mechanics. In this case, the researcher wanted to
see these all of components and the researcher found that the component of
students’ writing mostly improve was organization and content.
After being taught by using Story Mapping Technique in several meetings, the students got some improvements of writing ability that was shown by their writing score. The experimental group improved dramatically after receiving treatment. While the control class group showed no significant improvement after receiving no treatment. The research proves that Story Mapping Technique have a dramatic influence on students’ writing ability. Statistically calculated, the result of this research, the mean scores of experiment class is 75,32 that taught by Story Mapping Technique and it supported the research hypothesis that Story Mapping Technique gave significance effect toward students writing skill in Narrativet Text at class VIII Junior High School 1 Pariangan.
Gamping”, He stated there was a significant differences in students’ writing competency between the students who taught by Story Mapping Tehnique and conventional strategy in every aspect. The students feel easier in develop their ideas; they also know what their role as a writer. So, they get better score than those who taught by conventional strategy.
Then, the result of this research finding was also relevant with Annisa Purwaning Sayekti (2014) in her study about “Using Story Mapping to Teach
Students’ Writing Ability of Narrative Text”. Based on findings, Story Mapping Technique is a useful to help studentsin getting ideas, organizing them and developing the ideas.