Using Social Network Analysis to Analyze
Collaboration in Batik Smes
Authors: Ade Iriani, Satya Wacana Christian University,
As a creative industry, batik industry should always create a breakthrough in the form of innovative batik motifs to attract buyers. Manufacturers of batik in Indonesia are batik SMEs with very simple organization and management. However, they are in a competitive business environment that threatens their survival.
In order to continue to create innovative products, collaboration of employees in batik SMEs is absolute important. Collaboration between individuals is more likely to occur in the patterns of informal relationships rather than in formal ways.
This article examines and analyses the patterns of informal relations in Winda Sari batik. Winda Sari batik SME is one of big SMEs in Sragen. Using Social Network Analysis (SNA) for analysis, the results of this study indicate that the relationships between individuals are highly dependent and focused on the specific individuals as intermediaries.
In addition, there are patterns of relationships in the subgroups, or cliques, which have only a few numbers of members. In addition, the relationships appear to be one-way relationships than reciprocal relationships. This kind of relationships is less support to collaboration.
Introduction
Batik industry in Indonesia has a strategic position, since the industry absorbs a large number of labors. There are many regions in Indonesia that produce batik; however, the largest is in Java. According to the Ministry of Industry and Trade, in the year 2011 there were 39,600 batik business units absorbing 165,000 workers. While total export reached Rp 4 trillion and supplies of batik raw materials valued at Rp 1.8 trillion [1]. Moreover, people can wear batik clothes in formal and informal occasion.
Batik strategic position not only represents the business, but also reflects the struggle of local cultural richness in the middle of global cultural expansion. Batik expresses local cultural identities, which are not motif expressions solely, but also ethos, spirit, service, and sincerity to serve. When family members are involved in completing the work of other family members, they actually put aside their personal interests to serve the interests of the company [2].
The strategic position of batik is incompatible with the industrial structure of SMEs and the ability of their management and production. The main problem with the structure of the batik industry is that it is a home industry done by the traditional SMEs. As a creative industry, batik SMEs should always create a breakthrough in the form of innovative batik motifs to attract buyers and to compete with other garment industries. However, such structures do not exist in the structure of batik SMEs. In addition to inadequate human resources, there are also some other issues such as capital, raw materials, marketing, partnerships, and technology [3] [4].
Some studies also show that the performance of the batik industry is still unstable. Batik industry requires long production time, and economically less attractive to investors who need quick return [5]. The same has been raised by [6] who refers to the slow development of batik in Lasem, the Sub-District of Pancur in Rembang Regency. However, in fact, beyond estimation of many people, batik industry is able to make breakthroughs in the design and survive. The breakthrough is not only in terms of design, but also in color and coloring materials. In terms of colors, there is a shift in the pattern early batik toward a more varied pattern. Such changes indicate the presence of innovations in batik design.
commitment to innovation [7]. Innovation is not only a deliberate action to generate new ideas, but also the introduction and implementation of new ideas, all aimed at improving organizational performance. In batik industry, innovation includes what they do to make a new technique, motive and coloring on batik cloth [8].
Innovation and collaboration are the two mutually support one another. The extent to which members of the organization is integrated in a network of personal relationships affect organizational innovation. Formal and informal collaborations in the organization reveal the structure of innovation in organizations and provide opportunities for leaders of organizations to conduct formal intervention in order to affect the network structure of employees in the innovation network [9]. The leader of an organization who is able to exploit the structure of formal and informal organizations can reduce costs, improve efficiency and create innovation. In addition, the disclosure of network characteristics of high performing employees can provide an opportunity to identify other employees who have the similar role in the network and at the same time encouraging their contribution to the company [10]. Though the development of innovative behavior of employees contribute to improving the efficiency and effectiveness of the organization, little is known about the innovative behavior in the context of small and medium enterprises (SMEs). Human resource managers who are able to develop innovative behavior of employees will create opportunities to align employee behavior with organizational goals [11].
The purpose of this article is to explain the behavior of informal relationships in Winda Sari batik SMEs in Sragen. Using Social Network Analysis (SNA) this research analyzed and plotted patterns of informal relationships.
Literature review
Batik
data in 2011, there were 4,702 batik business units in Sragen, which employed 8,524 workers. While the number of batik production in 2011 was 950,000 meters [12].
Beside the issue of capital, other biggest challenge in batik industry is human resources regeneration. Interests of young workers who want to work in this sector continually decreased [13]. In addition, there is competition from the apparel industry, and batik imports from ASEAN countries and China. Apparel industry (garment) has an advantage in the form of production speed and dynamically adaptability to the global trend. On the other, batik is a handcrafted industry with traditional local motifs. The greater challenge will come from the implementation of AFTA-China 2015. Invasion of batik imports from ASEAN countries and China will increase the intensity of competition [14].
Social network analysis (SNA)
Currently a social network analysis tool is increasingly important for organizations to understand the relationship between the patterns of employee interactions with business outputs, such as job performance, job satisfaction, adoption of new ideas or technologies [15] [16] [17][18].
A social network is a social structure consisting of individuals. In a social context, a network composed of nodes in the form of individual, organization, or equipment such as computers. A node can have one or more connections. The connections can represents, such as friendship, kinship, common interest, or belief. The social network analysis examines the structure of social relations within a group to uncover the informal relationships between people. In mathematical terms, the network refers to a graph structure to represent people or objects as nodes and relationships as edges that can be directed or undirected relationships.
To analyze a social network, SNA provides some measurement tools include:
• Degree centrality. This centrality measures the number of direct relationships possessed by an actor in a network. If the network is a directed network (relationships have a direction), then the degree centrality has two separate measures, namely in degree and out degree. In degree is the number of incoming connections to the node, and out degree is the number of relationships that come out of the node.
• Closeness centrality. This centrality indicates the speed of information or knowledge transferred. Closeness centrality is the most important measurements in the network [20]. This measure calculates the average number of steps required by an actor to reach others in the network. An actor who has a high closeness centrality is the most efficient actor to make contact with others in the network [21] [22]. In other words, the higher the closeness centrality of an actor, the better the position of the actors in the dissemination of information to other actors [23].
• Betweenness centrality. This centrality measures the number of shortest paths from all nodes to all other nodes that pass through the node. In other words, this measure shows the ability of an actor to control the information, due to his/her position in the network [23] [21].
Methodology
This study uses the saturation sampling technique to collect data. This method is very useful because the data were collected from all individuals along with their relationship. The advantage of this method is to allow a detailed analysis of all individuals and their location in the network as well as the accompanying attributes. This method has limitations in terms of just used to examine the small-sized organizations [24].
Results of the questionnaire were tabulated into two matrices, relationships and attributes. The data then were analyzed using UCINET 6 program and NetDraw. Both of these applications are developed by Borgatti, SP, Everett, MG and Freeman, LC 2002 at Harvard University as an Analytic Technology.
Results and Discussion
Degree Centrality
Most Influential actors (out-degree)
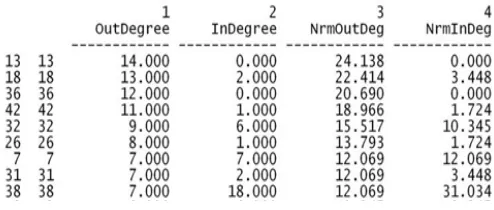
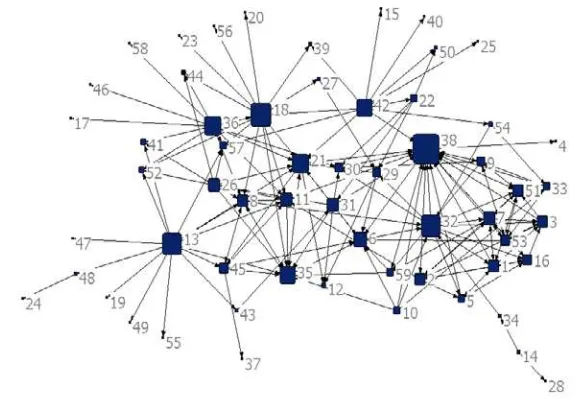
Figure 1 shows the results using UCINET. The result indicates that Actor # 13 has the highest out-degree. Regardless of what information was given and to whom the information was given, this actor can be considered as the most influential actors in the entire network.
Recognition of Actor Position (in-degree)
In Figure 1, actor # 38 is the most known and recognized in the network seen from the number of in-degree. This indicates the willingness of sharing information from other actors in the network with this actor. Their willingness indicates an act of recognition or respect for the position of the actor.
Figure 1: Degree centrality scores for several actors
Figure 2: Distribution of actor’s degree centrality scores
Degree distribution of Actors
The following analyzes distribution of degree centrality in the network (Figure 2):
• Mean: The average degree of actors in the network is 3.051, which is quite low. This figure means that on average each actor only had three relationships with others.
actor # 13, while the minimum number of connection to the outside is zero. This means that there are actors who have absolutely no connection to the outside, only receiving without giving information to another party. For incoming relationship (InDegree), the maximum value is 18, while the minimum value is zero. This means that there are actors who only give information but do not receive information from the other party. From OutDegree and InDegree, the range of minimum and maximum values for InDegree is somewhat higher than the range of the minimum and maximum values for OutDegree. This suggests that in this network, actors prefer to receive rather than give information. In other words, the number of actors who receive information is more than the number of actors who give information.
• Standard Deviation and Mean: Standard deviation and mean indicate whether the population is homogeneous or heterogeneous in terms of their variability. To determine the variability (or the coefficient of variation), the standard deviation is divided by the mean value and multiplied by 100. The coefficient of variation for out-degree is 119, while for in-degree is 102. From these two figures, it is clear that the population is very heterogeneous both for out-degree (influence) as well as for in-out-degree (recognition).
• Graph centralization measures. Graph centralization describes the population as a whole. It describes whether there is a centralization of actors in the network. In a network with a star topology, actors are centralized to a particular actor. In other words, all the actors, but one, have degree centrality 1, while the actor at the center of the network has a degree centrality in accordance with the number of actors minus one. From the Figure 2, Out-degree graph centralization is 20% and in-degree graph centralization is 27% of the theoretical maximum.
Figure 3: Relationships between actors based on their degree centrality
Closeness Centrality Measures
Closeness centrality measures the speed of information transfer in the network. Measurement of closeness is different from the measurement of degree centrality. Degree centrality takes into account only the direct relationships an actor has, and ignores the indirect ties to all other actors. Closeness centrality calculates the distance from an actor to all other actors in the network.
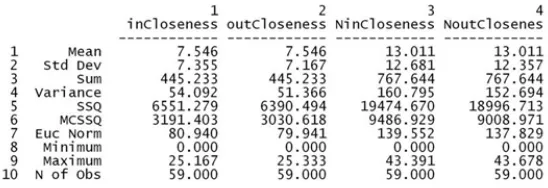
In Figure 4, Incloseness indicates distance from other actors in the network to an actor. While Outcloseness shows the proximity of an actor to other actors in the network. Incloseness and Outcloseness differ because there are asymmetrical relationships in sending and receiving information. From Figure 4, actor # 38 has the greatest Inclosesness and Outcloseness, 25.167 and 13.333 respectively. These figures indicate that the actor # 38 has a close proximity to other actors in the network, as well as the proximity of other actors to his (her) position. In other words, actor # 38 has a favored position in the network, because he (she) can reach other actors, or other actors can reach him (her), more quickly.
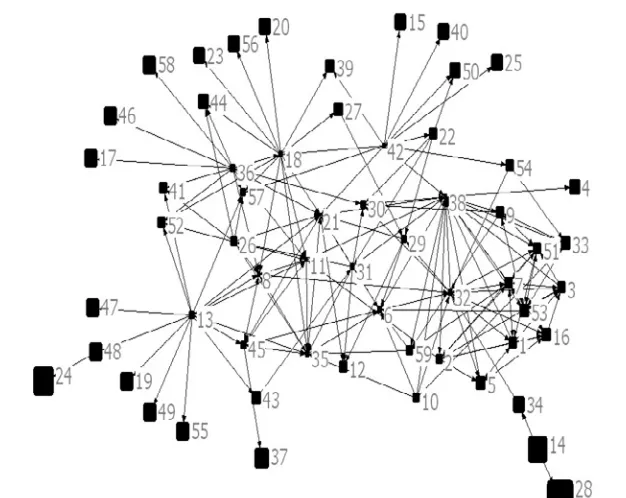
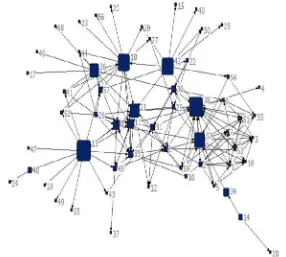
by the network in-centralization (62.35%) and network out-centralization (62.94%). This means that the distance of an actor to other actors is almost the same as the distance of the other actors to the relevant actors in the network. Figure 6 shows the sociogram based on the closeness centrality. Sizes of the nodes are proportional to their closeness centrality values.
Figure 4: Closeness centrality scores for several actors
Figure 6: Relationships between actors based on their closeness centrality
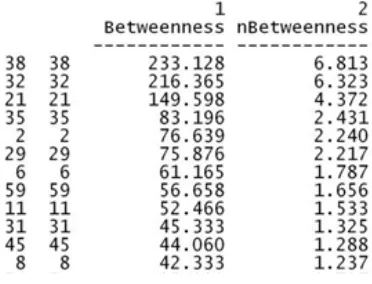
Betweenness
Betweenness centrality considers the position of an actor as being in a favored position to the extent that the actor falls on the paths between other pairs of actors in the network. In other words, the more people depend on an actor to make connections with other people, the more power the actor has.
betweenness centrality. Sizes of the nodes are proportional to their centrality values.
Figure 7: Betweenness centrality scores for several actors
Figure 9: Sociogram indicates the relationships between actors based on their betweenness centrality
Reciprocity
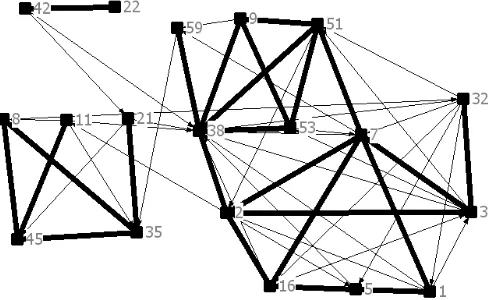
Reciprocity shows the interrelationships between pairs of actors. In the network, the double-headed arrow indicates the existence of a reciprocal relationship where people give and receive information at the same time. This type of relationship is closer to the information (knowledge) sharing between actors. On the other hand, one-way relationship, showed by single-headed arrows in the network, indicates a transfer of information or knowledge from an actor to another actor. To improve collaboration among employees, the reciprocal relationship is more preferable than the one-way relationship.
to simplify the diagram. As shown in this picture, the reciprocal relationships are focused on a few actors, namely actors # 7, # 35, and # 38.
Figure 10: Diagram shows reciprocal relationships (thick lines) between actors
Cohesive Subgroups
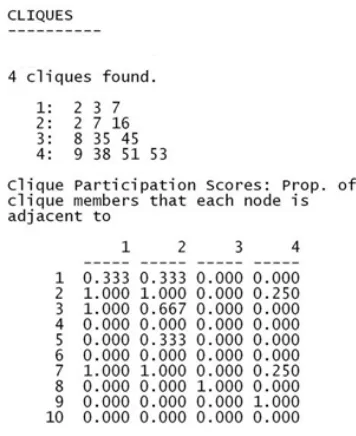
A network often has one or more subgroups or cliques. A clique on a network has members who have a closer relationship to each other than their relationships with other actors who are not members of the group. A clique can have different norms of the overall network.
Figure 11 shows four cliques in Winda Sari employees. The clique participation score (Figure 11) indicates the proximity of an actor to a clique. An actor who has clique participation score equal to one means that the actor is the member of the clique, while a score less than one indicates that the actor is not the member.
Interesting to note that of the four cliques, only clique 4 contains actor #38 who is the actor with the highest centrality. Clique 4 has other members, namely actors #9, #51 and #53. This means that though actor #38 has a good position in the network, however the actor prefers to have closer relationships with actors #9, #51 and #53. In addition, the four cliques do not include the owners, namely actor #12, #6, and #4, except actor #35. Similarly, actor #21 (the quality control manager) also is not a member of the cliques.
Figure 11: Calculation indicates four cliques in the network
Conclusions
The above analysis has showed the use of SNA in analyzing and mapping the patterns hidden in informal interactions. The management of organization very often does not know the presence of the patterns.
Analysis using SNA concluded that the relationship between actors in Winda Sari is weak. Several factors support to this conclusion.
the reciprocal relationships. Finally, there is the presence of some clique or subgroup with a limited number of members. The patterns of relationships like that, of course, less support to better collaboration.
Acknowledgment
I would like to thank for the help the Ministry of Education and Culture, the Coordinator of Private Higher Education Region VI. This research is part of my doctoral research that is funded through a research grant no 001/K6/KL/SP/2013.
References
[1] Solopos,( 2013), Unit Usaha Batik Tumbuh Pesat (Batik Business Unit Growing Rapidly). Solopos.com, 19 Oktober 2012.
http://www.solopos.com/2012/10/19/unit-usaha-batik-tumbuh-pesat-340303 Accessed August 1
[2] F.W. Kellermanns, K.A. Eddleston, R. Sarathy, and F. Murphy. (2010), Innovativeness in Family Firms: a Family Influence
Perspective, Small Business Economy, DOI 10.1007/s11187-010-9268-5
[3] C.T. Setyorini, M. Pinasti, and H. Rokhayati, (2013), Strengthening
the Internal Factors of Batik Cluster SMEs in Indonesia: A Case of Six Districts in South - Central Java, International Journal of Business, Humanities and Technology. Vol. 3 No. 1; January 2013
[4] S. Sinaga, (2012), Utilisation of intellectual property rights by Indonesian Small and Medium Enterprises: a case study of challanges
facing the Batik and Jamu industries, PhD Thesis, University of
Wollongong.
http://ro.uow.edu.au/cgi/viewcontent.cgi?article=4522&context=the ses
[5] A. Hayati, (2007), Pengaruh Faktor Sosial, Ekonomi dan Budaya Terhadap Kewirausahaan Batik Garutan (Effects of Social, Economic
and Cultural factors on Entrepreneurship of Batik Garutan), Paper
http://pustaka.unpad.ac.id/wp-content/uploads/2009/05/pengaruh_faktor_sosial.pdf Accessed March 10, 2013.
[6] Y.P. Aribawa, Analisis Tenaga Kerja Industri Batik Tulis Lasem di
Kecamatan Pancur Kabupaten Rembang (Workforce Analysis of
Lasem Batik Industry at Sub-district Pancur in Rembang Regency). Skripsi. Univ. Muhamadiyah. Surakarta.
http: //etd.eprints.ums.ac.id/5008/2/E100040005.PDF Accessed March 12, 2013
[7] S. Kraus, M. Pohjola, and A. Koponen. (2011), Innovation in Family Firms: an Empirical Analysis Linking Organizational and Managerial
Innovation to Corporate Success, Review Management Science. Rev
Manag Sci (2012) 6:265–286. DOI 10.1007/s11846-011-0065-6
[8] Susminingsih, (2013), Culture and Family Firm Values: Case of Batik
Industry, The 2013 IBEA, International Conference on Business,
Economics, and Accounting 20 – 23 March 2013, Bangkok – Thailand [9] H.L. Aalbers, (2012), Organizing Intra-Organizational Networks for
Innovation, PhD. Dissertation. University of Groningen, Groningen,
the Netherlands. irs.ub.rug.nl/dbi/505b1724badc7. Accessed November 7, 2013
[10] R. Cross, P. Gray, S. Cunningham, M. Showers, and. R.J. Thomas, (2010), The Collaborative Organization: How to Make Employee
Networks Really Work MIT Sloan. October 01, 2010.
http://sloanreview.mit.edu/article/the-collaborative-organization-how-to-make-employee-networks-really-work Accessed November 1, 2013
[11] M. Xerri. & Y. Brunetto, (2011), Fostering the Innovative Behaviour of
SME Employees: A Social Capital Perspective, Research and Practice
in Human Resource Management, 19(2), 43-59
[12] Bappeda Sragen, (2011), Sragen Dalam Angka 2011(Sragen in Numbers 2011), http://bappeda.sragenkab.go.id/home.php?page=28. Accessed August 1, 2013
[13] M.S. Hidayat, (2009), Regenerasi pembatik sangat minim
(Regeneration of batik is very minimal). Harian Kompas, (25 July 2012)
[14] Darmansyah and D. Soebagyo, (2010), Batik Stimulus Ekspor
Performance of Batik Companies). Jurnal Ekonomi Pembangunan Volume 11, Nomor 2, Desember 2010, hlm.254-265
[15] R. Some, (2013), A Survey on Social Network Analysis and its Future
Trends. International Journal of Advanced Research in Computer
and Communication Engineering Vol. 2, Issue 6, June 2013
[16] P. Burton, Y.A. Wu, and V.R. Prybuto, (2010), Social Network Position and Its Relationship to Performance of IT Professionals,
Informing Science: the International Journal of an Emerging Transdiscipline Volume 13, 2010
[17] M.M. Akhter, M.N. Siddique, A. Al Masum, (2011), Analysis of Social Network and its Effect on Job Satisfaction and Employee
Performance, ASA University Review, Vol. 5 No. 1, January–June, 2011
[18] H.C.Huang, L. Davy, and H.Y. Shih, (2010), Accelerating Knowledge
Adoption: A Perspective of Social Network Analysis. PICMET 2010
Proceedings, July 18-22, Phuket, Thailand
[19] R. Cross, A. Parker, L. Prusak, & S.P. Borgatti, (2001), Knowing What We Know: Supporting Knowledge Creation and Sharing in Social
Networks. Organizational Dynamics 30(2): 100-120. [pdf]
[20] S.P. Borgatti, (2005), Centrality and network flow. Social Networks. 27(1): 55-71
[21] L.C. Freeman, (1979), Centrality in social networks: Conceptual clarification. Social Networks, 1(3), 215–239
[22] E. Costenbader and T.W. Valente, (2003), The stability of centrality
measures when networks are sampled. Social Networks 25 (2003)
283–307
[23] Stanley Wasserman & Katherine Faust, (1994), Social Networks
Analysis: Methods and Applications. Cambridge: Cambridge
University Press. A short, clear basic summary is in Krebs, Valdis. (2000). The Social Life of Routers. Internet Protocol Journal, 3 (December): 14–25
[24] N. Lin, (2001), Building a Network Theory of Social Capital. in Social
Capital. Theory and Research. Lin, N., Cook, K., and Burt, R.S.