Efficiency of Small- and Medium-sized Tofu
Enterprises (SME) in Salatiga using Data
Envelopment Analysis (DEA)
Purwanto
Master of Information Systems Faculty of Information Technology, Satya Wacana Christian University,
Indonesia
Danny Manongga
Faculty of Information Technology, Satya Wacana Christian University,Indonesia
M.A. Ineke Pakereng
Faculty of Information Technology, Satya Wacana Christian University,Indonesia
ABSTRACT
The rise of US Dollars exchange rate to Rupiah in September 2013 has had an impact on all industries in Indonesia, especially tofu enterprises. The rising prices of raw materials require them to have an ability to survive and remain competitive. Productivity is one of the main indicators to estimate the ability to survive and compete. They have to be able to maximize the output utilizing the limited resources (input). Data Envelopment Analysis (DEA) using Banxia Frontier Analysis 3 Software helps to evaluate relative productivity of several Small and Medium-sized Enterprises (SME). The samples of this research are 31 of 66 Tofu SMEs in Salatiga. Constant Return to Scale (CRS) and Variable Return to Scale (VRS) models oriented in the output were used in this research. The finding shows that 2 SMEs were efficient in overall, 4 SMEs were efficient in scale, 8 SMEs were technically efficient and 23 SMEs were inefficient. For those which are inefficient can refer to the efficient SMEs to improve their efficiency by lessening input factors and maximizing output factors.
General Terms
Computer Science
Keywords
SME, Efficiency, Data Envelopment Analysis, Frontier Analyst, Mathematic Programming, Operation Research.
1.
INTRODUCTION
The rise of US Dollars exchange rate to Rupiah in September 2013 has had an impact on all industries in Indonesia, especially tofu enterprises. The demands of soybeans, as the raw materials of tofu, increase each year. However, the local soybeans cannot fulfill the demands. From 2010 to 2014, local soybean productivity could only fulfill 851,286 tons out of ± 2,300,000 tons of dried seeds demands per year; accordingly the governments have to import the soybeans from other countries. Whereas, it causes disadvantages for Indonesia: loss of considerable foreign exchange, lack of employment opportunities, and the increase of long-term dependency [1].
Salatiga has tens of SMEs, especially Tofu enterprises. Inevitably, they were affected by the rise of soybean price that will reduce their profit. For that reason, they are required to have an ability to survive and remain competitive. Productivity is one of the main indicators to measure the ability to survive and compete. Generally, productivity is seen from financial ratio, where it becomes the turning point in an enterprise performance measurement. Estimating or assessing performance is an act of judgment on various activities in one organization’s value chain [2]. Unfortunately, financial ratio measurement only describes the financial
position not the use of enterprise’ limited resources (input) toward the output.
For that reason, it is necessary to have an analysis that considers how the enterprises have an ability to maximize their resources. Charnes, Cooper and Rhodes (1978) developed linier programming technique called DEA [3], mathematic and non parametric programming model for relative productivity of one group using some input and output data which are relatively the same [4].
DEA method was used in this research to analyze the efficiency of Tofu SME based on the input and output data of Tofu SME in Salatiga. The finding of the research helps inefficient SMEs in terms of productivity to have an ability to work more productively by referring to the efficient SMEs with good performance.
The research explains 1) how the level of technical efficiency, revenue efficiency, allocative efficiency and economic efficiency of each Tofu SMEs in Salatiga are, 2) what variables constitutes the causes of inefficiency, 3) the paces to gain the efficiency of Tofu SMEs.
2.
LITERATURE REVIEW
2.1
The Previous Studies
Qomarudi (2011) conducted a research aimed at 1) measuring the technical efficiency, revenue efficiency, allocative efficiency and economic efficiency of Batik SMEs, 2) Identifying what variables constitutes the causes of each Batik SMEs inefficiency, and 3) Finding the solution of the inefficiency problems. DEA was used where the input data were employees, batik-wax, garment, dye, and the output data were batik products. The finding showed that 12 SMEs were technically efficient and 23 SMEs were inefficient. Raw materials variable was blamed to be the cause of inefficiency. For that reason, to be efficient, the inefficient SMEs could adjust actual value to target value based on the recommendation of DEA analysis result [5].
The differences of this research compared to the previous researches are this research was conducted in Tofu SMEs in Salatiga. DEA methods used are CCR/CRS and BCC/VRS oriented in the output with Banxia Frontier Analyst 3 software for data-processing. It generated efficiency value, peer group, and recommendation for inefficient DMUs.
2.2
The Definition of SME
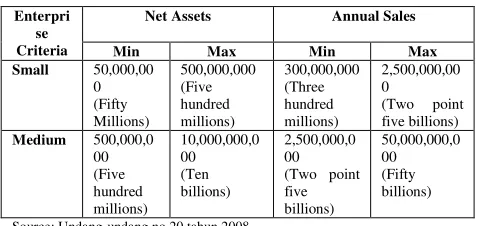
Small- and Medium-sized Enterprise (SME) is an independent productive economic enterprise, run by individual proprietor or a venture which is not a subsidiary, owned, managed, and directly or indirectly part of bigger enterprises based on SME criteria with criteria of the total net assets or annual sales revenue in accordance with the law [7]. Table 1 shows the criteria of net assets and sales revenue for SME according to the Law.
Table 1: SME Income Criteria
Enterpri se Criteria
Net Assets Annual Sales Min Max Min Max
Source: Undang-undang no 20 tahun 2008
SME constitutes one main pillar of national economic that should get the first opportunity, and possible development as the form of alignments to people’s priority economy [8].
2.3
Performance and Efficiency Measurement
Business efficacy that aligns the purpose and the strategy of the company will determine the success of the company. One way to gain that thing is to improve company’s performance incrementally. Performance constitutes the ability to apply the strategy effectively to ensure that the purpose designed can be achieved. All companies aim at achieving efficiency point in order to earn maximum profit. Therefore, it is necessary to maximize the resources. How is a particular input possible to gain the maximum profit? An enterprise will be called as efficient when: 1) that enterprise is able to minimize the expenses without decreasing the output produced, 2) that enterprise is able to produce the maximum output with the same expenses [9].
Efficiency constitutes a measurement of efficacy on resource/cost scale to gain the output for the activity run. There are three dimensions of efficiency general concept: expense, revenue, and profit efficiency [10][11]. Efficiency is ratio between the output and the input of the process, focusing on input consumption [12]. Efficiency is an act of maximizing the output using limited employment, materials, and equipments [13]. It consists of three components: technical efficiency, allocative efficiency, scale efficiency and economic efficiency [14]. Technical Efficiency is a combination of capacity and ability of economic unit to produce the maximum output from a number of input and technology. On the other hand, allocative efficiency is the ability and availability of economic unit to operate at the level of marginal product value. It is the same as marginal cost, MVP=MC [15].
According to Farrell (1957) technical efficiency is an act of maximizing output using a particular input and allocative
efficiency is maximizing the input. The combination of both efficiencies is the economic efficiency [16][17]. Both input and output orientation can be used for efficiency measurement. From the efficiency measurement point of view, input- and output-oriented models can be distinguished. The input-oriented model aims at minimizing inputs while maintaining outputs constant, while the output-oriented one focuses on maximization of outputs and still utilizing the input levels specified originally [18].
Ratio between input and output can be used and it is often to use regression approach, frontier approach. Some financial institutions measure the performance by focusing on the frontier efficiency or x-efficiency. They measure relative performance by comparing the “best” institution performance to the industries, with the condition that the institutions have the same niche market condition [19][20].
Frontier efficiency is superior for some financial ratio standard from financial report such as return on asset/revenue ratio. It is because the use of programming or statistical techniques which omit the difference effect inside input price and exogenous factor influencing standard performance (ratio). Parametric and non-parametric approaches are used. The examples of parametric approaches are: 1) Stochastic Frontier Approach (SFA), 2) Thick Frontier Approach (TFA), 3) Distribution-Free Approach (DFA), and the examples of non-parametric approach are: 1) Data Envelopment Analysis (DEA), 2) Free Disposal Hull [21]. Data Envelopment Analysis (DEA) is used to measure the efficiency with frontier approach using linier programming and econometric methods: 1. Data Envelopment analysis, 2. stochastic frontier [22].
2.4
Data Envelopment Analysis (DEA)
Data Envelopment Analysis (DEA) constitutes one of productivity measurement methods and performance evaluation of one company’s activity using non-parametric approach which is basically linier programming based technique. It was Charnes et al, who first proposed this method in 1978.
CCR Model (Charnes, Cooper, and Rhodes), Constant Return to Scala (CRS), aims to maximize a number of output. It consists of the purpose function which constitutes the number of output maximizing from the enterprises that will be measured their relative productivity and the difference between output and input of all unit measured. The formula of constant return to scale is expressed below:
max
μk,vi
� 0
�
=1
. . 0= 1 =1
� − 0 = 1,…,
=1
�
=1
� �, � = 1,…,�
= 1,…, (1)
CCR model has been developed into variable return to scale (VRS). It assumes that the enterprise does not operate or even has not operated at the maximum scale. This means that the ratio between input and output addition are not the same. In other words, the addition to the input of x times will not cause the output increased by x times smaller or larger. The formula of return to scale variable is expressed below:
max
� � �
=1
0− 0
. . 0= 1
=1
� − − 0 0 = 1,…, =1
�
=1
� �, � = 1,…,� = 1,…, (2)
Where
y = Input of DMU k = pth output
x = Output of DMU i = mth input
vi = non-negative scalars yko= kth input that minimize
cost for DMU
µk= unit price of output k of
DMU
xio= pth input for mth DMU
CCR model reflects multiplication of technical efficiency and scale efficiency, whereas BCC model or VRS reflects technical efficiency only. Therefore, relative scale efficiency constitutes the ratio of CCR/CRS efficiency model and BCC/VRS model [18].
The advantages of DEA method are a) it can deal with numbers of inputs and outputs, b) it doesn’t need the assumption of functional relationship between input and output variable, c) the enterprise will be compared directly to other similar enterprises, d) both input and output may owns different measurement unit [24]. On the other hand, the limitation of DEA are a) it has simple specific attributes, b) it constitutes an extreme point technique, measurement faulty will result fatal impact c) although it is good for estimating Economy Activity Unit relative efficiency, DEA is not appropriate for estimating absolute efficiency d) statistically hypothesis assessment of DEA result is difficult to do e) it uses separate linier programming for each Economy Activity
Unit f) the weight and input resulted by DEA cannot be interpreted into economic value[25].
2.5
Frontier Analyst
The recent DEA researches have had various technological solutions. Software has not been the barrier for DEA application in supporting decision making and benchmarking process any longer [28]. Software applications that can be used for CCR/CRS method and BCC or VRS are classified into commercial and non-commercial. Those are DEA Solver Pro, Frontier Analyst, OnFront, and Warwick DEA for commercial software. DEA Excel Solver, DEAP, EMS, and Pioneer are for non-commercial software. Frontier Analyst is used in this research. It constitutes Banxia’s software that has the most professional interface and documentation for conducting evaluation toward DMU. Frontier Analyst is a windows-based efficiency analysis tool using DEA technique to assess relative performance of organization units that run the same function. Data resources that will have been analyzed are derived from text, excel, spss file, etc. Frontier Analyst is able to give efficiency analysis based on input and output orientation. Besides, it gives the result for CCR and/or BCC. It forms a standard report for efficiency score of DMU, actual vs. target of each DMU, and shows everything about the units thoroughly [29].
3.
THE RESEARCH METHODOLOGY
3.1
Data Identification
Data used is the primer data from tofu enterprises in Salatiga. It is collected by interviewing 31 out of 66 managers of tofu enterprises in Salatiga.
3.2
Data Processing and Analysis
Data Envelopment Analysis (DEA) is used to process and analyze data. Banxia Frontier Analyst 3 application is also used to achieve the target as the productivity improvement toward improvement.
3.3
Data Collecting and Processing
To analyze efficiency tofu SME in Salatiga, input and output data are needed. According to Cooper et al. (2002), a rule exists the must be complied with in order to select the number of inputs and outputs [30].
n ≥ max {m x s, 3 (m + s)} (3) Where:
n = number of DMUs, m = number of inputs, and s = number of outputs
The term DMUs was replaced with SMEs. As for the input and output as of follows:
a. Input Data, They are some resources used by each enterprise to do its production activity. They consist of 4 variables:
Number of employees
The width of production place in square meter
Soybean produced in kg
Production expenses per day in millions (with 2 decimals and rounding up)
b. Output Data, Output data is the achieved result from each enterprise by using the resources (input). It consists of 2 variables:
The amount of sales revenue in millions.
Table 2: The Number of Input and Output of each Tofu Enterprise in Salatiga in 2013 per day
SME
Input Output
Number of Employees (A)
The width of production
place in a square meter
(B)
soybean produced ( C )
Production expenses (D)
The amount of sales revenue (E)
Gross-Profit per day (F) SME1 8 160 500 5,149,092.00 8,400,000.00 3,250,908.00
SME2 3 130 50 844,980.00 965,000.00 120,020.00
SME3 6 300 300 3,270,000.00 4,710,000.00 1,440,000.00
SME4 3 100 100 1,479,672.00 1,736,000.00 256,328.00
SME5 7 1600 300 3,862,032.00 6,600,000.00 2,737,968.00
SME6 5 300 200 2,694,800.00 3,520,000.00 825,200.00
SME7 2 80 100 1,775,973.33 1,880,000.00 104,026.67
SME8 4 200 200 2,653,016.00 3,468,000.00 814,984.00
SME9 3 100 150 1,600,000.00 12,000,000.00 10,400,000.00
SME10 3 7 200 2,254,344.00 3,360,000.00 1,105,656.00
SME11 6 63 450 5,492,720.00 5,550,000.00 57,280.00
SME12 4 120 210 2,294,860.00 3,825,000.00 1,530,140.00
SME13 4 100 200 2,103,160.00 2,655,000.00 551,840.00
SME14 4 80 100 1,362,844.00 1,760,000.00 397,156.00
SME15 2 944 100 1,173,394.00 1,680,000.00 506,606.00
SME16 3 240 100 1,153,344.00 1,470,000.00 316,656.00
SME17 2 70 100 1,193,344.00 1,225,000.00 31,656.00
SME18 3 120 200 2,491,188.00 3,675,000.00 1,183,812.00
SME19 4 88 300 3,444,532.00 6,125,000.00 2,680,468.00
SME20 8 170 280 3,377,944.00 3,808,000.00 430,056.00
SME21 5 140 200 2,176,844.00 3,640,000.00 1,463,156.00
SME22 10 120 200 3,226,844.00 3,760,000.00 533,156.00
SME23 10 120 300 4,993,736.00 5,250,000.00 256,264.00
SME24 5 28 250 3,171,594.00 3,220,000.00 48,406.00
SME25 2 64 100 1,243,844.00 1,496,000.00 252,156.00
SME26 6 12 200 2,931,160.00 2,940,000.00 8,840.00
SME27 5 120 400 4,111,048.00 5,160,000.00 1,048,952.00
SME28 3 81 200 1,853,024.00 2,497,500.00 644,476.00
SME29 4 400 300 3,460,640.00 5,250,000.00 1,789,360.00
SME30 9 100 400 4,830,280.00 7,584,000.00 2,753,720.00
SME31 3 50 60 843,776.67 942,000.00 98,223.33 Source: processed data
4.
FINDINGS
4.1 Data Analysis
The data on Table 2 was calculated using DEA method with Banxia Frontier Analyst 3 software application. SME will achieve relative efficiency when it reaches score of 1 or 100% and will be getting more inefficient when it is getting away from the value of 1 or 100%. The result of SME efficiency value based on CRS, VRS and Scale, will be shown more detail on Table 3.
Table 3: Relative Productivity Value of each SME
Unit CRS VRS Scale RTS
SME1 38.03 70.00 54.33 increasing
SME2 24.12 100.00 24.12 Constant
SME3 19.62 39.25 49.99 increasing
SME4 21.70 27.72 78.28 decreasing
SME5 27.50 55.00 50.00 increasing
SME6 22.00 29.33 75.01 increasing
SME7 23.50 100.00 23.50 constant
SME8 21.67 28.90 74.98 increasing
SME9 100.00 100.00 100.00 constant
SME10 100.00 100.00 100.00 constant
SME11 49.24 64.82 75.96 increasing
SME12 25.91 31.87 81.30 increasing
SME13 21.09 22.12 95.34 increasing
SME14 22.00 29.48 74.63 Decreasing
SME15 21.00 100.00 21.00 constant
SME16 18.37 26.86 68.39 decreasing
SME17 15.31 100.00 15.31 Constant
SME18 30.62 30.62 100.00 Increasing
SME19 51.96 56.27 92.34 Increasing
SME20 18.37 31.73 57.89 Increasing
SME21 22.75 30.33 75.01 Increasing
SME22 25.64 31.33 81.84 increasing
SME23 32.82 43.75 75.02 increasing
SME24 52.56 60.63 86.69 increasing
SME25 19.35 100.00 19.35 constant
SME26 76.16 76.87 99.08 increasing
SME27 32.94 43.00 76.60 increasing
SME28 24.40 24.40 100.00 increasing
SME29 32.81 43.75 74.99 increasing
SME30 49.49 63.20 78.31 increasing
SME31 19.62 100.00 19.62 constant
Figure 1: Overall Efficiency Graph
Figure 2: Technical Efficiency Graph
Figure 3: Scale Efficiency Graph
SME distribution based on CRS and VRS model is shown by this graph:
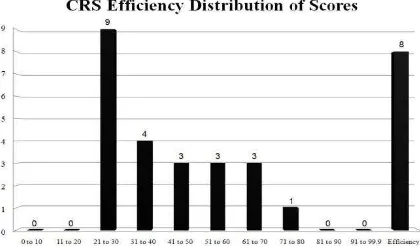
Figure 4: The Graph of CRS Efficiency Distribution
Figure 5: The Graph of VRS Efficiency Distribution
According to table 2, figure 3, 4, and 5, relative productivity value of each SME was analyzed one by one. SME9 and SME10 were overall, technically and scale efficient enough with the value of 100%. Based on return to scale result, SME9 and SME10 were at a constant condition. It means that they are efficient. Therefore, it is unnecessary to analyze their potential improvement. On the other hand, SME2, SME7, SME15, SME17, SME25, SME31 were overall and scale inefficient. However, they were technically efficient (100%). Based on return to scale result, SME2, SME7, SME15, SME17, SME25, SME31 were at constant condition that means efficient. Therefore, it is unnecessary to analyze their potential improvement.
4.2. Improvement Scenario based on
Efficiency score
As detected that DEA is able to give improvement value to inefficient units. Here are SMEs that need to be analyzed their potential improvement: SME1, SME3, SME5, SME6, SME8, SME11, SME12, SME13, SME18, SME19, SME20, SME21, SME22,SME23, SME24, SME26, SME27, SME28, SME29, and SME30 where they were technically, scale, and overall inefficient. Based on return to scale result, they were at increasing condition. This means that it is still possible to improve their input utilization in order to get maximum output. It can be seen from Table 4.
Table 4: Recommendation for inefficient SMEs in increasing condition
SME 1 Recommendation
SME1 Improve gross-profit up to 425% per day
Improve their revenue up to 162%
Lessen production expenses up to 2%
Decrease the amount of soybean up to 8%
SME3 Improve gross-profit up to 1,344% per day
Improve their revenue up to 409%
Lessen production expenses up to 2%
Decrease the width of production place up to 33%
SME5 Improve gross-profit up to 659% per day
Improve their revenue up to 263%
Lessen production expenses up to 17%
Decrease the number of employees up to 14%
Decrease the width of production place up to 87%
SME6 Improve gross-profit up to 1,580% per day
Improve their revenue up to 354%
Lessen production expenses up to 20%
Decrease the number of employees up to 19%
Decrease the width of production place up to 55%
SME8 Improve gross-profit up to 1,601% per day
Improve their revenue up to 361%
Lessen production expenses up to 19%
Decrease the width of production place up to 33%
SME11 Improve gross-profit up to 12,309% per day
Improve their revenue up to 103%
Decrease the amount of soybean up to 16%
SME12 Improve gross-profit up to 719% per day
Improve their revenue up to 285%
Lessen production expenses up to 2%
Decrease the amount of soybean up to 1%
SME13 Improve gross-profit up to 1,800% per day
Improve their revenue up to 374%
Decrease the amount of soybean up to 2%
Decrease the number of employees up to 8%
SME18 Improve gross-profit up to 778% per day
Improve their revenue up to 226%
Decrease the amount of soybean up to 25%
Lessen production expenses up to 35%
Decrease the width of production place up to 16%
SME19 Improve gross-profit up to 248% per day
Improve their revenue up to 92%
Decrease the amount of soybean up to 25%
Lessen production expenses up to 28%
SME20 Improve gross-profit up to 4,002% per day
Improve their revenue up to 444%
Lessen production expenses up to 11%
Decrease the number of employees up to 31%
SME21 Improve gross-profit up to 847% per day
Improve their revenue up to 339%
Lessen production expenses up to 1%
Decrease the width of production place up to 4%
Decrease the number of employees up to 19%
SME22 Improve gross-profit up to 2,248% per day
Improve their revenue up to 290%
Lessen production expenses up to 33%
Decrease the number of employees up to 61%
SME23 Improve gross-profit up to 4,863% per day
Improve their revenue up to 204%
Lessen production expenses up to 34%
Decrease the number of employees up to 46%
SME24 Improve gross-profit up to 6,772% per day
Improve their revenue up to 90%
Lessen production expenses up to 11%
Decrease the number of employees up to 21%
SME26 Improve gross-profit up to 18,120% per day
Improve their revenue up to 31%
Lessen production expenses up to 23%
Decrease the number of employees up to 49%
SME27 Improve gross-profit up to 1,107% per day
Improve their revenue up to 203%
Lessen production expenses up to 27%
Decrease the amount of soybean up to 31%
SME28 Improve gross-profit up to 1,219% per day
Improve their revenue up to 309%
Decrease the amount of soybean up to 19%
Lessen production expenses up to 6%,
SME29 Improve gross-profit up to 674% per day
Improve their revenue up to 204%
Lessen production expenses up to 38%
Decrease the width of production place up to 66%
Decrease the amount of soybean up to 33%
SME30 Improve gross-profit up to 295% per day
Improve their revenue up to 102%
Lessen production expenses up to 8%
Decrease the number of employees up to 25%
SME4, SME14, and SME16 have not been efficient technically, in scale an overall. Based on return to scale result, they were at decreasing condition. It means that they should decrease inputs to have constant condition. It was because the use of input is not in proportion to output produced. It can be seen from Table 5.
Table 5: Recommendation for inefficient SMEs in decreasing condition
SME Recommends
SME4 Improve gross-profit up to 2,604% per day
Improve their revenue up to 360%
Lessen production expenses up to 27%
Decrease the number of employees up to 33%
Decrease the width of production place up to 33%
SME14 Improve gross-profit up to 1,645% per day
Improve their revenue up to 354%
Lessen production expenses up to 21%
Decrease the number of employees up to 49%
Decrease the width of production place up to 16%
SME16 Improve gross-profit up to 2,089% per day
Improve their revenue up to 444%
Lessen production expenses up to 7%
Decrease the number of employees up to 33%
Decrease the width of production place up to 72%
Based on the combination result, the greatest factor of inefficiency was gross-profit per day. Therefore, potential improvements that can be done to reach optimum efficiency point are improving gross-profit up to 91.23% and improving the revenue up to 7.17%. From input point of view, the number of employees should be decreased up to 0.46%, the width of production place should be lessened up to 0.54%, the amount of soybean should be decreased up to 0.14% and the production expenses should be decreased up to 0.46%. Thus, SME will be more efficient.
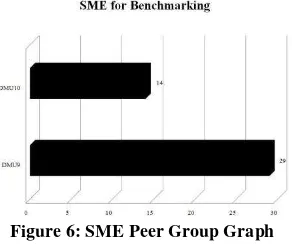
Another advantage of DEA is being able to rank SME in order to find the benchmarking for other SMEs. In other words, DEA is able to give the information about SME that will be the most efficient SME to be referred by inefficient SMEs.
Figure 6: SME Peer Group Graph
The above figure shows that the most SME referred to was SME 9. This SME was referred by 29 inefficient SMEs, while SME 10 was referred by 14 inefficient SMEs. This can be seen from table 6. Peer Group SME
Table 6: SME Peer Group
Peer Group SME
SME 10 SME1, SME11, SME12, SME13, SME19, SME20,
SME22, SME23, SME24, SME25, SME26, SME27, SME28, SME30
SME 9 SME1, SME2, SME3, SME4, SME5, SME6, SME7,
SME8, SME11, SME12, SME13, SME14, SME15, SME16, SME17, SME18, SME19, SME20, SME21, SME22, SME23, SME24, SME25, SME26, SME27,
SME28, SME29, SME30, SME31
5.
CONCLUSION
inputs have been used optimally to produce the maximum outputs. Besides, 4 SMEs were efficient in scale and 8 SMEs were technically efficient. However, 23 SMEs were inefficient. They were 20 SMEs with increasing category and 3 SMEs with decreasing category.
Factors influencing inefficiency are input data such as the soybean availability, production expenses, the width of production place, and the number of employees. Hence, the inefficient SMEs can refer to the efficient one by lessening input data and improving or maximizing output data in order to be more efficient in overall.
6.
REFERENCES
[1] Direktoral Jendral Tanaman Pangan, 2013, Pedoman Teknis Pengelolaan Produksi Kedelai Tahun 2013, Kementrian Pertanian Republik Indonesia.
[2] Yuwono, Sony dan Sukarno, Edy, 2002, Petunjuk Praktis Penyusunan Balanced Scorecard Menuju Organisasi yang Berfokus pada Strategi, PT. Gramedia Pustaka Utama, Jakarta.
[3] Charnes, A., Cooper, W.W., and Rhodes, E.,1978, Measuring the Efficiency of Decision Making Units, European Journal of Operation Research,2,6,429-44
[4] Indrawati Yuli, 2009, Analisis Efisiensi Bank Umum di Indonesia Periode 2004-2007: Aplikasi Metode Data Envelopment Analysis
[5] Qomarudin, 2011, Analisis Efisiensi Usaha Kecil dan Menengah (UKM) Batik Di Desa Kauman Kota Pekalongan Dengan Metode Data Envelopment Analysis (DEA), Fakultas Ekonomi Universitas Sebelas Maret, Surakarta.
[6] Hidayati, Juliza, 2005, Analisis kinerja bank dengan DEA, Jurnal Sistem Teknik Industri Vol 6 no.2 April 2005, Univesitas Sumatra.
[7] Republik Indonesia. 2008. Undang-Undang Nomer 20 Tahun 2008.tentang Usaha Mikro, Kecil dan Menengah
[8] Republik Indonesia. 2013.Peraturan pemerintah No 17 tahun 2013.tentang Pelaksanaan Undang-undang No 20 Tahun 2008 tentang Usaha Mikro. Kecil dan Menengah
[9] Soekartawi, 2001, Pengantar agroindustri, Raja Grafindo Persada, Jakarta.
[10]Andogo, J., Strok, C. &Hasheela, E. 2005. Measuring the alternative profit x-efficiency of Namibia’s banking Sector. Nepru Research Report 36:1-58
[11]Bander, M, K, L., Mohammed. S, Ariff, M. &Hassan, T. 2008, cost, revenue, and profit efficiency of islamic versus conventional bank : international evidence using data envelopment analysis, islamic Economic Studies 15:24-76
[12]Mulyadi, 2007, Sistem Perencanaan dan Pengendalian Manajemen, Salemba Empat, Jakarta
[13]Stoner, J. A. F, 1995,Management, Prentice-Hall International.
[14]Ozcan, Yasar. A, 2008, Health Care Benchmarking and Performance Evaluation “An Assessment using Data Envelopment Analysis (DEA)”, Springer, New York.
[15]Saleh, S, 2000, Metode empiris data envelopment analysis, yogyakarta, pusat antar universitas studi ekonomi.
[16]Farrell, M.J, 1957, The Measurement of Productive Efficiency, Journal of the Royal Statistical sosiety, 120, 253-281.
[17]Coelli, et. al, 2005, An Introduction to Efficiency and Productivity Analysis 2nd, Springer Science + Business Media, Inc.
[18]Slamet, Aam Rusydiana & Tim Smart Consulting, 2013, Mengukur Tingkat Efisiensi dengan Data Envelopment Analysis (DEA): Teori dan Aplikasi, Smart Publishing, Bogor.
[19]Maggie, Xiaoqing Fu. Heffernan, Shelagh, 2007, Cost X-efficiency in China’s banking sector, China Economic Review 18 (2007) 35-53.
[20]Hassan, M. Kabir,, The Cost, Profit and X-Efficiency of Islamic Banks, Department of Economics and Finance, University of New Orleans.
[21]Masyitah, Siti Rahmi, 2009 ,Analisis Efisiensi Unit Usaha Syariah di Indonesia (Metode Data Envelopment Analysis /Dea dan Stochastic Frontier Approach/SFA), TAZKIA Islamic Finance and Business Review Vol 4. No 2, Bogor
[22]Denizer, Cevdet A., et. Al. 2000, Measuring Banking Efficiency in the Pre and Post Liberalization Environment: Evidence Form the Turkish Banking System, World Bank.
[23]Purwanoro, N. 2004. Efiktivitas Kinerja Pelabuhan dengan Data Envelopment Analysis (DEA). Usahawan No 05 th. XXXIII
[24]Retno, Dwi, 2013, Evaluasi Tingkat Efisiensi Dengan Menggunakan DEA (Data Envelopment Analysis), Kompas,http://edukasi.kompasiana.com/2013/06/12/eval
uasi-tingkat-efisiensi-dengan-metode-dea-data-envelopment-analysis-568207.html, diakses tanggal 10 Nopember 2013.
[25]Umri, Nazmil., Hidayat, Rachmad., Dyah, Issa Utami. 2011. Kinerja Efisiensi Biaya dengan metode Data Envelopment Analysis (DEA). Jurnal Teknik Industri. Universitas Trisakti.Jakarta
[26]Boussofiane, A. dkk, 1991, Applied data envelopment analysis, European Journal of Operational Research 52, North-Holland
[27]Ramanathan, R, 2003, An Introduction to data envelopment Analysis : A tool for performance measurement, Sage Publications India Pvt Ltd
[28]Richard S. Barr, DEA Software Tools And Technology, A State-of-Art Survey, department of Engineering Management, Information, and Systems; Southern Methodist University, Dallas, TX75275 USE
[29]Hussain, Asia & Matthew Jones, 2010, An Introduction to Frontier Analyst 4, Banxia Software Ltd.