The internationalisation of the Australian mineral industry in the
1990s
Oliver Maponga
a, Philip Maxwell
b,*aInstitute of Mining Research, University of Zimbabwe and Mineral Economics Program, Western Australian School of Mines, Curtin
University of Technology, GPO Box U1987, Perth, WA 6845, Australia
bMineral Economics program, Western Australian School of Mines, Curtin University of Technology, GPO Box U1987, Perth, WA 6845,
Australia
Received 19 June 2000; received in revised form 18 September 2000; accepted 25 September 2000
Abstract
Overseas mineral exploration and mining investment by Australian companies increased dramatically from the early 1990s until 1997. In the wake of the Asian economic crisis and lower commodity prices it declined somewhat in 1998 and 1999. Reflecting their international competitiveness, Australian resource companies were actively involved in projects in about eighty nations in 1999. This study assesses the extent of growth in exploration and mining operations, the distribution between large and small companies and the changing regional focus which has been occurring. It also reflects on some of the key influences on this develop-ment. These include a strong domestic finance sector, supporting mining services provision, technological competitiveness, a growing attractiveness of offshore locations and increasing structural impediments at home.2001 Elsevier Science Ltd. All rights reserved.
Keywords:Internationalisation; Competitive advantage; Mineral exploration; Mining investment; Diversification; Structural impediments
Introduction
The minerals sector has played an important role in the economic development of Australia. Since the Vic-torian and New South Wales gold rushes of the 1850s there have been a series of other major discoveries which have confirmed Australia’s standing as a world class minerals province. Beginning with the 1960s resources boom, and supported by a continuing series of major project developments, the minerals and energy industry has made a critical contribution to Australia’s recent economic performance. Since the mid-1980s resource extraction has annually contributed around four per cent of Australia’s Gross Domestic Product. When basic metal processing is added to this, the percentage almost doubles. For the past three decades, mineral and energy exports have annually averaged more than 35 per cent of total export receipts.
* Corresponding author. Tel.:+61-8-9266-7757; fax:+ 61-8-9266-3764.
E-mail address:[email protected] (P. Maxwell).
0301-4207/01/$ - see front matter2001 Elsevier Science Ltd. All rights reserved. PII: S 0 3 0 1 - 4 2 0 7 ( 0 0 ) 0 0 0 3 2 - 5
Although their fortunes vary, Australian resource companies also play a significant role in share markets. In early 1998 for example, approximately 100 Australian minerals companies made the top 500 list on the Aus-tralian Stock Exchange. Five AusAus-tralian-based compa-nies — BHP, WMC, MIM, Normandy and North — have regularly appeared in the list of the world’s top fifty mining companies in the recent past.
The expansion and continuing strength of Australian mining since 1965 has occurred during an era when the economic geography of the world’s minerals sector has experienced considerable change. One notable trend has been the absolute decline of Western Europe as a major mineral region and the relative decline of the United States. Stricter environmental legislation and relative resource exhaustion have influenced this change. Struc-tural changes in the world economy more generally have also altered the direction of capital flows. Between the mid-1960s and early 1980s there was major disinvest-ment from developing nations and some developed nations in response to factors such as nationalisation and foreign ownership restrictions.
South Africa received about 60 per cent of world mineral exploration spending. This rose to 80 per cent during the 1980s. Over the past decade there has been a reversal of this trend. By 1997 developing economies, parti-cularly in Latin America, Africa and the Asia Pacific nations were responsible for more than 60 per cent of new mineral exploration and investment. Otto (1998) notes that more than 90 nations have been working on new mining legislation over the past decade. Many of the new statutes have been supportive of foreign min-eral investment.
The recent opening up of many nations to potential mineral and energy exploitation has led to a dramatic internationalisation of companies in traditional mining nations. Australian, Canadian, South African, US and some European companies have been prominent in this movement. The focus of this paper is on Australian-based mining companies. Each year on average since
1995, Australian companies have participated in
resource projects in more than eighty nations. The second section reviews some of the dimensions associa-ted with this movement. Growth in exploration activity and operations, the distribution between large and small companies and a changing regional focus are areas of particular note. Discussion in the third section reflects on some of the factors, which have made Australian min-erals companies internationally competitive. An assess-ment using the “Porter diamond” provides a useful way of reflecting on these factors. Building on this foundation in the fourth section, elements of foreign direct invest-ment, internationalisation and diversification theories furnish some insight into the emerging situation. Some views on future trends in the industry appear in the con-cluding commentary.
The emerging Australian presence abroad
The extent of change
Before the early 1980s, the overwhelming focus of most Australian minerals companies was on domestic operations. A few large companies, including WMC Resources, BHP and MIM, invested abroad. Their oper-ations were in familiar terrain — places such as Papua New Guinea and Fiji. Since the late 1980s, this has changed to encompass other parts of Asia Pacific, Africa, South America and Eastern Europe. The dramatic upsurge in overseas activity began in the early 1990s following the passage of Federal Native Title legislation, and favourable changes in mining statutes in many geo-logically prospective developing nations.
Perhaps the best source of information on these trends since the mid-1990s is a database developed by Minmet Australia. This reports the activities of resource compa-nies listed on the Australian Stock Exchange, but does
not include iron ore, or oil and gas offshore exploration projects. Because several large foreign controlled mining
companies are listed on the Australian exchange,1 it
seems appropriate to exclude these from consideration. The relevant data appear in Table 1. They show the latter stages of the dramatic rise between 1995 and 1997 with new projects increasing by 119 in 1996 and 124 in 1997 to reach a peak of 715. This was followed in 1998 and 1999 by declines of 136 and 122 respectively. The number of overseas projects at the end of 1999 stood at similar levels to those in 1995. The increase in inter-national focus (and the recent decline) by Australian mining companies has been matched by similar trends among Canadian resource companies.
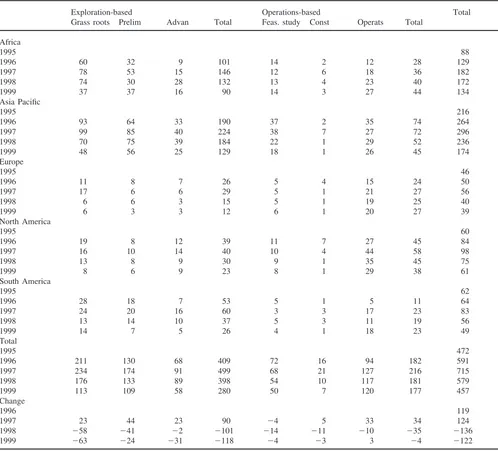
The dramatic movements in the number of projects are attributable in considerable part to changes in explo-ration activity. This shows up clearly in Table 2. The number of exploration-based projects rose by 90 in 1997 to almost 500, before falls of 101 in 1998 and 118 in 1999. Movements in the number of projects in the oper-ational phases — a rise of 34 in 1997, a fall of 35 in 1998 and a fall of four in 1999 were more modest.
An associated indicator of overseas mining activity is the level of exploration spending. Annual surveys for the Minerals Council of Australia since 1987 provide useful data in this area for a constant group of member
compa-nies.2 They show a continuing rise in overseas spending
between 1987/88 and 1996/97. Overseas exploration spending was static in 1997/98 before falling in 1998/99. These data appear in Fig. 1. Of additional note is the observation that the proportion of total exploration spending by these companies overseas rose from 27 per cent in 1986/87 to 45 per cent of their total exploration budgets in 1998/99. Parallel surveys by the Australian Bureau of Statistics since 1992 confirm this trend.
The rise in exploration spending by Australian compa-nies until 1997 and the subsequent fall has occurred more generally. Quoting data from the Metal Economics Group, Allen and Waring (2000) find an apparently larger decline in world mineral exploration in 1998 and 1999 in response to low mineral prices and poor mining company profit levels. Given these more general trends, the Australian commitment to overseas mineral projects remains relatively strong. The peak of exploration spending by Australian-based companies (and those domiciled elsewhere) in 1997 seems a reflection of the
1 Of particular importance in this group are four North American
companies — Placer Dome, Homestake, Battle Mountain and Coeur D’Alene. The large South African company AngloGold, was not listed until the end of the period under observation.
2 Members of this organisation account for more than 80 per cent of
Table 1
Offshore operations of Australian-registered and Australian-based mining companies 1995–1999a
Year Australian-registered companiesb Australian-based companiesc
1995 512 472
1996 636 591
1997 764 715
1998 631 579
1999 517 457
aSource: Minmet Australia (various years) database, Register of Australian Mining. b Listed on the Australian Stock Exchange.
cListed on the Australian Stock Exchange with head office in Australia.
Table 2
The components of overseas activity of Australian-based mining companies 1995–1999
Exploration-based Operations-based Total
Grass roots Prelim Advan Total Feas. study Const Operats Total Africa
1995 88
1996 60 32 9 101 14 2 12 28 129
1997 78 53 15 146 12 6 18 36 182
1998 74 30 28 132 13 4 23 40 172
1999 37 37 16 90 14 3 27 44 134
Asia Pacific
1995 216
1996 93 64 33 190 37 2 35 74 264
1997 99 85 40 224 38 7 27 72 296
1998 70 75 39 184 22 1 29 52 236
1999 48 56 25 129 18 1 26 45 174
Europe
1995 46
1996 11 8 7 26 5 4 15 24 50
1997 17 6 6 29 5 1 21 27 56
1998 6 6 3 15 5 1 19 25 40
1999 6 3 3 12 6 1 20 27 39
North America
1995 60
1996 19 8 12 39 11 7 27 45 84
1997 16 10 14 40 10 4 44 58 98
1998 13 8 9 30 9 1 35 45 75
1999 8 6 9 23 8 1 29 38 61
South America
1995 62
1996 28 18 7 53 5 1 5 11 64
1997 24 20 16 60 3 3 17 23 83
1998 13 14 10 37 5 3 11 19 56
1999 14 7 5 26 4 1 18 23 49
Total
1995 472
1996 211 130 68 409 72 16 94 182 591
1997 234 174 91 499 68 21 127 216 715
1998 176 133 89 398 54 10 117 181 579
1999 113 109 58 280 50 7 120 177 457
Change
1996 119
1997 23 44 23 90 24 5 33 34 124
1998 258 241 22 2101 214 211 210 235 2136
Fig. 1. Exploration spending by Minerals Council of Australia Con-stant Group of Mining Companies 1987/88 to 1998/99 (at 1989/90 prices).
episodic nature of mineral exploration spending dis-cussed previously by Eggert (1988).
Seniors and juniors
The foreign investment push included both large com-panies (often known as “seniors”) and small comcom-panies
(“juniors”).3 Twenty-five of the companies which had
overseas projects at the end of 1997 were large and 125 were juniors. (Resource Information Unit, 1998). The attraction of overseas destinations was so strong that sev-eral new companies were listed on the Australian Stock
Exchange only to pursue foreign activities.4Among this
group several large companies established junior sub-sidiaries to pursue international activities on their
behalf.5 A small group of junior Australian minerals
companies also listed on overseas exchanges to access foreign equity. The Vancouver and Toronto Stock Exchanges were particularly attractive listing desti-nations between 1995 and 1998.
Overseas assets and revenue now make a significant contribution to the profile of many Australian resource companies. Yet the extent of internationalisation varies.
3 In this paper we adopt the convention of market capitalisation
above $A 100 million in 1996/97 as the dividing line between senior and junior companies.
4 In early 1998 this group included Tanganyika Gold, Ghana Gold
Mines, Leo Shield Exploration, and Equinox Resources.
5 In early 1998 examples included Astro Mining and Quantum
Resources (Gutnick group) and Metex Resources and Archean Gold (Delta Gold) and Pacific Wildcats (Sons of Gwalia).
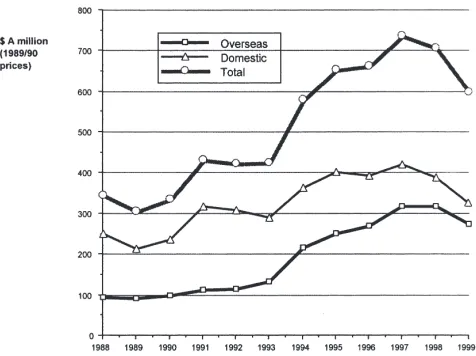
This is reflected in the entries in Table 3, which show changes in the number of other countries in which large Australian resource companies operated in the 1993/94 and 1996/97 financial years and in late 1999. Many of the largest Australian resource companies have extensive international activities. Yet some have maintained a more domestic focus. In line with the decline in explo-ration activity throughout the world after 1997, the num-ber of countries in which these companies operated fell. Casual observation suggests that there is a positive relationship between market capitalisation and the num-ber of countries in which a company operates. Other fac-tors such as the type of commodity extracted, company age and the method of company formation also appear to influence the situation.
During the 1990s, several Australian resource compa-nies also had forced or voluntary de-internationalisation
experiences.6Examples of forced de-internationalisation
included the Westralian Sands (now Iluka Resources) departure from Vietnam and Consolidated Rutile from Sierra Leone.
For many large Australian companies internationalis-ation has been a gradual process. In most cases, compa-nies initially limited their activities to one or two coun-tries within a specific region. They then spread interests to other nations within a region, before finally moving to other regions of the world.
As can be seen in Table 3, several Australian compa-nies embarked on substantial increases in their inter-national activities between 1993/94 and 1996/97. Promi-nent among the group were WMC Resources, North, Normandy, MIM and Newcrest. Each more than doubled the number of countries in which they operated during this period. As argued below, these actions appear to fit in with the so-called “Uppsala-model of internationalis-ation.” This evolutionary theory considers internationa-lisation as an incremental learning process leading to a stepwise increase in commitment in foreign locations. (Andersen, 1993).
While Australian junior companies have played a role in exploration in several emerging mining nations, the prominence of small foreign companies developing pro-jects in these nations is less common. CRU International estimated that juniors were responsible for an average of 27 per cent of the world’s significant gold and copper discoveries between the 1970s and the late 1990s. (Anonymous, 1998). Their contribution was highest in Australia, Canada and the United States. As can be seen in Table 4, juniors made more than half of significant gold and copper discoveries in Australia between 1970 and 1997.
6 Deinternationalisation includes contraction of overseas operations,
Table 3
International presence of the largest Australian resource companies — 1993/94 and 1996/97a
Company Market capitalisationb No. of countries
A$ million 1993/ 94 1996/ 97 1999
BHP 31,960 40 50 21
RioTintoc 16,613 17 25 40
Woodside Petroleum 6738 1 2 2
WMC Resources 5773 6 16 13
Santos group 4311 5 9 4
North Limited 3006 3 7 9
Normandy Group 2802 5 19 11
Pasminco group 2214 7 7 6
MIM Holdings 1433 7 16 6
Gutnick Group 930 1 1 2
Iluka Resources 732 4 6 3
Newcrest Mining 566 4 10 2
Sons of Gwalia 556 5 5 1
Acacia Resourcesd 504 1 1 1
Novus Petroleum 420 3 6 9
Delta Gold 412 1 2 4
Western Metals group 411 1 2 3
Resolute Limited 386 1 2 4
Goldfields Ltd 338 1 2 2
Ashton Mining 320 5 8 8
Ranger Minerals 234 1 4 2
Ross Mining 159 1 2 2
Total 80,818 120 202 155
aSource: Resource Information Unit (various years) (1994, 1997), Company Annual Reports b At end March, 1998.
cThough technically based in London, RioTinto is included in the list because of its large Australian shareholding. d AngloGold took control of Acacia in 1999.
Table 4
Junior companies share in significant gold and copper discoveries between 1970 and 1997
Share of discoveries by Region
Juniors — percentage
Australia 51
Canada 38
United States 30
Asia 8
Chile 5
Other Latin America 22
Other 26
Average 27
While foreign direct investment by junior mineral and energy companies grew during much of the 1990s, simi-lar trends have also been apparent in other industry sec-tors. (see UNCTAD, 1997). Many juniors have opened new frontiers ignored by large companies for reasons related to economic, political and social risk. In late 1998 some junior Australian mining companies were active in as many offshore countries as their larger counterparts. Companies such as Leo Shield Exploration, Equinox Resources and Aquarius Exploration operated in more than five countries. The increased overseas activity of
junior Australian mining companies mirrors the experi-ence of Canadian companies reported by Harper et al. (1998).
The regional focus
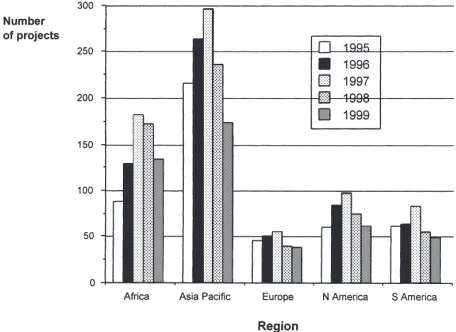
The Asia Pacific region and Africa were the first “new” investment destinations for Australian companies following the renewed resources boom of the 1980s. The “new” frontier expanded to include South America and Eastern Europe later in the decade. Though Australian minerals companies remain active in the traditional foreign destinations of Canada, the United States and Western Europe, their presence in the new environments grew particularly strongly between 1993 and 1997. Some details of the recent regional focus of Australian-based companies appear on Fig. 2, which has been derived from Table 2 above.
Fig. 2. Overseas resource projects of Australian-based Mineral Com-panies 1995 to 1999.
companies were operating in thirty African countries in late 1997. They were involved in more than 180 projects. The decline between 1997 and 1999 to 134 projects was due overwhelmingly to reductions in exploration-based activity.
The Asia Pacific, with 38 per cent of overseas pro-jects, and Africa, with 29 per cent, were the two most preferred regions by 1999. Europe had about eight per cent, North America thirteen per cent and South America eleven per cent. Since 1995 Africa’s share of projects had been rising, while the share of the Asia Pacific group of nations fell.
Exploration spending data from both the Australian Bureau of Statistics (Catalogue 8412.0) and the Minerals Council of Australia (2000) since the mid-1990s also show increasing preference for Africa and South Amer-ica. According to the Minerals Council of Australia Industry Survey for 1998/99 there was a dramatic decline in spending in the Asia Pacific region in 1997/98, with some recovery in 1998/99.
Within the broad regions bunching-up is evident in certain countries. This is a reflection of factors such as geological prospectivity, geographical proximity, famili-arity with systems of government, previous commercial or political links, and perceptions of sovereign and coun-try risk.
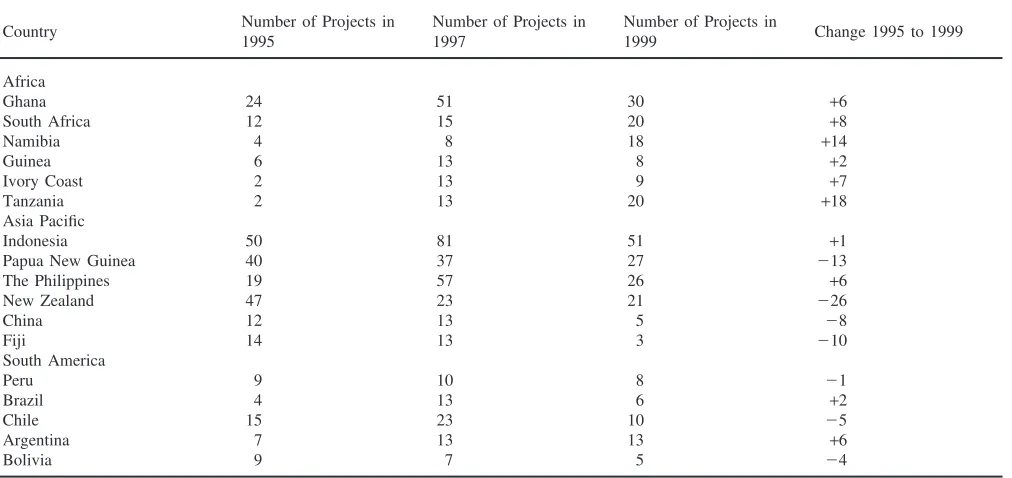
The number of projects in the top countries each in Africa, the Asia Pacific and Latin America in 1995, 1997 and 1999 appear in Table 5. Although there was a peak in 1997 and a subsequent decline, there were more pro-jects at the end of the period than at the beginning for each of the countries listed. This contrasted with the main Asian Pacific nations. Papua New Guinea, China and Fiji each had fewer Australian-controlled mining projects in 1999 than they had had in 1995. Among the major South American mineral investment destinations,
Argentina had become notably more popular during the period. Chile and Bolivia seemed less popular.
The increased preference for “new” geological environments in Africa, Asia Pacific and South America is also a reflection of international developments. As noted above, the Metal Economics Group reports similar trends on a world scale. Collected for companies respon-sible for over 80 per cent of world exploration spending, their studies show an increase in proportion of world exploration going to Asia, Africa, South America and the Pacific from 34 per cent in 1990 to around 60 per cent by 1999. Exploration spending in Canada, Australia and the United States declined during this period. Aus-tralia had similar exploration spending levels to Africa in 1997. In 1991 it received more than twice as much as Africa did.
The competitive advantage of the Australian mineral industry
The internationalisation of any industry depends on it establishing and sustaining a competitive advantage. Appreciating the sources of this competitiveness under-lies an explanation of the subsequent overseas movement of companies operating in a previously domestically-based sector.
Initially one can argue that Australia’s mineral indus-try competitiveness is a function of its control over scarce mineral resources. Yet it is clear that other deter-minants are important. Applying Michael Porter’s well known “diamond analysis” provides a useful taxonomy of these influences. He sees factor conditions, demand conditions, related and supporting industries, and firm strategy, structure and rivalry as the key influences which promote or impede the creation of competi-tiveness. Favourable government policy and chance sup-plement these to establish national competitive advan-tage for extended periods.
Factor conditions
Porter identifies human resources, physical resources, knowledge resources, capital resources and infrastruc-ture in his list of factor conditions. In addition to favour-able geology, each of these other factors has influenced the competitiveness of the Australian resources sector. The country has had a mining tradition since the 1850s.
In developing a stronghuman resourcesbase to support
Table 5
The major destinations of International Investment of Australian Mining Companies in 1995, 1997 and 1999a
Number of Projects in Number of Projects in Number of Projects in
Country Change 1995 to 1999
1995 1997 1999
Africa
Ghana 24 51 30 +6
South Africa 12 15 20 +8
Namibia 4 8 18 +14
Guinea 6 13 8 +2
Ivory Coast 2 13 9 +7
Tanzania 2 13 20 +18
Asia Pacific
Indonesia 50 81 51 +1
Papua New Guinea 40 37 27 213
The Philippines 19 57 26 +6
New Zealand 47 23 21 226
China 12 13 5 28
Fiji 14 13 3 210
South America
Peru 9 10 8 21
Brazil 4 13 6 +2
Chile 15 23 10 25
Argentina 7 13 13 +6
Bolivia 9 7 5 24
aSource: Minmet Australia (various years) Database (1999).
nation’s stock of otherknowledge resourcesdeveloped
through research institutes (in the Universities and the CSIRO), data collection agencies such as the Australian Bureau of Statistics, and trade associations such as the Minerals Council of Australia, State Chambers of Mines and related bodies, has supported this framework.
In the area of capital resources Australia has
strengthened its role in finance provision for resource projects particularly since the 1980s. Large financial resources arising from equity and debt during the stock market boom were partly responsible for this. The for-mation of the Australian Stock Exchange in 1987 from the amalgamation of state stock exchanges encouraged local and foreign companies to list. The Exchange has since matured into a significant source of equity for the resources sector, especially for medium sized projects for both local and overseas companies. By early 1999 over 450 Australian-based and twenty foreign-based resources companies were listed. The deregulation of the Australian financial sector also made a positive contri-bution.
From the mid-1980s, the financial viability of Aus-tralian gold mining companies was also enhanced by increased profits from emerging techniques of forward selling. Producers of other minerals have subsequently used these techniques. Between 1985 and the late-1990s many companies successfully used hedging as a renew-able source of finance. By closing hedge books when appropriate, they also raised profitability and increased the supply of internal resources for further investment.
Demand conditions
Porter (1990, pp. 86–97) emphasises two dimensions of domestic demand as important influences on competi-tiveness. These are its composition and its size. He argues that “a nation’s firms are likely to gain competi-tive advantage in global market segments which rep-resent a large or highly visible share of home demand but account for a less significant share in other nations” (p. 87). Sophisticated and demanding buyers at home additionally make a nation’s firms more able to compete internationally. There are mixed arguments about whether a large home market is good or bad for competi-tiveness. While large local markets enable domestic pro-ducers to reap economies of scale, small markets will encourage them to export if they are to reap such econ-omies.
Because of the generally small Australian domestic market for minerals, the growing demand by companies in Asia has been important for Australia’s mineral pro-ducers. Representatives from Japanese, Chinese, Tai-wanese and Korean heavy industry must purchase iron ore, coal, natural gas and other key minerals. They are sophisticated and demanding in their requirements. Aus-tralian producers must maintain a competitive edge to meet their needs.
Related and supporting industries
major mining services sector. This has occurred against the backdrop of the rise of the services sector more gen-erally and the growing international trade in services. In its publication, Australian Mining Industry 1996/97, the Australian Bureau of Statistics (1998) reported estimates of more than $A3 billion for contract, sub-contract and commission work for Australian mining establishments. Australian mining service providers have also been actively operating in other nations. Mining service pro-vision has emerged as an important export industry. While the ABS does not yet produce annual estimates of mining service exports, a survey of member compa-nies of the government-supported industry organisation, Austmine provides useful information on this issue. Its 115 member companies reported export sales of more than $A 1 billion in 1996/97. Both sets of estimates seem likely to understate the current strength of the mining services sector.
The extent of services provided to the mineral sector is broad. It covers core areas which have become highly specialised. These include mineral exploration, geo-chemistry and geophysics, satellite surveying, mine and plant design, engineering and construction, environmen-tal management, human resource management, legal ser-vices, accounting services and information technology provision. Larger companies often employ professionals in these fields but smaller companies are more likely to engage contractors.
There has also been a so called “de-integration” trend to entrust the provision of non-critical service activities to outside contractors, even if the services can be perfor-med equally as well within a company. This often involves work in areas where is it hard to recruit, retain, or supervise employees. Advances in information tech-nology have improved the ability of service sector firms that can now reap considerable cost advantages from specialisation. Areas such as drilling, open cut and underground mining contracting, laboratory services, transportation of staff to mine sites, transport of minerals and recruitment of staff come to mind.
Competition and focus have been important influenc-ing factors. A large domestic minerals industry operatinfluenc-ing in a competitive environment provides incentives to raise productivity and boost quality. Creating such incentives for service providers within companies is more difficult. Porter (1990 p. 246) notes that “specialised service pro-viders can often hire and train people better, employ bet-ter methods, use betbet-ter equipment and perform the ser-vice cheaper and better”.
Firm strategy, structure and rivalry
Australia is a significant producer on a world scale of several minerals. These include bauxite and alumina, iron ore, gold, nickel, copper, lead, zinc, coal, diamonds and titanium minerals. Within each of these sectors there
have typically been small numbers of producers who have been competitive with one another. This has led to a continuing competitive situation driven in part by domestic rivalry but also influenced by global rivalry and competition more generally.
While most long-term producers of these minerals (except perhaps in the gold industry) have typically been medium to large companies, the ownership system of mineral rights has allowed smaller companies also to play a role in exploration and promotion of new projects. The ability of smaller (often exploration) companies to enter various sectors of the mineral industry has played a positive role in stimulating the competitive domestic environment in Australia. Similar competitive environ-ments exist in few other nations.
Chance
Following Porter (1990, pp. 124–125) chance items includes acts of invention, major technological nuities, surges in world or regional demand, disconti-nuities in input costs such as oil price shocks, shifts in world financial markets or exchange rates, political decisions by foreign governments and wars. Some of these factors have positively influenced the competitive fortunes of the Australian minerals sector during the past two decades.
Australian mining companies have developed techno-logical advantages in exploration, mining methods and minerals processing. Notable recent applications of tech-nological innovations include things such as satellite imaging in mineral exploration, carbon-in-pulp leaching of gold, pressure acid leaching of lateritic nickel deposits and advances in block caving. These are a small portion of a much longer list. Slater (1996) has argued that tech-nological innovation is an area where Australian gold mining companies have recently had an edge over their US counterparts. Premoli (1998) identifies the ability to develop small mines to operate profitably as particular areas of strength and sources of competitiveness.
The strong growth of the nearby Asian economies has been a fortunate development as well. Even though the “Asian economic miracle” of the 1970s, 1980s and early 1990s gave way to the “Asian economic meltdown” of the late 1990s there has been a net positive impact on the fortunes of many Australian mining companies.
In the development of Australian financial markets, exchange rate levels have also been important. By fol-lowing an effective exchange rate policy Australia
main-tained low inflation rates after the mid-1980s
Government
State and federal government policy has played an important encouraging and supporting role in influencing the four key determinants of national competitiveness for the Australian resources sector. States are the major players in implementing mineral policy. Some states have been more influential than others. The positive con-tribution of the Western Australian government is parti-cularly notable but it can be argued as well that the Queensland and South Australian governments have played a strong supportive role. Population density, cli-mate and the resultant greater environmental sensitivity appear to have held back pro-mineral development poli-cies in New South Wales, Victoria and Tasmania.
Using the limited range of powers available to it in the natural resources area, (particularly with respect to offshore oil and gas exploitation), the Australian Federal government has generally taken a position which is not adverse to mineral development. There are, however, two areas where this has not happened. The effects of the High Court’s findings in the Mabo judgment in 1992 and the subsequent Native Title legislation, passed initially in late 1993, has increased the perception of increased structural impediments at home being erected by government. The Native Title situation has been sub-ject to further High Court decisions and amendments to Federal and State land use legislation. Growing com-munity expectations with respect to environmental qual-ity issues have also affected the minerals and energy sec-tor and legislative requirements in this area.
Relative to the governments of nations at similar stages of economic development, government action and policy implementation in Australia has been favourable to resource exploitation and export. It has achieved this by supporting and promoting Porter’s four determinants of national advantage.
Explaining internationalisation
Against this background, the foreign direct investment and internationalisation literatures also provide useful foundations for considering the growing international presence of Australian mining companies. Within this field it is instructive to consider two broad themes. First, there is a process of strategic diversification and glo-balisation occurring within a mature and competitive minerals industry. Second, the emergence of a range of structural impediments has influenced the situation. Growing impediments at home, combined with more favourable operating conditions abroad, have pushed Australian mining companies towards other geologically prospective nations. In this discussion we reflect briefly on the reasons for, and process of, internationalisation
which follows the establishment of a nationally competi-tive industry.
Models of internationalisation
At least two approaches offer useful insights into what has been occurring. First there is the so-called Uppsala model of internationalisation, proposed initially by Johanson and Wiedersheim-Paul (1975). This provides the foundation for later innovation-related stages models of internationalisation. Andersen (1993, 1997) provides a useful review of this literature associated with the first group of models. Another interesting perspective emerges from the eclectic framework advocated by Dun-ning (1988).
The first group of models are based on the behavioural theory of the firm and the theory of growth of the firm (Johanson and Vahlne, 1990). They grew out of empiri-cal research on the international growth of Swedish manufacturing firms. They view international expansion as a gradual process. Experimental knowledge of over-seas conditions (tacit commercial experience) results in incremental international involvement. This theory, often
referred to as the stages model, (Andersen, 1997),
sug-gests that firms enter markets with successively greater “psychic distance”. Psychic distance depends on differ-ences in culture, language and political systems. When applied to manufacturing, the model progresses from no export, to export via independent representatives, to sales through subsidiaries and eventual to manufacturing offshore (Andersen, 1993).
An incremental model of this type has some relevance to the internationalisation of Australian mining compa-nies. The argument by Johanson and Vahlne (1990) that firms start by “invading” neighbouring markets is rel-evant. As experience, knowledge and confidence grows they move to more distant markets. Initial offshore activities in Fiji and Papua New Guinea prior to the 1980s, the rise in activities in Asia and the exponential increase in exploration and mining investment in Africa can be explained by tenets of the stages model. The min-imising of psychic distance is apparent in Australian activities in Africa. Most are concentrated in countries whose official language is English and those whose legal system has its origins in the English Common Law.
Dunning’s eclectic approach also provides insights into offshore investment in the minerals industry. Its emphasis on competitive advantages is particularly use-ful. In the eclectic paradigm factors which influence internationalisation originate from inside and outside organisations. They include ownership factors (O) spe-cific to each firm, location-spespe-cific factors (L) and internalisation attributes (I), which make it profitable to operate within a firm rather than to rely on external mar-kets.
Ownershipadvantages may arise where firms have a technological edge over competitors, from access to or control of raw materials, political influence or ability to obtain competitively priced finance. Brouthers (1995) argue that ownership advantages are both unique and sustainable and provide firms with a competitive
advan-tage in entry mode selection. Location factors
encompass issues such as transport costs for raw materials, a country’s tariff system and taxation regime, and also the issue of political stability. Internationalis-ationgains can arise from effective management within a firm that brings economies of scale and reduces uncer-tainty associated with dealing with other firms. If a firm is to invest abroad each type of condition must be ful-filled.
Companies diversify to exploit firm-specific advan-tages. They increase returns to shareholders as a result of industry-competitiveness and location advantages. Profits, growth and survival are the key goals in follow-ing such a strategy. To internationalise successfully a company must control its establishment and operating costs in foreign locations. In achieving this it must hold a range of specific advantages. A mature company operating successfully within an internationally competi-tive domestic industry is more likely to possess these attributes. The maturity of Australian minerals compa-nies seems to explain a significant part of their success in internationalising. Though evolving to this position over 150 years, they have particularly developed a range of industry-specific advantages in the past thirty years.
As noted in the previous section, the specific advan-tages of Australian-based resources companies include technological competitiveness, access to suitable project finance and to a wide range of other mining services. Firm-specific advantages have developed particularly with high levels of expertise in exploration and mining technology. By moving to geologically prospective regions with more friendly operating environments than one or two decades ago, Australian resources companies are exploiting location-specific advantages abroad as well as at home. Firm and industry-specific advantages are important in this process.
In terms of the OLI approach one might list such fac-tors for resource companies as follows:
Ownership: Technology, management, access to
raw materials (abroad), political support (abroad), access to favourable finance (at home),
Locational: Geology, transport costs, labour costs, tax policies of host country, political stability of host country, environmental policy of host country,
Internalisation: Avoiding uncertainty, reaping
economies of scale, maintaining control, retaining technological edge.
The success of juniors as international new ventures
The internationalisation of junior Australian mineral companies does not fit into the normal diversification process proposed in the mainstream foreign direct investment and traditional internationalisation literature for several reasons. First, they generally have a much smaller capital base. Second, many juniors do not have any domestic operations to use as a springboard in nationalisation. Third, they do not have much inter-national experience as companies and they are much “younger” compared with conventional international investors.
One of the important reasons behind increased inter-national activities of junior companies in the 1990s lay in their access to sources of finance. A reliance on specu-lative capital has meant that they usually seek highly profitable deposits and take greater risks in search of high returns by going to “virgin” countries where prob-abilities of finding bonanza deposits are higher.
The search for quick returns partly explains their bias towards gold projects until 1997. The activities of junior companies are much more market-driven because they lack strong working capital. Their exploration programs emphasise rapid discovery and progression to delin-eation drilling in order to generate interest from larger investors. They usually apply lower hurdle rates in investment assessment and take greater risks. The risk-taking mentality of executives is a source of competitive advantage in internationalisation.
Competitive overseas conditions and structural impediments at home
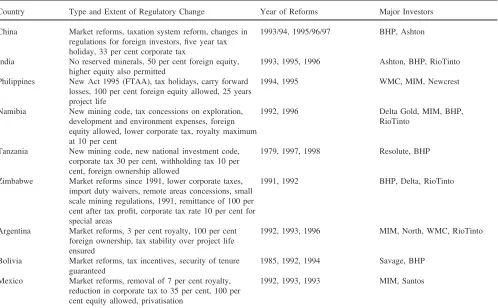
profit opportunities and affected the flows of inter-national capital. Interinter-nationally competitive Australian mining companies and investors have responded posi-tively to the change. Some indication of what has been occurring appears in Table 6. This contains a summary of changes in mineral investment conditions in nine selected and representative nations — three in Asia, three in Africa and three in Latin America. The shifting of concentration of mining activities also reflects relative resource depletion in Australia.
The decline in levels of structural impediments abroad has been accompanied by perceived increases in struc-tural impediments at home. As noted in the previous sec-tion there is greater community awareness of environ-mental quality issues. Resource companies operating in Australia are facing higher operating costs and greater challenges in obtaining environmental approvals for newly proposed projects. Native Title issues have also played a much more prominent role. Although business objectives motivate investment decisions, less competi-tive domestic conditions arising from a changing balance of structural impediments have also clearly influenced the internationalisation process.
Where structural impediments at home continue to grow and those abroad decline, the process is set into
Table 6
Recent mining legislation reforms in nine selected nations in Asia, Africa and the Americasa
Country Type and Extent of Regulatory Change Year of Reforms Major Investors China Market reforms, taxation system reform, changes in 1993/94, 1995/96/97 BHP, Ashton
regulations for foreign investors, five year tax holiday, 33 per cent corporate tax
India No reserved minerals, 50 per cent foreign equity, 1993, 1995, 1996 Ashton, BHP, RioTinto higher equity also permitted
Philippines New Act 1995 (FTAA), tax holidays, carry forward 1994, 1995 WMC, MIM, Newcrest losses, 100 per cent foreign equity allowed, 25 years
project life
Namibia New mining code, tax concessions on exploration, 1992, 1996 Delta Gold, MIM, BHP, development and environment expenses, foreign RioTinto
equity allowed, lower corporate tax, royalty maximum at 10 per cent
Tanzania New mining code, new national investment code, 1979, 1997, 1998 Resolute, BHP corporate tax 30 per cent, withholding tax 10 per
cent, foreign ownership allowed
Zimbabwe Market reforms since 1991, lower corporate taxes, 1991, 1992 BHP, Delta, RioTinto import duty waivers, remote areas concessions, small
scale mining regulations, 1991, remittance of 100 per cent after tax profit, corporate tax rate 10 per cent for special areas
Argentina Market reforms, 3 per cent royalty, 100 per cent 1992, 1993, 1996 MIM, North, WMC, RioTinto foreign ownership, tax stability over project life
ensured
Bolivia Market reforms, tax incentives, security of tenure 1985, 1992, 1994 Savage, BHP guaranteed
Mexico Market reforms, removal of 7 per cent royalty, 1992, 1993, 1993 MIM, Santos reduction in corporate tax to 35 per cent, 100 per
cent equity allowed, privatisation
aSource: Otto (1998), Naito et al. (1998), and Premoli (1998).
motion for the emergence of nationally competitive min-erals industries in other nations. The further emergence of nations such as Chile, Ghana and Russia may place them in strong leadership positions in their respective regions. This may challenge the strong present competi-tive positions of Australian, Canadian and South African companies. A dynamic perspective of the “Porter dia-mond” might see an eventual decline in the international competitiveness of Australian mining companies in such a scenario.
Some concluding comments
effec-tively against other major nations which also exploit large quantities of non-renewable and recyclable resources, and then export them to the outside world. These countries include Canada, South Africa, Chile, Brazil, many of the OPEC nations, Russia, Kazakhstan and several others.
At the time of writing the resources sector is emerging from a considerable period of downturn. This has threat-ened the financial viability of many companies. Many mining professionals have lost their positions and a sig-nificant proportion of this group may be tempted towards other sectors. As the upturn re-emerges, problems with staff recruitment may apply. Between 1997 and 1999 Australian resource companies withdrew from more than ten countries. There were about 260 less overseas pro-jects in 1999 than two years previously. The nature of the mineral cycle means that risks can be considerable and there needs to be continuing commitment despite cyclical downturns.
Australia now has a mature and competitive minerals industry. The challenge is to keep it that way. If Aus-tralian companies are able to maintain their presence in 70 or 80 countries it seems likely that this will imply larger numbers of new overseas mining operations than at present. They may occur in a variety of ways — joint ventures, buy-ins, large equity holdings or simply full ownership. The challenges faced in restructuring the Australian economy since the early 1970s will continue to apply in a similar fashion to mining companies, which are operating abroad.
References
Allen, C., Waring, T., 2000. Minerals and Energy: Exploration in Aus-tralia in Minerals and Energy, Vol. 3. In: Proceedings of the National Outlook Conference, 29 February–2 March, ABARE, Canberra, pp. 57–71.
Andersen, O., 1993. On the Internationalisation process: a critical analysis. Journal of International Business 24 (2), 209–231. Andersen, O., 1997. Internationalisation and Market Entry Mode: a
review of theories and conceptual frameworks. Management Inter-national Review Special Issue 37 (2), 27–42.
Anonymous, 1998. Large companies benefit from juniors’ success, Mining Engineering, 50(5), 18.
Australian Bureau of Statistics, various years. Actual and Expected Private Mineral Exploration, (Catalogue 8412.0), Canberra. Expected Private Mineral Exploration Expenditure, (Catalogue No. 8214.0), Canberra.
Brouthers, K.D., 1995. The influence of international risk on Entry Mode Strategy in the Computer Software industry. Management International Review 35 (1), 7–28.
Dunning, J.H., 1988. The eclectic paradigm of international pro-duction: a restatement and some possible extensions. Journal of International Business Studies 29 (1), 1–31.
Dunning, J.H., 1995. Reappraising the eclectic paradigm in an age of alliance capitalism. Journal of International Business Studies 26 (3), 461–491.
Eggert, R., 1988. Base and precious metals exploration by major cor-porations. In: Tilton, J., Eggert, R., Landsberg, H. (Eds.), World Mineral Exploration: Trends and Economic Issues. Resources for the Future, Washington, pp. 104–143.
Harper, G., Andrews, A.J., Fenoulhet, B., 1998. Worldwide explo-ration trends — where is the next exploexplo-ration romance? Engineer-ing and MinEngineer-ing Journal 199 (7), 40–45.
Johanson, J., Vahlne, J.-E., 1990. The mechanisms of internationalis-ation. International Marketing Review 7 (4), 11–24.
Johanson, J., Wiedersheim-Paul, F., 1975. The internationalisation of the firm: four Swedish cases. Journal of Management Studies 12 (3), 305–322.
Louthean Publishing, various years. The Australian Mines Hand-book, Perth.
Minerals Council of Australia, various years. Minerals Industry Survey Report, Canberra.
Minmet Australia, various years. OzMine Mining Database, Perth. Naito, K., Otto, J., Eggert, R., 1998. Mineral investment risk and
opportunities in Asia. Resources Policy 24 (2), 77–78.
O’Neill, D., 1992. Australian miners in Africa: an Australian perspec-tive. Mining Review 16 (4), 34–40.
Otto, J., 1998. Global changes in mining laws. Agreements and tax systems. Resources Policy 24 (2), 79–86.
Oviatt, B.M., McDougal, P.P., 1997. Challenges for internationalis-ation process theory: the case of interninternationalis-ational new ventures. Man-agement International Review — Special Issue, 37(2).
Porter, M., 1990. The Competitive Advantage of Nations. Macmil-lan, London.
Premoli, C., 1998. Mineral exploration in Africa: the long view. In: Vearncombe, S., Ho, S.E. (Ed.), Africa: Geology and Mineral Exploration. Papers Presented at the AIG Seminar, AIG Bulletin No. 25, Perth, November 6, pp. 35–46.
Resource Information Unit, various years. The Register of Australian Mining, Perth.