Journal of Multinational Financial Management 10 (2000) 213 – 227
The initial and aftermarket performance of
IPOs in an emerging market: evidence from
Istanbul stock exchange
Halil Kiymaz *
Department of Finance,School of Business Administration,Uni6ersity of Houston-Clear Lake,
Houston,TX 77058, USA
Received 21 November 1998; accepted 1 April 1999
Abstract
This paper empirically analyzes the initial and after-market returns for the Turkish initial public offerings (IPOs) to provide an emerging market case of international evidence on performances of IPOs. The sample consists of 163 firms listed and traded on the Istanbul Stock Exchange during the period of 1990 – 1996. The results show that the Turkish IPOs are underpriced on initial trading day on average of 13.1%. The initial underpricing is 11.7% for industrial firms, 15% for financial firms and 17.6% for others. In terms of sub-sectors the highest return is obtained in Tourism/Transportation group, while the lowest return is observed in Machinery/Equipment group. With the exception of Banking group, all of the sub-sectors experienced statistically significant initial underpricing. The investigation of factors influencing the initial performance show that size of issuer, rising stock market between the date of public offering and first trading day, institutional ownership, and self-issued offerings are significant determinants of underpricing. © 2000 Elsevier Science B.V. All rights reserved.
JEL classification:G14; G15; G24
Keywords:IPOs; Emerging markets; Istanbul stock exchange
www.elsevier.com/locate/econbase
* Tel.: +1-281-2833208; fax: +1-281-2833951.
E-mail address:[email protected] (H. Kiymaz)
1. Introduction
Numerous studies have examined the performance of initial public offerings (IPOs) in several different markets. These studies document that the initial under-pricing is a common phenomenon in every stock market, with the amount of underpricing differing from one market to another. The majority of studies include the equity markets of the US (Ibbotson, 1975; Ritter, 1984, 1991; Tinic, 1988; Peavy, 1990), UK (Keasey and Short, 1992; Levis, 1993), Canada (Jog and Riding, 1987; Jog and Srivastava, 1994), Switzerland (Kunz and Aggarwal, 1994), Australia (Lee et al., 1996a). There are relatively fewer studies on IPOs in the equity markets of developing countries. Among them, Lee et al. (1996b) investigates IPOs in Singapore; Kazantzis and Levis (1995) in Greece; Kim et al. (1995) in Korea, Aggarwal et al. (1993) in Chile, Mexico and Brazil; and Dawson (1987) in Hong-Kong, Singapore and Malaysia. These studies also report the existence of the initial underpricing in these markets.
This paper extends the international literature on IPOs by examining the IPOs at the Istanbul stock exchange (ISE). Specifically, both the initial and immediate after-market performances of IPOs are analyzed. Furthermore, the factors influenc-ing the initial performances of IPOs are investigated by employinfluenc-ing some of the explanations suggested in the IPOs literature.
The remainder of the paper proceeds as follows. In Section 2, literature on IPOs and the history of the ISE are briefly reviewed. While data and methodology are outlined in Section 3, the initial and after-market performances of IPO are presented in Section 4. The variables employed to explain underpricing phe-nomenon are defined in Section 5. The results of regression analysis are reported in Section 6, while the final section provides a summary and conclusion.
2. Background
2.1. Emerging markets IPOs e6idence
H.Kiymaz/J.of Multi.Fin.Manag.10 (2000) 213 – 227 215
Table 1
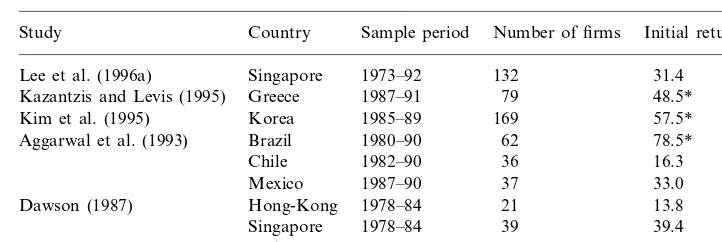
Summary of previous studies on performances of initial public offerings (IPOs) in developing markets
Number of firms Initial return (%) Sample period
Study Country
1973–92 132
Lee et al. (1996a) Singapore 31.4
48.5* 79
Kazantzis and Levis (1995) Greece 1987–91
169
Kim et al. (1995) Korea 1985–89 57.5*
62
Aggarwal et al. (1993) Brazil 1980–90 78.5*
36 16.3
* Statistically significant at least at 5% level.
Aggarwal et al. (1993) examine the performance of 62 Brazilian (during 1980 – 90), 36 Chilean (during 1982 – 90), and 44 Mexican IPOs (during 1987 – 90). Results indicate that the initial day returns are 78.5, 16.3 and 2.8% for Brazil, Chile and Mexico, respectively. Kazantzis and Levis (1995) investigate IPOs in Greece with using a sample of 79 firms going public between 1987 and 1991. The results show that Greek IPOs are on average underpriced by 48.5%. Kim et al. (1995) examine Korean IPOs of 169 firms during the period of 1985 – 89. The results reveal that the Korean IPOs outperform seasoned firms with similar characteristics. Much of the overperformance takes place during the first month, and long-run performance of Korean IPOs is not statistically different from that of seasoned firms. Furthermore, the deregulation, taking place in 1988, has reduced the initial underpricing, but it had no impact on long-run IPO performance.
Lee et al. (1996a) investigate the initial and long-run returns for Singaporean IPOs during the period of 1973 – 1993. They report an initial return of 30%, which is positively related to the level of oversubscription and retained ownership. In the long-run, no significant underperformance is detected. Kiymaz (1997) analyses the factors affecting the performances of Turkish financial IPOs during the first 30 trading days highly significant determinants of the performances of financial IPOs.
In summary, the existing studies on the emerging market IPOs consistently find the presence of the initial underpricing. This paper aims to extend the IPOs literature on emerging markets geographically by investigating the performances of the Turkish IPOs in both the initial and immediate after-market periods.
2.2. History and structure of ISE
The ISE began its operation in 1986 and has been the only stock exchange in
Turkey.1It has demonstrated a considerable growth since its establishment in 1986.
1The capital market in Turkey remained relatively underdeveloped mainly because of (a) protection
The number of companies traded on the exchange climbed from 80 at the end of 1986 to 228 at the end of 1996. The National Market is the major component of the ISE. There are also Regional, New Companies, and Watch-List Companies
Mar-kets. Most of the firms (93.4%) are traded at the National Market.2 The total
market capitalization of the firms traded has increased from US$ 938 million at the end of 1986, to US$ 30.8 billion at the end of 1996. Another noticeable growth is observed in the trading value, which has sharply increased from only US$ 13 million in 1986, to over US$ 51 billion in 1995. The listing requirements for the securities presenting partnership are regulated by both the ISE and the Capital Market Board. To get the listing of a security at exchange, the following conditions are required: the number of shareholders must be above 100; at least 15% of the paid-in capital must have been publicly offered; at least 3 years must have elapsed
since the incorporation date.3
The exchange administration normally determines and approves a financial structure, which must be at a level to enable the company to carry out its activities. The firm is also required to show a profit in the previous
2 consecutive years.4
3. Data and methodology
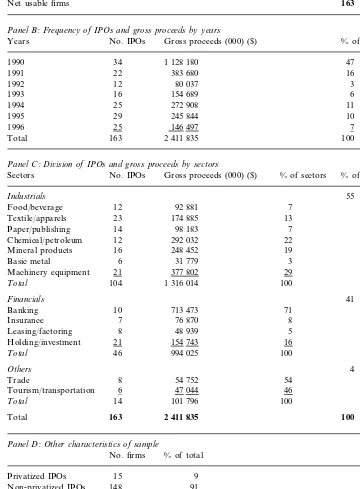
Panel A of Table 1 shows the sample selection. The population of the study consists of 168 firms listed and subsequently traded on the ISE during the period of January 1, 1990 and December 31, 1996. From this total, five firms are excluded due to inadequate data, resulting in a sample of 163 firms. Panels B through D of Table 2 provide selected characteristics of IPOs. Panel B of Table 2 reports the distribution of IPOs and the gross proceeds by year. The highest number of IPOs is observed in 1990 with 34 IPOs, followed by 29 IPOs in 1995. Furthermore, the highest percentage (47%) of total proceeds is realized in 1990, followed by 16% in 1991. In terms of number of IPOs and the percentage of gross proceeds, 1990 seems
to a dominant issue year in Turkish IPOs market.5
2At the end of 1996, 213 firms at National Market, 11 firms at Regional Market, one firm at New
Companies Market, and three firms were traded at Watch-List Companies Market. Due to the fact that Regional Market, New Companies Market, and Watch-List Companies Market were launched after 1995, all companies are traded between 1986 and 1994 were in National Market.
3If at least 25% of the capital is held by more than 100 shareholders, this obligation is reduced to
2 years.
4For the investment companies, some of these requirements may be waived by the written
permis-sion of Capital Market Board.
5In order eliminate inflation induced bias, the total proceeds are expressed in terms of US dollar.
H.Kiymaz/J.of Multi.Fin.Manag.10 (2000) 213 – 227 217
Table 2
Sample selection and characteristics
Panel A:Sample selection
168 Number of IPOs during 1990–1996 Period
Less: firms with incomplete data 5
163 Net usable firms
Panel B:Frequency of IPOs and gross proceeds by years
Years No. IPOs Gross proceeds (000) ($) % of total
47
Total 163 2 411 835 100
Panel C:Di6ision of IPOs and gross proceeds by sectors
% of sectors % of total
Food/beverage 12 92 881
13
Basic metal 6 31 779
29 377 802
Machinery equipment 21
100
Total 104 1 316 014
41 Leasing/factoring 8 48 939
16
Tourism/transportation 66
100
Total 14 101 796
100 163
Total 2 411 835
Panel D:Other characteristics of sample
Panel C of Table 2 reports the division of IPOs among sectors and the division of proceeds by sectors. Of the 163 IPOs, 104 IPOs are classified as industrial, 46 IPOs as financial, and the remaining 14 IPOs as others. In the industrial sector,
Textile group is in the first place with 23 IPOs, followed by 21 IPOs in machinery/
equipment, in financial sector holding/investment group is in the first place with 21
IPOs followed by banking group with ten IPOs. In terms of the gross proceeds,
while machinery/equipment group takes the first place with 29% of the gross
proceeds in the industrial sector, the banking group has the first place in financial sector with a share of 71%.
Panel D of Table 2 provides other information regarding to the sample. Out of 163 IPOs, 15 (9%) are IPOs taking place under the privatization program, 30 (18%) are the self-issued IPOs, and 51 (31%) IPOs involve with the issuing new shares. All share price data, date of going public, offer price, offer size, and other firm
specific information are obtained from the ISE.6
For each initial public offering, two short-run measures of performance are calculated:
(1) The initial underpricing: while the initial raw return for each stock is defined as relative price change from offer price to closing price at the end of first trading day, the initial adjusted return is defined to be the initial raw return less the corresponding market return on initial day.
(2) The aftermarket returns: the after-market adjusted return for each stock is defined as relative price change from closing price at the end of first trading day to closing price at the end of second day less the equivalent change in market return
and so on.7
4. Initial and after-market performances of IPOs
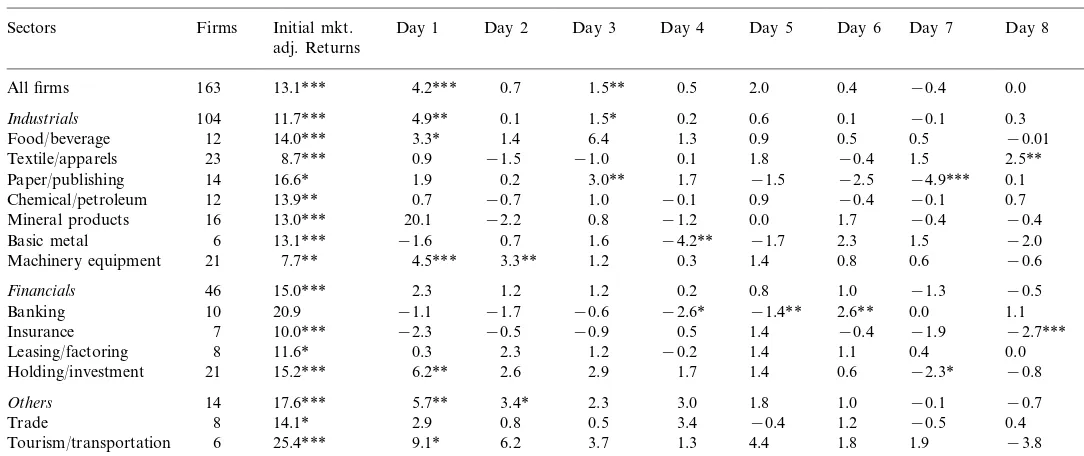
The initial and immediate after-market adjusted daily average abnormal returns (AARs) are reported on Table 3. The initial market adjusted returns are 13.1% for all firms. While the industrial sector experiences a market adjusted return of 11.7%, the financial sector has a return of 15%, and the others have a return of 17.4%. These returns are statistically significant at 1% level. In terms of sub-sectors, the
highest return is obtained in tourism/transportation group (25.4%); followed by
paper/publishing (16.6%); and holding/investment (15.2%). Market adjusted returns
are statistically significant for all sub-sectors with the exception of banking group, which experiences an insignificant market adjusted return of 20.9%.
6The total return for stockiin the periodtis calculated as follows:R
it=Pit/Pi0−1 wherePi,tis the price of stockiat timetandPi,0is the offer price. The return on the ISE-Composite Index is calculated
the same way.
7Standard event methodology is applied to calculate the average abnormal returns and the cumulative
H
Initial and immediate after-market average abnormal returns (AARs) (%)
Day 1 Day 2 Day 3 Day 4 Day 5 Day 6 Day 7 Day 8
All firms 163 13.1*** 4.2***
0.2 0.6 0.1 −0.1 Textile/apparels 23 8.7***
3.0** Mineral products 16 13.0*** 20.1 −2.2
−4.2** −1.7 2.3 1.5
Holding/investment 15.2*** 6.2**
3.0 1.8 1.0 −0.1
Tourism/transportation 25.4*** 9.1*
The immediate after-market AARs indicate that only food/beverage, machinery/
equipment, holding/investment, and tourism/transportation groups continue to
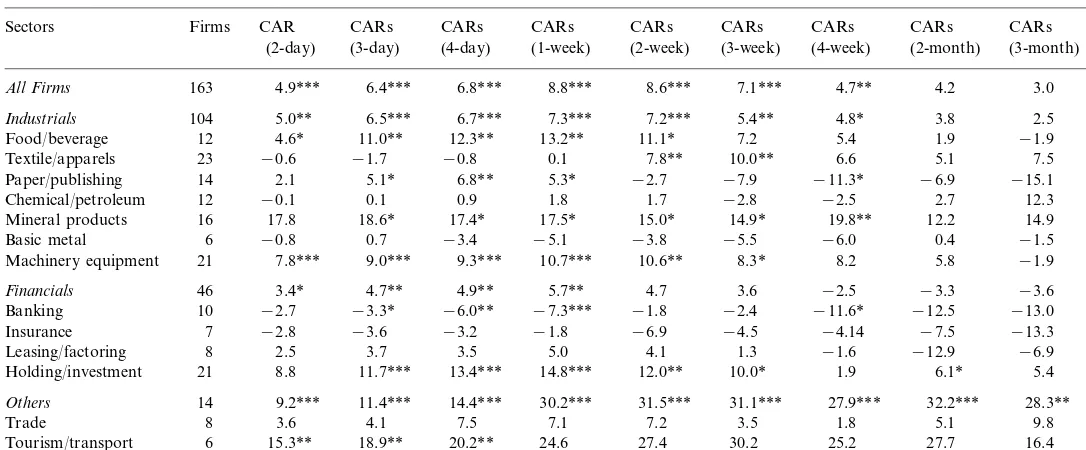
enjoy statistically significant positive excess returns. Other sub-sectors have either positive insignificant abnormal returns or negative significant abnormal returns. The after-market cumulative abnormal returns (CARs) are reported on Table 4 for each sector and sub-sector, ranging from 2-day to 3-month period. For all of the firms the results indicate that the underpricing continues to be present in the first 4 weeks, but the magnitude of CARs seems to be increasing initially and declining afterwards. For example, for all of the firms at the end of the first week, CARs are 8.8%, and statistically significant at the 1% level. For the same period, Industrials sector experiences CARs of 7.3%, while others group has CARs of 30.3%, and Financial sector has CARs of 5.7%. While the results of the first two groups are statistically significant at 1%, that of the last group is only weakly significant at 5%. When one looks at the longer after-market time periods (up to 3 months), it is noticed that almost none of the CARs for the sectors and sub-sectors has statistically significant positive abnormal returns and the most of them experi-ence insignificant negative abnormal returns. A notable point is that the sub-sec-tors, experiencing relatively higher initial market adjusted returns, seem to encounter relatively lower returns at the end of 3-month period. For example,
Paper/Publishing group has an initial market adjusted return of 16.6%, while it has
a 3-month market adjusted CARs of −15.1%. Similarly, Banking group has initial
market adjusted return of 20.9% and a 3-month market adjusted return of −13%.
These results show that the Turkish IPOs, similar to other international IPOs, experience a statistically significant underpricing both on the initial day and in the immediate after-market periods. These results are in line with those of other international IPOs studies. But when the returns in a longer after-market time period are investigated, the reversal of the initial positive abnormal returns is observed.
5. Factors influencing the performances of IPOs
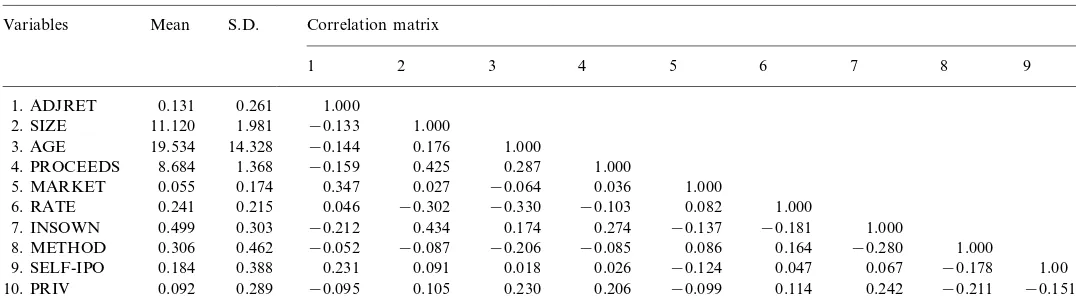
Table 5 reports the descriptive statistics and the correlation matrix of variables employed as potential explanatory variables for the cross-sectional differences in the initial underpricing.
There are a number of hypotheses regarding the possible explanation for IPOs. Generally, the literature on under-pricing relates the under-pricing phenomena to ex-ante uncertainty (Rock, 1986; Beatty and Ritter, 1986). In line with these studies, a positive relationship between the level of underpricing and the level of ex-ante uncertainty of a new issue is expected. Since it is not possible to measure ex-ante uncertainty directly, a number of variables are used as proxies. There are three variables used as proxies for ex-ante uncertainty in this study. These are the size of firms, the gross proceeds from going public, and the age of the firms.
H
After-marketacumulative abnormal returns (CARs) (%)
CARs CARs CARs
Firms CARs
Sectors CAR CARs CARs CARs CARs
(1-week) (2-week)
Industrials 104 5.0** 6.5*** 6.7***
12.3** 13.2** 11.1* 7.2 5.4 1.9 −1.9
4.6*
Food/beverage 12 11.0**
7.8** 10.0** 6.6 5.1 7.5
0.1
−1.7 −0.8
Textile/apparels 23 −0.6
5.3*
15.0* 14.9* 19.8** 12.2 14.9
17.5* Mineral products 16 17.8 18.6* 17.4*
−3.8
Holding/investment 21 8.8 11.7***
31.5*** 31.1*** 27.9*** 32.2***
20.2** 24.6 27.4 30.2 25.2 27.7 16.4
6
Tourism/transport 15.3** 18.9**
aExcluding initial trading day; 1 week corresponds to 5 trading days, while 1 month corresponds 20 trading days.
H
.
Kiymaz
/
J
.
of
Multi
.
Fin
.
Manag
.
10
(2000)
213
–
227
Table 5
Descriptive statistics of variables
Variables Mean S.D. Correlation matrix
4 5 6 7 8 9
3 2
1
0.131 0.261 1.000 1. ADJRET
11.120
2. SIZE 1.981 −0.133 1.000
1.000 19.534 14.328 −0.144 0.176
3. AGE
1.000 4. PROCEEDS 8.684 1.368 −0.159 0.425 0.287
0.036 1.000
−0.064 5. MARKET 0.055 0.174 0.347 0.027
−0.103 0.082 1.000 6. RATE 0.241 0.215 0.046 −0.302 −0.330
0.274 −0.137 −0.181 1.000 0.174
7. INSOWN 0.499 0.303 −0.212 0.434
8. METHOD 0.306 0.462 −0.052 −0.087 −0.206 −0.085 0.086 0.164 −0.280 1.000 0.026 −0.124 0.047 0.067 −0.178
0.018 1.00
0.231
9. SELF-IPO 0.184 0.388 0.091
H.Kiymaz/J.of Multi.Fin.Manag.10 (2000) 213 – 227 223
possibility that smaller firm IPOs are more speculative than those of larger firms. Hence, the larger firms’ IPOs are expected to have lower uncertainty as compared to the smaller IPOs. This variable is measured as the natural logarithm of the total dollar value of assets at the end of year prior to the year of going public. A negative coefficient is expected for this variable.
Proceeds (PROCEEDS): the values of the gross proceeds are also employed to measure the ex-ante uncertainty related to a new issue. The smaller amount of proceeds may indicate a greater uncertainty about a firm’s future compared to a larger amount of proceeds. The proceeds are converted into dollar amount by using the exchange rate on the last day of public offering sales to remove the effect of inflation. An inverse relationship between this variable and the initial underpricing is expected.
Operating history (AGE): the operating history of firm prior to going public is also employed as a proxy for ex-ante uncertainty. Since older firms have more information available to the public than younger firms do, the older firms are expected to have lower ex-ante uncertainty compared to the younger firms. Hence lower underpricing is expected for older firms. The age of the firm in years on flotation is used as variable and expected to be inversely related to the level of underpricing.
Market trend (MARKET): underpricing of IPOs may be a result of the rising stock market between the fixing of the offer price and first trading day. As a test for the institutional lag in the stock offering, this variable is constructed as the holding period market (the ISE-Composite Index) returns from the last day of the public offering to the first trading day. A positive relationship is expected.
Offer rate (RATE): the percentage of equity offered to public may signal the quality of IPOs to investors. According to Leland and Pyle (1977), the private information of pre-offering firm value is signaled to potential investors through the percentage of equity retained. They hypothesize that the value of the firm is positively related to the percentage of the equity retained in the firm by owners. Keasey and Short (1992) argue that a relatively high percentage of equity retention may reduce investors’ uncertainty because the firms’ owners have signaled their faith in business. On the other hand, a greater percentage of equity retained by owners may also be interpreted as less marketability of shares. In order to test the effect of the percentage of equity offered to public, the offer rate variable is employed. There is no pre-expectation regarding to the sign of this variable.
Pri6atization(PRIV):the privatization of government owned enterprises has been
Institutional ownership (INSOWN): in order to test the effect of ownership structure on the initial performance of IPOs, the percentage institutional ownership of firms’ stocks prior to going public is employed. Higher institutional ownership may align shareholders interest and hence, an inverse relationship is expected.
Method of going public(METHOD):IPOs can be classified as either the offering of new issues (i.e. primary) or the sales of previously issued outstanding shares (i.e. secondary). In latter case, proceeds will go to the existing shareholders and these funds may not be used for firms’ growth strategies. This may suggest a higher level of underpricing. In former case, proceeds are used for the firm’s goals. This institutional structure may provide an opportunity to test the impact of issuers’ motives in going public. A dummy variable is employed and takes the value of one if offering is new issue, and zero otherwise.
Self-offered IPOs (SELF-IPO): Baron (1982)’s model proposes that investment bankers have more information about demand for securities than issuer, and that the quality of reputation of investment banker may indicate the quality of IPOs, and can, therefore, generate more demand for new stock. In his model, investment banker may profit from its information advantage by setting its issue price too low. Muscarella and Vetsuypens (1989) tests this model for US firms, in which issuer acts as underwriter for its own IPOs. In this case, no information asymmetry should be expected and underpricing should disappear. They find no significant differences in their two samples and provide evidence against information advantage of investment banks. To test this explanation for Turkish IPOs, a dummy variable is employed. This variable takes value of one if investment bankers underwrite their
own IPOs or one of family-firms’ IPOs, and zero otherwise.8
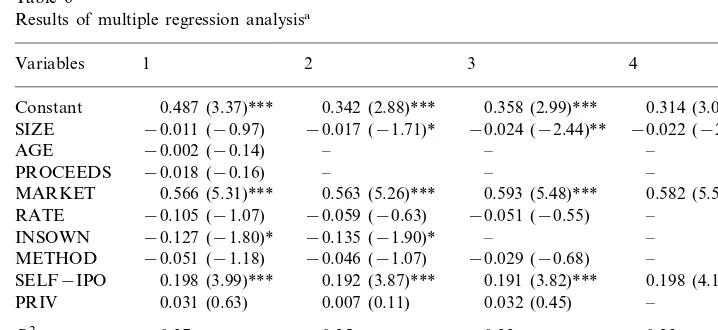
6. Cross-sectional regression results
The results of multivariate regression are reported on Table 6. Four variables may act as potential proxies for ex-ante uncertainty about market performances, namely firm size, proceeds, firm’s age, and self-IPOs. A positive relationship between under-pricing and ex-ante uncertainty is expected. Additionally, the effects of possible market movement, the influence of percentage offered to public, the effect of ownership structure, the method of going to public, and privatization are employed as other variables to explain IPOs performance.
Univariate regressions were initially performed with under-pricing as the depen-dent variable, and statistically significant relationships were found for SIZE, PROCEEDS, MARKET, INSOWN, SELF-IPO, and AGE variables. Then multi-variate regressions were performed and the results are reported on Table 6. The first regression indicates that while MARKET, and SELF-IPO variables have
coeffi-8Turkish private sector mainly consists of family-owned groups of companies, which commonly
H.Kiymaz/J.of Multi.Fin.Manag.10 (2000) 213 – 227 225
cients of 0.566 and 0.198, respectively, and are statistically significant at 1% level,
INSOWN variable with a coefficient of −0.127 is weakly significant at 10%. The
market variable is intended to measure the effect of institutional lag on underpric-ing. The results indicate that MARKET variable has expected sign, which is statistically highly significant. The rising market between the offer price fixing time and the first trading day is one of the important determinants of under-pricing. The negative sign of INSOWN indicates that underpricing is lower in firms with higher institutional holdings. The size variable was one of the proxies for ex-ante
uncer-tainty. The coefficient of this variable is −0.038, indicating an inverse relationship
between firm size and pricing. The smaller firms would have greater under-pricing, which is in line with expectations. The SELF-IPO variable is also highly significant and has a positive coefficient of 0.154, indicating that self-offered IPOs are underpriced more than others. This result contradicts with the hypothesis of Baron (1982) and is in line with studies finding no support for this hypothesis (i.e. Muscarella and Vetsuypens, 1989).
Table 6
Results of multiple regression analysisa
3 2
1
Variables 4
0.342 (2.88)***
Constant 0.487 (3.37)*** 0.358 (2.99)*** 0.314 (3.01)*** SIZE −0.011 (−0.97) −0.017 (−1.71)* −0.024 (−2.44)** −0.022 (−2.44)**
MARKET 0.566 (5.31)*** 0.563 (5.26)*** 0.593 (5.48)*** 0.582 (5.53)***
−0.105 (−1.07) −0.059 (−0.63)
SELF−IPO 0.198 (3.99)*** 0.192 (3.87)*** 0.191 (3.82)*** 0.198 (4.18)*** 0.031 (0.63) 0.007 (0.11)
aUnderpricing=b0+b1(size)+b2(age)+b3(proceeds)+b4(market)+b5(rate)+b6(priv)+b7(InsOwn) +b8(method)+b9(self-IPO)+o ; where: underpricing=market adjusted initial return; size=natural
logarithm of the total assets of firm prior to offering; age=number of years in operation (operating history) before offering; proceeds=natural logarithm of US dollar value of proceeds from offering; market=market index returns from the last day of public offering to the first trading day; rate=percent of equity offered to public; priv=a dummy variable taking on the value of one if IPO is done under government privatization program and zero otherwise; InsOwn=percentage of ownership by institu-tions; method=a dummy variable taking on the value of one if firm issues primary shares and zero otherwise; Self-IPO=a dummy variable taking on the value of one if investment bankers underwrites their own IPOs or one of family-firms’ IPOs and zero otherwise.
RATE and AGE variables have the expected sign but they are not statistically significant. Two other insignificant variables are PRIV and METHOD. The first one has positive signs, indicating that privatized IPOs are more underpriced than others, and the second variable has negative sign, indicating new issued IPOs are less underpriced than previously issued stocks.
Regressions 2 – 4 report different combinations of variables employed. Three variables are consistently significant, namely SIZE, MARKET and SELF-IPO. These results indicate that initial underpricing in Turkish market is a result of rising stock market and investment bankers’ underpricing issues possibly to leave a good taste with investor. This would, in turn, provide firms a chance to sell future offerings at a higher price than would, otherwise, be the case.
7. Summary and conclusion
The literature on the performance of IPOs suggests that investors purchasing IPOs at the offer price earn abnormal returns on initial trading day. This paper aims to provide an additional international evidence on the IPOs by examining the Istanbul Stock Exchange, which is considered as one of the fastest growing emerging markets. By using a sample of 163 firms listed and traded on the ISE, this study investigates both the initial and after-market performances of IPOs. The average market adjusted underpricing on the first trading day is found to be 13.6% for all sample, 12.2% for industrials, 15.3% for financials, and 18.5% for others. These results are highly significant and in the line with the results of other international studies on IPOs. When the factors influencing the initial performance of Turkish IPOs are investigated, size of issuer, rising stock market between the time of price fixing and first trading day, and self issued offerings appear to be the main determinants of the initial underpricing. Furthermore, the institutional owner-ship variable seems to be weakly influencing the initial underpricing. The results obtained from the self-offerings variable contradict with Baron (1982) hypothesis but is in line with Muscarella and Vetsuypens (1989). There is also a support for the ex-ante uncertainty measurements of Beatty and Ritter (1986) and Rock (1986).
Acknowledgements
I thank the participants at the 1997 meeting of European Financial Management Association and the 1997 meeting of Financial Management Association Interna-tional for their helpful suggestions to improve the paper.
References
H.Kiymaz/J.of Multi.Fin.Manag.10 (2000) 213 – 227 227
Aggarwal, R., Leal, R., Hernandez, L., 1993. The aftermarket performance of initial public offerings in Latin America. Financial Management Spring, 42 – 53.
Baron, D.P., 1982. A model of the demand for investment bank advising and distribution services for new issues. Journal of Finance 45, 1045 – 1067.
Beatty, R.P., Ritter, J.R., 1986. Investment banking, reputation, and the underpricing of initial public offerings. Journal of Financial Economics 15 (1), 213 – 232.
Dawson, M.S., 1987. Secondary stock market performance of initial public offers, Hong Kong, Singapore, and Malaysia:1978 – 1984. Journal of Business Finance and Accounting Spring, 65 – 76. Jog, V.M., Riding, A.L., 1987. Underpricing in Canadian IPOs. Financial Analysts Journal November –
December, 48 – 54.
Jog, V.M., Srivastava, A., 1994. Underpricing of Canadian initial public offerings 1971 – 1992: an update. Fineco 4 (1), 81 – 89.
Ibbotson, R.G., 1975. Price performance of common stock new issues. Journal of Financial Economics 3, 235 – 272.
Kazantzis, C., Levis, M., 1995. Price support and initial public offerings: evidence from the Athens Stock Exchange. Research in International Business and Finance 12, JAI Press.
Keasey, K., Short, H., 1992. The underpricing of initial public offerings: some UK evidence. Interna-tional Journal of Management Science 20, 457 – 466.
Kiymaz, H., 1997. Analysis of factors affecting the performances of Turkish financial IPOs. ISE Review 2 (April – June), 59 – 77.
Kim, B.J., Krinsky, I., Lee, J., 1995. The aftermarket performance of initial public offerings. Pacific-Basin Journal 3, 429 – 448.
Kunz, R.M., Aggarwal, R., 1994. Why initial public offerings are underpriced: evidence from Switzer-land. Journal of Banking and Finance 18, 705 – 723.
Lee, P.J., Taylor, S.L., Walter, T.S., 1996a. Expected and realized returns for Singaporean IPOs: initial and long-run snalysis. Pacific-Basin Journal 4, 153 – 180.
Lee, P.J., Taylor, S.L., Walter, T.S., 1996b. Australian IPO pricing in the short and long-run. Journal of Banking and Finance 20, 1189 – 1210.
Leland, H.E., Pyle, D.H., 1977. Information asymmetries, financial structure and financial intermedi-aries. Journal of Finance 32, 317 – 387.
Levis, M., 1993. The long-run performance of IPOs: the UK experience 1980 – 1988. Financial Manage-ment Spring, 28 – 41.
Muscarella, C.J., Vetsuypens, M.R., 1989. A simple test of Baron’s model of IPO underpricing. Journal of Financial Economics 24, 125 – 135.
Peavy, J.W., 1990. Returns on the initial public offerings of closed end funds. Review of Financial Studies 3, 695 – 708.
Ritter, J.R., 1984. The ‘Hot Issue’ market of 1980. Journal of Business 57, 215 – 240.
Ritter, J.R., 1991. The long-run performance of initial public offerings. Journal of Finance 46, 3 – 28. Ritter, J.R., 1998. Initial public offerings. Contemporary Finance Digest, 5 – 30.
Rock, K., 1986. Why new issues are underpriced? Journal of Financial Economics 15, 187 – 212. Tinic, S., 1988. Anatomy of initial public offerings of common stock. Journal of Finance 43, 789 – 822.