IN SECOND-GENERATION SEEDLING SEED ORCHARDS OF
IN SOUTH KALIMANTAN, INDONESIA
ACACIA MANGIUM
Arif Nirsatmanto , Teguh Setyaji , Surip
Comprehensive tree improvement program for has been started since 1992 by establishing a series of first-generation Seedling Seed Orchards (SSO) in Indonesia. Selection procedures in the first-generation of SSO have completely finished, and subsequently it was continued for second-generation improvement. This paper examines a trend of realized genetic gain as a response of selection practiced in the first-generation SSO. The observation was carried out in three sub-lines of the second-generation SSO (namely Sub-line B, C and D). Parameters recorded included tree height, diameter at breast height (dbh) and stem straightness that were recorded periodically up to 4 years growth. The realized genetic gain was calculated as a percentage of improved plus trees population in the first-generation of SSO compared to those of unimproved trees. The results showed that the improved population was consistently better that those of unimproved one until 4 years of age. There were variation in terms of realized genetic gain parameters recorded depending on the sub-lines and ages. The tree height varied from 1.1% to 5%, while dbh and stem straightness were in the ranges of 2.8% to 6.7% and from 1.8% to 8.4%, respectively. Across the three sub-lines, the tree height varied from 2.2% to 3.1%, while dbh and stem straightness were in the ranges of 4.3% to 5.2% and 4.3% to 6%, respectively. In general, the trend of the realized genetic gains slightly decreased for dbh and tree height with the increasing of ages, while it slightly increased for stem straightness.
Keywords: , Realized Genetic Gain, Seedling Seed Orchard, Second Generation
1* 1 1
Received : 28 February 2013, Accepted : 12 June 2013
ABSTRACT
Acacia mangium
Acacia mangium
I. INTRODUCTION
In the last few years, genetically improved seed demand of increased sharply to support plantation forest in Indonesia. Comprehensive tree improvement program has been started since 1992 by establishing first-generation of
seedling seed orchards (SSO) in Indonesia (Hashimoto ., 1996). The SSO was initially established as a progeny test using superior provenances collected from Papua New Guinea and Far North Queensland-Australia.
In 2000, selection procedures in the first-generation SSO of have completely finished, and subsequently it was continued for the second-generation improvement (Kurinobu
A. mangium
A. mangium et. al
A. mangium
and Rimbawanto, 2002). The primary objective of selection practiced in the seedling seed orchards was to select individual trees and families which had the most desirable characters for use as parents in breeding and improved seed production. Selection procedures were started by within-plot selection, followed by family or in combining with within-family selection, and finally plus trees selection. Significant amount of genetic gain could then be obtained from each step of selections, although the amount of improvement will vary among them (Wright, 1976).
Prediction of genetic gain obtained from progeny test is commonly practiced in tree improvement program, which is mainly dependent on the degree of heritability and selection differential between the selected population and original population. In case of
, Kurinobu . (1996) has reported that A. mangium et al
1
Center for Forest Biotechnology and Tree Improvement, Yogyakarta, Indonesia
Corresponding Author: [email protected].
total prediction of genetic gain in SSO from within-plot and family selection based on early growth data was less than 5% for both of growth and stem straightness. However, the amount of genetic gain prediction may differ from those of realized genetic gain. The difference might be due to the weakness of juvenile-mature correlation, the presence of competitive interaction, pollen contamination, unequal contribution of parents to the improved population, and interaction between genotypes and silvicultural practices (St. Clair, 1993). Therefore, comparison study of improved and unimproved population to evaluate the amount of actual genetic gain is necessary. The result obtained from the study is also useful to observe the response to selection practiced in a SSO which is initially set up as progeny test.
Nirsatmanto . (2004) reported that realized genetic gain brought by the first-generation tree improvement using data observed in three second-generation SSO were positive at the first year of age. The realized genetic gains were around 3% for height, 5% for dbh, and 4% for stem-straightness, and confirmed that the series of selection procedure practiced in first-generation SSO had been done properly. However, the one year age data as used in that study was still very young and probably provides different result if the trees getting older. According to Eldridge (1993) and Zobel and Talbert (1984), realized genetic gain tends to reduce with increasing stand development and competition. Therefore, the present study was conducted to observe the trend of realized genetic gain using data until four years of age in
the second-generation SSO of in
South Kalimantan, one of the representative regions for plantation in Indonesia.
A. mangium
et al
et.al.,
A. mangium A. mangium
II. MATERIAL AND METHOD
A. First and Second-generation Seedling Seed Orchard (SSO)
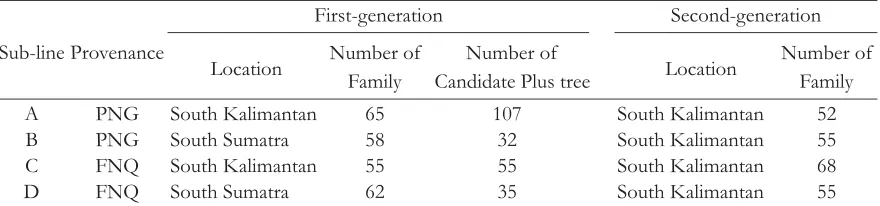
Detailed description and field experiment in the first and second-generation SSO were described by Nirsatmanto . (2004), and it is summarized in Table 1. Six of the first-generation SSO of were established in January 1994 in two locations: South Sumatra and South Kalimantan. They were established according to the sub-line system (McKeand and Beineke, 1980), which were accomplished by establishing small breeding groups of SSO se parately according to their original provenances. Owing to poor survival and fire disaster at two orchards, plus trees selection was made only in the four orchards representing four sub-lines, namely sub-lines A, B, C and D (Table 1).
Beyond strategy towards advanced generation breeding program using sub-line system, four second-generation SSO representing the four sub-lines were established in January 2001 in South Kalimantan, Indonesia. Family tested in the second-generation SSO consists of 24-49 open-pollinated families of selected plus trees in first-generation SSO and 3-39 newly infused families selected from natural forest. In this study, the plus trees families and the infused families were then referred to as the improved population and the unimproved one, respectively. During the four years measurement, within-plot selections were practiced twice in the four sub-lines of SSO: at two years for the first selection and at three years for the second one, with culling rate of 50 % for each stage of selection.
Candidate Plus tree Location
Number of Remarks : PNG: Papua New Guinea; FNQ Far North Queensland:
B. Measurements and Data Analysis
Periodical measurements were conducted at two, three, and four years of age involving traits of tree height, diameter at breast height (dbh) and stem straightness. Tree height and dbh were recorded in metric scale, while stem straightness was scored from 1 (worst) to 5 (best) according to the methode of Keiding (1984). In this study, the data from the sub-line A was excluded from the analysis due to a large imbalance in the number improved families and unimproved one. Therefore, the subsequent analysis was made with the data from the three SSO: sub-lines B, C and D.
Analysis of variance was made for each sub-line using individual tree data ( ) with the following linear model:
...(1) where, = population mean, = the effect of improved and unimproved population, = the -th replication effect, / = the -th family effect in -th population, = the -th plot error in the -th replication and within plot deviation with
, respectively.
In order to examine the amount of genetic improvement across the three sub-lines, analysis of variance was made using replication x population mean across the three sub-lines ( ) with the following linear model:
...(2) where, = population mean, = the sub-line
et al.
effect, / = the -th replication effect in the -th sub-line, = the -th population effect, * = the effect of sub-line × population interaction, and = experimental error associated with , respectively.
The realized genetic gains were calculated as the differences between the improved population and unimproved ones, both of which were the least square estimates of the linear model given in Equation 1 and Equation 2. Then the relative gain was calculated as a percentage rate of the gain into the mean of unimproved population. The results were then compared with those studied by Nirsatmanto . (2004) to obtain more complete results and to make comprehensive discussion.
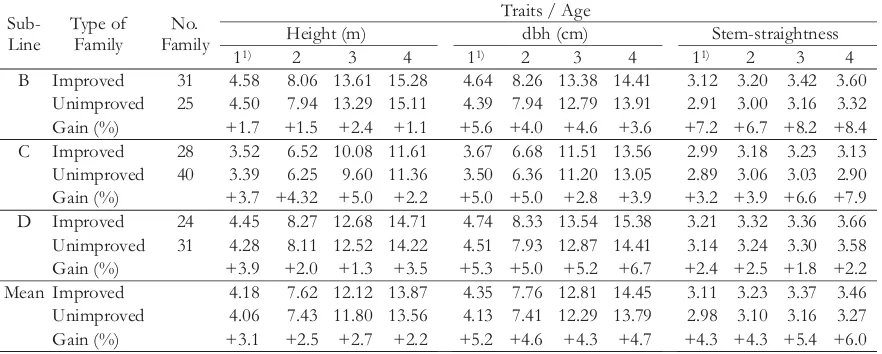
Growth, form traits and realized genetic gain until 4 years of age in the three sub-lines of the second-generation SSO were presented in Table 2. In general, trees planted in the three sub-lines showed good growth, exceeding 13 m for height and 13 cm for dbh at four years of age. Along the four year of ages, growth traits varied among the three sub-lines. Sub-line B performed slightly better in height growth with the average at four years exceeded 15 m, then followed by sub-line D. Conversely, sub-line D showed better in diameter than Sub-line B with the average exceeded 14 cm. Among the three sub-lines, sub-line C was
B S j i
III. RESULT AND DISCUSSION
Sub-Height (m) dbh (cm) Stem-straightness 11) 2 3 4 11) 2 3 4 11) 2 3 4
B Improved 31 4.58 8.06 13.61 15.28 4.64 8.26 13.38 14.41 3.12 3.20 3.42 3.60 Unimproved 25 4.50 7.94 13.29 15.11 4.39 7.94 12.79 13.91 2.91 3.00 3.16 3.32 Gain (%) +1.7 +1.5 +2.4 +1.1 +5.6 +4.0 +4.6 +3.6 +7.2 +6.7 +8.2 +8.4 C Improved 28 3.52 6.52 10.08 11.61 3.67 6.68 11.51 13.56 2.99 3.18 3.23 3.13 Unimproved 40 3.39 6.25 9.60 11.36 3.50 6.36 11.20 13.05 2.89 3.06 3.03 2.90 Gain (%) +3.7 +4.32 +5.0 +2.2 +5.0 +5.0 +2.8 +3.9 +3.2 +3.9 +6.6 +7.9 D Improved 24 4.45 8.27 12.68 14.71 4.74 8.33 13.54 15.38 3.21 3.32 3.36 3.66 Unimproved 31 4.28 8.11 12.52 14.22 4.51 7.93 12.87 14.41 3.14 3.24 3.30 3.58 Gain (%) +3.9 +2.0 +1.3 +3.5 +5.3 +5.0 +5.2 +6.7 +2.4 +2.5 +1.8 +2.2 Mean Improved 4.18 7.62 12.12 13.87 4.35 7.76 12.81 14.45 3.11 3.23 3.37 3.46 Unimproved 4.06 7.43 11.80 13.56 4.13 7.41 12.29 13.79 2.98 3.10 3.16 3.27 Gain (%) +3.1 +2.5 +2.7 +2.2 +5.2 +4.6 +4.3 +4.7 +4.3 +4.3 +5.4 +6.0 1)
Nirsatmantoet al. (2004)
consistently the lowest in both of growth traits. As reported in previous study, the slower growth in Sub-line C was probably due to poor drainage of the site (Nirsatmanto ., 2004). Regarding the stem-straightness, all three sub-lines generally showed almost the same performance, exceeding score 3, with a tendency to be straighter with the increasing of ages. The possible reason of increasing stem straightness is due to the effect of within-plot thinning which have been practiced twice during the four years ages and the increases of diameter growth development. This phenomenon is similar with those reported by Hubert . (2003) in Sitka spruce, that thinning had a positive effect on the overall stem straightness of a stand. In addition, smaller trees in diameter tended to have poor stem straightness than larger diameter trees.
In the three sub-lines along the four year measurements, the growth and form traits of improved population were consistently better than those of the unimproved population. The realized genetic gain that were calculated as a difference between the improved population and unimproved one ranged from 1.1% to 5% for height, 2.8% to 6.7% for dbh, and 1.8% to 8.4% for stem straightness (Table 2). The amount of realized genetic gain for each trait varied among the sub-lines and ages. In general, the highest gain for height was found in Sub-line C, while those for
et al
et al
diameter was found in Sub-line D. Regarding the stem straightness, the highest gain was found in Sub-line B. The positive realized genetic gain for the three traits along the four year ages indicated that the series of selection practiced in the first-generation SSO was done properly. Realized genetic gain obtained as a response to selection in the orchard provided an improvement in growth and form traits productivity. In addition, despite the results of gain among the three sub-lines was not directly comparable because of the differences in genetic material of unimproved population, the respective sub-line showed higher realized genetic gain in specific characters: sub-line B for stem straightness, sub-sub-line C for height and sub-line D for dbh. This result indicated that the magnitude of variation and improvement among the three sub-lines was different according to the trait. The possible reason of this discrepancy is mainly due to the differences of genetic materials used in each sub-line, where the three sub-lines consisted of family originated from different region of provenances: Papua New Guinea and Far North Queensland (Table 1).
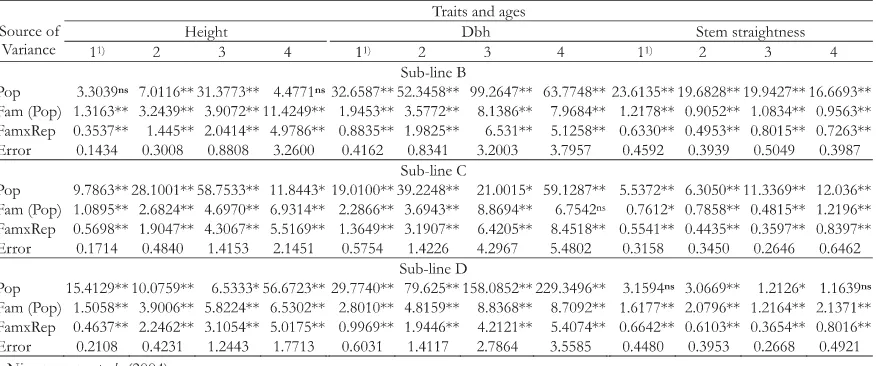
Analysis of variance for each sub-line estimated using Equation (1) revealed that the differences between the improved and unimproved populations were statistically significant for all sub-lines and ages, except for height in line B and stem straightness in
Sub-Table 3. Mean of square for each component of three traits analyzed in each sub-line in four age measurements
1)
Nirsatmanto . (2004)
Remarks: Pop : Population; Fam : Family; Rep : Replication **, siginificant at 1 % level
ns, not significant
line D at one and four years of age (Table 3). The non significant difference was found mainly in the case where the realized genetic gain was lower. Besides the significant differences in population, almost all of the family variations on the three traits were also consistently significant along the four year measurements. This result indicated that the amount of genetic improvement could be continuously attained through the second-generation of tree improvement.
Analysis of variance by pooling data across the three sub-lines estimated using Equation (2) showed that the population difference was also statistically significant for all the three traits and ages, except for stem straightness at the first year of age (Table 4). As described in the previous study that this non significant for stem straightness was due to the evident of sub-line x population interaction (Nirsatmanto . 2004). The result of analysis of variance across the three sub-lines was in line with the result of analysis of variance in each sub-line presented in Table 3. It indicated that the superiority of improved
et al ,
population observed in this study was consistent, and thus, the amount of realized genetic gain from the first-generation selection was evident up to four years of age.
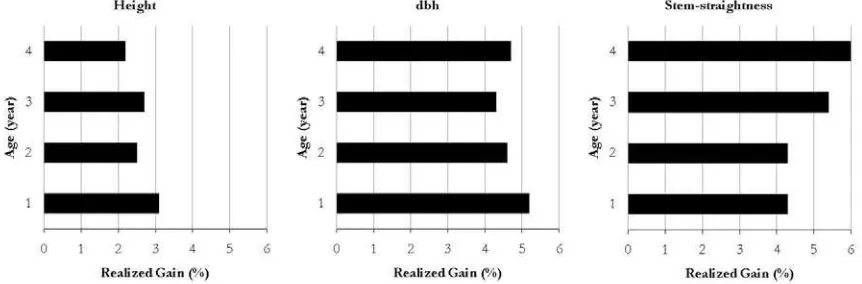
Mean of realized genetic gain across the three sub-lines varied depending on the ages, ranging from 2.2% to 3.1% for height, 4.3% to 5.2% for dbh and 4.3% to 6% for stem straightness (Figure 1). The realized genetic gain tended to be slightly decreased with the increasing ages for height and dbh, while they were increased for stem straightness. In the first and two years of ages, the greatest gain was dbh, then followed by stem straightness. By contrast, in the three and four year of ages, the greatest gain was stem straightness, then followed by dbh. Among the three traits, tree height was consistently low along four years growth. The greater genetic gain for stem straightness in the last two years might be due to the positive effect of within-plot thinning that was practiced twice in the orchards after two years of age. As reported by Hubert . (2003) thinning had a positive effect on stem straightness.
et al ,
Table 4. Mean of square for each component of three traits analyzed across the three sub-lines in four age measurements
Source of Variance
df
Traits and ages
Height Dbh Stem straightness
11) 2 3 4 11) 2 3 4 11) 2 3 4
SL 2 6.7502** 23.0440** 90.3004** 88.1911** 6.4839** 19.9538** 29.6748** 13.8209** 0.2884** 0.0210** 0.2188** 1.9145** Rep(SL) 27 0.1316ns 0.7655** 1.2181** 4.4285** 0.2718ns 0.4558** 0.7813** 0.8813** 0.0888ns0.0411** 0.0660** 0.3218** Pop 1 0.2306* 0.3713** 1.1593** 1.0166** 0.7173* 1.5682** 2.4241** 6.3115** 0.2443ns0.2394** 0.4183** 0.4950**
SL X Pop 27 0.0106ns 0.1727ns 0.0811ns 0.1881ns0.0084ns 0.0187ns 0.3560ns 0.3374ns0.0258** 0.0196ns0.0644** 0.0489ns
Error 59 0.0059 0.0241 0.0631 0.1271 0.0160 0.0396 0.1254 0.1570 0.0044 0.0059 0.0070 0.0202
1)
Nirsatmanto . (2004) Remarks: Sl Sub-line ** siginificant at the level 1 % ns not significant
et al ,
:
:
However, it might be controlled genetically as well, because the heritability on this trait was moderately high at around 0.25 - 0.50 (Kurinobu
. 1996; Nirsatmanto and Kurinobu, 2002). The amount of realized genetic gain for tree height in this study was similar to the predicted genetic gain reported in the previous study by Kurinobu . (1996). Whereas for dbh and stem straightness, the realized gain was greater than the predicted one. In the previous study, predictions of total genetic gains calculated as an accumulation gain due to within-plot and family selection were reported averaging at around 2.8% for height, 3.2% for dbh and 2.6% for stem straightness. However, it should be noted that improved population as used in the present study was plus trees selected from the first-generation SSO. Therefore the greater gain to those in the previous study was partly due to the additional selection intensity that had been allocated at the time of plus trees selection. The selection rate for plus trees selection in the first-generation SSO of
was around 3%, while those for final density due to total within and between family selection was around 15% (Nirsatmanto , 2004).
Unlike family selection that was done theoretically oriented and straightforward, plus tree selection was done mainly based on superiority of phenotypic perfor mance. Moreover, the unique property of
performance showed that large phenotypic variance was mostly dominated by dbh and stem straightness. These facts lead the plus trees selection practiced in first-generation SSO tended to emphasize on the both dbh and stem straightness traits rather than tree height. In addition, plus tress selection in this study was practiced at almost six years old where the tree height was commonly difficult to be observed as the tree growth progressed and the crown closure. As a result, gain due to plus trees selection was greater for dbh and stem straightness compared to tree height. Similar trend was also observed during within-plot selection which was practiced mainly based on phenotypic performance (Kurinobu
. 1996).
The amount of realized genetic gain obtained in this present study could be potentially increased, if the intensity of family selection increases. This is because of the fact that the et
actual of pollen parent retained in the first-generation SSO was only 15 %, which was attributed to at least 90% of family selection rate or almost no family selection practiced (Kurinobu . 1998). However, the low selection intensity for family might be better to maintain the genetic variability in the orchards, despite it would bring some reduction in the expecting of genetic gain. Lower selection intensity is also recommended especially in the first generation orchards due to the less reliable result of family ranking caused by the great variation of out crossing rate and neighborhood inbreeding among families (Harwood . 1997). A comparison study using microsatellites markers showed that the outcrossing rates of varied among the original populations, ranging from complete selfing to complete outcrossing, depending on the levels of diversity (Butcher . 1999).
Despite the trend of realized genetic gain observed in this study varied dependent on the traits: slightly decreased for growth and increased for stem straightness, outstanding performances of plus trees selected at an older age in the first-generation orchards (around six years) were consistent and well reflected up to the half of rotation ages of their second-generation. This result confirmed that the juvenile-mature correlation for was strong The trend of genetic gain also indicated that the effect of G x E interaction between the locations of original plus trees was weak. This is because genetic material collected from the first-generation orchards in South Sumatera (Sub-lines B and D) showed good performance when planted in South Kalimantan. These results provided two good implications for generating future advanced generation breeding strategy of . Firstly, the strong juvenile-mature correlation will provide high efficiency of early selection practiced in the SSO. Secondly, the weak interaction will provide possibility to combine data from the range of different test locations to be used together in order to conduct more accurate family selection.
generation seedling seed orchard of , perfor mances of improved population produced from the first-generation seedling seed orchard was consistently better than those of unimproved. This result confirmed that selection procedures practiced in the first-generation seedling seed orchard had been done properly.
2. The realized genetic gain across three sub-lines at four year age measurements ranged from 2.2% to 3.1% for height, 4.3% to 5.2% for dbh and 4.3% to 6% for stem straightness.
3. Trend of the realized genetic gains were slightly decreased for dbh and tree height with the increasing of ages, while it was slightly increased for stem straightness.
Butcher, P.A., J.C. Glaubitz and G.F. Moran. 1999. Applications for microsatellites markers in the domestication and conservation of forest
trees. 27:34-42.
Eldridge, K., J. Davidson., C. Harwood and G. van Wyk. 1993. Eucalypt domestication and breeding. Claredon Press, Oxford, 288p. Harwood, C.E, D. Alloysius, P. Pomroy, K.W.
Robson and N.W. Haines. 1997. Early growth and survival of
provenances in a range of tropical environments, compared with ,
and .
14(3):203-219.
Hashimoto, K, S. Kurinobu and H. Suhaendi. 1996. Establishment of seed sources of tropical tree species in Indonesia. : Dieters, M.J., A.C. Matheson, D.G. Nikles, C.E. Harwood, S.M. Walker ( ) Tree improvement for sustainable tropical forestry. Proceeding of the QFRI-IUFRO Conference, Caloundra, Australia. 27 October - 1 November 1996. pp370-371. Hubert, J., B. Gardiner., E. Macdonald and S.
Mochan. 2003. Stem straightness in Sitka spruce. In: Forest Research Annual Report and Account. Forestry Commission, Edinburgh. pp62-69. urophylla Acacia mangium New Forest
In eds REFERENCES
Kieding, H., E.B. Lauridsen and H. Wellendorf. 1984. Evaluation of a series of teak and gmelina provenance trials selection of traits, their assessment and analysis of observations. : Barnes, R.D., G.L. Gibson ( ) Proceedings of Joint Work Conference on provenance and genetic improvement strategies in tropical forest trees. Mutare, Zimbabwe. 9-14 April 1984. pp30-69. Kurinobu, S., A. Nirsatmanto and B. Leksono.
1996. Prediction of genetic gain by within-plot selection in seedling seed orchards of
and with an
application of retrospective selection index. : Dieters, M.J., A.C. Matheson, D.G. Nikles, C.E. Harwood, S.M. Walker ( ) Tree improvement for sustainable tropical forestry. Proceeding of the QFRI-IUFRO Conference, Caloundra, Australia. 27 October - 1 November 1996. pp158-163.
Kurinobu, S., A. Nirsatmanto and H. Kawasaki. 1998. Strategy and procedure of tree improvement toward second generation breeding. Technical Cooperation Project on Forest Tree Improvement Phase II JICA-FORDA.
Kurinobu, S and A. Rimbawanto. 2002 Genetic improvement of plantation species in I n d o n e s i a - S u m m a r y o f P r o j e c t A c h i e ve m e n t ( J I C A Fo r e s t Tr e e Improvement Phase II). : Rimbawanto, A, M. Susanto ( ) Proceedings of International Conference on advances in genetic improvement of tropical tree species. Centre for Forest Biotechnology and Tree Improvement, Yogyakarta, Indonesia. 1-3 October 2002. pp1-6. Mc. Keand, S.E. and W.F. Beineke. 1980 Sublining
for half-sib breeding population of forest trees. Silvae Genetica 29: 14-17
Nirsatmanto, A. and S. Kurinobu. 2002. Trend of within-plot selection practiced in two seedling seed orchards of
in Indonesia. 7:
49-52.
Nirsatmanto, A, B. Leksono, S. Kurinobu and S. Shiraishi. 2004. Realized genetic gain
In Journal of Forest Research
observed in second-generation seedling
seed orchards of in South
Kalimantan, Indonesia. 9:265-269.
St. Clair, J.B. 1993. Evaluating realized genetic gains from tree improvement. : Burkhart, H.E., T.G. Gregoire, J.L. Smith ( ) Modeling stand response to silvicultural
Acacia mangium
Journal of Forest Research
In
eds
practices. Proceeding of the IUFRO S4.01 Conference, Blacksburg, Virginia, USA. 27 September - 1 October 1993. pp145-157. Wright, J.W. 1976. Introduction to forest genetic.
Academic Press. New York. 463p.