ABSOLUTE VICARIOUS CALIBRATION OF RECENTLY LAUNCHED INDIAN
METEOROLOGICAL SATELLITE: INSAT-3D IMAGER
Piyushkumar Patela, , Hiren Bhatta and A K Shuklaa
a
Calibration Validation Division,
Space Applications Centre (ISRO), Ahmadabad – 380015
Commission VI, WG VI/4
KEY WORDS: INSAT-3D, Calibration, Radiance, Atmosphere, Radiometry, Measurements, Remote Sensing
ABSTRACT:
Looking towards the advancements and popularity of remote sensing and an ever increasing need for the development of a variety of new and complex satellite sensors, it has become even more essential to continually upgrade the ability to provide absolute calibration of sensors. This article describes a simple procedure to implement post-launch calibration for VIS and SWIR channels of INSAT-3D imager over land site (Little Rann of Kutch (ROK), Gujarat) on three different days to account for characterization errors or undetermined post-launch changes in spectral response of the sensor. The measurements of field reflectance of study site (of extent ~ 6km x 6 km) in the wavelength range 325-2500 nm, along with atmospheric parameters (Aerosol Optical Depth, Total Columnar Ozone, Water Vapor) and sensor spectral response functions, were input to the 6S radiative transfer model to simulate radiance at top of the atmosphere (TOA) for VIS and SWIR bands. The uncertainty in vicarious calibration coefficients due to measured spatial variability of field reflectance along with due to aerosol types were also computed for the INSAT-3D imager. The effect of surface anisotropy on TOA radiance was studied using a MODIS Bidirectional Reflectance Distribution Function (BRDF) product covering the experimental site. The results show that there is no indication of change in calibration coefficients in INSAT-3D imager, for VIS and SWIR band over Little ROK. Comparison made between the INSAT-INSAT-3D imager measured radiance and 6S simulated radiance. Analysis shows that for clear sky days, the INSAT-3D imager overestimates TOA radiance in the VIS band by 5.1% and in the SWIR band by 11.7% with respect to 6S simulated radiance. For these bands, in the inverse mode, the 6S corrected surface reflectance was closer to field surface reflectance. It was found that site spatial variability was a critical factor in estimating change in sensor calibration coefficients and influencing uncertainty in TOA radiance for Little ROK.
Corresponding Author: Piyushkumar N. Patel
Space Applications Centre, Ahmedabad. email:[email protected]
1. INTRODUCTION
With the advancement of remote sensing, the accurate characterization of the conversion of digital counts to radiance values, known as absolute calibration. Post- launch calibration is important to remote sensing because it enables a comparison of responses of pre-launch satellite sensors and the ability to monitor their changes over time, which improves the quality of satellite sensor and data products. Calibration and validation are essential activities to maintain the performance of the satellite sensors and its data products. Vicarious calibration provides a method for absolute calibration of satellite sensors using reference and accurate measurements of spectral reflectance from the ground instruments. This absolute calibration produces the calibration coefficients that can be replaced with pre-launch laboratory derived coefficients. Prior to launch, on-board calibration (Bruegge et al., 1993) and radiometric calibration (Bruegge et al., 1998) are the parts of calibration procedures but where the on-board calibration facility does not exist for the necessity of absolute calibration, in that case, a post-launch calibration is needed to compensate the degradation of the satellite sensor (Rao, 2001). A vicarious calibration is practise to monitor the radiometric performance of satellite sensor, which involves the computation of uncertainties in the calibration coefficients to correct the radiometric response of
the satellite sensor (Thome et al., 1998). Vicarious calibration is a process to simulate the radiance value using field measurement of field reflectance and atmospheric parameters in the homogenous conditions to those at the satellite level. INSAT-3D satellite was launched on 26th July 2013 using an Ariane 5 ECA launch vehicle from Kourou, French, Guyana. It carries mainly two payloads, (1) 6-channels Imager and (2) 19-channels atmospheric sounder, which operate in visible to thermal infrared region. Vicarious calibration was performed to monitor the in-orbit degradation of INSAT-3D imager. This study details the post-launch vicarious calibration performed using high reflectance target site with uniform and flat terrain (Little Rann of Kutch) for VIS (0.55-0.75 µm) and SWIR (1.55-1.70 µm) channels of the INSAT-3D imager, for justification of post-launch changes in the sensor response. These channels have 1km spatial resolution and 30 minutes temporal resolution. The reflectance-based approach was used with field measured surface reflectance and measurements of atmospheric parameters (aerosol optical depth (AOD), total columnar ozone and water vapor) for three different days (12th February, 2nd March and 6th March 2014). These measured quantities along with spectral response function (pre-launch laboratory measured) were input to the 6S radiative transfer (RT) code for the simulation of TOA radiance for both the channels. The 6S simulated radiance was compared with the INSAT-3D imager The International Archives of the Photogrammetry, Remote Sensing and Spatial Information Sciences, Volume XL-8, 2014
derived radiance to compute the calibration coefficients for both the channels. The uncertainties due to various factors (e.g. measurements of surface reflectance, selection of aerosol model, surface anisotropic effect and 6S model uncertainties) were computed for the vicarious calibration coefficients of INSAT-3D imager.
2. SITE AND DATA
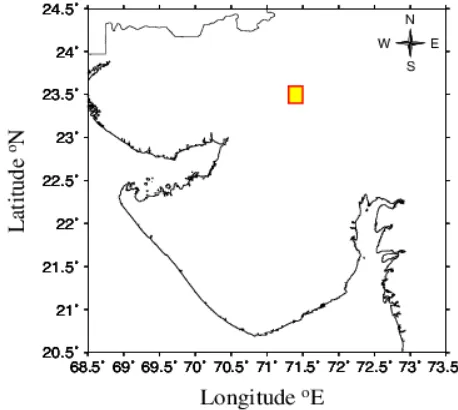
We used high reflectance site in Little Rann of Kutch (ROK) to perform the vicarious calibration. The experimental site is placed about 10 kilometres away from Amarapura village, Patan in the Little ROK, Gujarat. The centre of the site used for calibration is located at 23.51˚ N and 71.40˚ E.
Figure 1. Location of calibration site in red square box placed in Little Rann of Kutch
The area of the site presents a smooth and homogenous surface characterized by a good spatial uniformity, which is used for radiometric calibration of sensors with large foot print e.g. INSAT-3D imager. Figure 1 describes the location of calibration site. Analytical Spectral Device (ASD) Spectroradiometer was used for the measurements of field reflectance in the 6km x 6km region in the study site, prior to this spectroradiometer is validated with other spectroradiometer in laboratory. Data have been collected at an interval of 1 km. The retrieved daily mean surface reflectance of 3 days is shown in figure 2. The surface reflectance data was collected in frame wise (1 frame = 6km x 1km). We covered two consecutive frames (6km x 2km) within ±15 minutes (first half hour) of satellite pass and similarly second and third frames in second and third half hour. The high temporal resolution of geostationary satellite (INSAT-3D) is the reason to follow the frame wise data collection.
The analysis has been carried out to investigate the spatial uniformity and temporal stability of the site. We have analyzed the variation of daily mean reflectance to monitor the site temporal stability (Figure 2) and coefficient of variation (CV) for spatial uniformity (Figure 3).
Figure 2 shows the typical measured surface reflectance for the three different days. Water vapor absorption at 1380nm and high atmospheric absorption at1800nm are the major reasons
for the two gaps in the reflectance curves. We excluded the unreliable data from the figure 2. Variation in surface reflectance is found to be very small 1.6% in VIS and 2.2% in SWIR channel, which indicates the uniform site for calibration of satellite sensors.
Figure 2. Variation of spectral field reflectance measured at Little ROK on 3 days
Figure 3 describes the coefficient of variation in the field reflectance over the calibration site in the two INSAT-3D imager channels to check the spatial uniformity of site. This figure illustrates that the variation of CV is very small in two channels, of the order of mean 1-2% in VIS and SWIR. The variation of CV is almost similar in both channels. These results indicate that the little ROK site undergoes very small changes to its surface. These changes may be caused by variations in meteorological conditions that can be quite variable.
Figure 3. Analysis of coefficient of variation (CV) using measurements of field reflectance over Little ROK for both the
channels
The aerosol optical depth, total columnar ozone, and column water vapor are measured using Microtops-II Sunphotometer The International Archives of the Photogrammetry, Remote Sensing and Spatial Information Sciences, Volume XL-8, 2014
and Ozone monitor respectively at every 1km interval. The measured aerosol optical depths are shown in figure 4.
Figure 4. Spectral variation of aerosol optical depth (AOD) measured using Microtops-II sunphotometer at Little ROK for
three different days.
3. METHODOLOGY
In this study, vicarious calibration was performed using reflectance based approach, which was provided by Slater et al., (1987). This technique has been successfully used for satellite’s sensor calibration (Biggar et al., 1991; Gellaman et al., 1993). In this technique, the INSAT-3D imager derived radiance is compared with 6S simulated TOA radiance. The vicarious radiometric calibration depends on measuring the surface reflectance, path from the sun to earth’s surface and earth’s surface to sensor and atmospheric optical thickness over a calibration site at the time of satellite overpass. These measurements are used as an input for RT code to simulate an absolute radiance at the sensor level. The field measurements are used to define the spectral directional reflectance of the surface and the spectral optical depth that are used to describe the aerosol and molecular scattering effect in the atmosphere (Gellman et al., 1991) and along with this we used columnar water vapor include the water vapor absorption effect. The detailed values of atmospheric parameters are given in table 1.
Days AOD @
550 nm
Total Ozone Content (DU)
Water Vapor (g cm-2)
12th Feb 0.32 295.74 0.75
2nd Mar 0.43 286.24 0.87
6th Mar 0.41 265.56 1.04
Table 1. Mean values of atmospheric parameters over Little ROK
We have used 6S RT code to compute the radiance using ground measurements, which predicts the satellite signal at TOA level using field measurements. 6S RT model is a physically based model, not specified for particular satellite. In addition, 6S RT model utilizes gaseous absorption and scattering by aerosols and molecules. 6S performs better for atmospheric scattering as compared to other RT models (Markham et al., 1992).
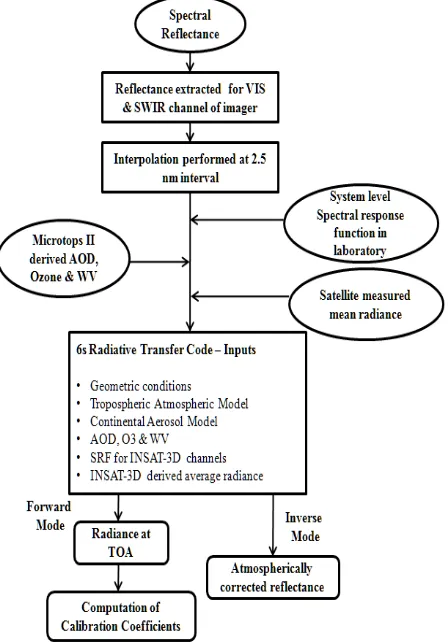
Figure 5. Flow chart for the simulation of TOA radiance and calibration coefficient
6S model was formulated for the atmospheric correction in the short wavelengths. Figure 5 describes the flow chart to simulate radiance at TOA and vicarious calibration coefficient. The US 62 standard atmosphere profile provides the profiles of water vapor, ozone, pressure and temperature up to 100km, at discrete intervals of 34 layers in the 6S RT model (Vermote et al., 2006).
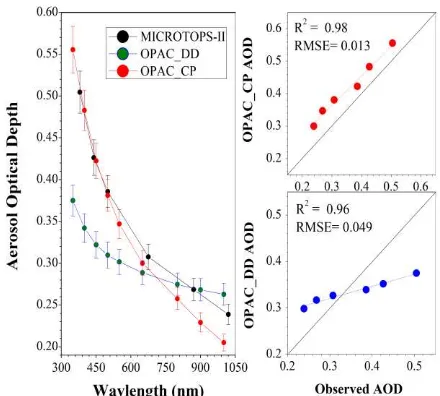
For the selection of optimum aerosol model, we have made comparison between observed spectral AOD and model simulated spectral AOD data. We have estimated spectral AOD data using Optical Properties of Aerosols and Clouds and (OAPC) model (Hess et al., 1998) for the different aerosols models (e.g. continental pollution (CP) and Desert dust (DD)). The results from the OPAC have been compared with the measured AOD data in figure 6. The result reveals that OPAC derived spectral AOD using continental polluted (CP) model has a good correlation (R2=0.98, RMSE=0.013) with the measured datasets. CP model derived AOD is very well matched at the shorter wavelength, which lead to increase the AOD value at shorter wavelength. AOD simulated using DD model has a good correlation (R2=0.96, RMSE=0.049) at longer The International Archives of the Photogrammetry, Remote Sensing and Spatial Information Sciences, Volume XL-8, 2014
wavelength due to the scattering nature of dust particles, which increase the AOD at both the wavelengths (Schuster et al., 2006). The result describes that the calibration site is influenced by both continental aerosol and desert dust, but as per the statistical correlation, the influence of continental aerosol is more over the site than the desert dust. For the calibration purpose, we have chosen a continental aerosol model (a composite with 0.70% of dust like, 0.29% of water-soluble and 0.01% of soot component) for the radiance simulation. Continental aerosol model is the basic model over the land site and it is assumed that there is no impact of marine and polluted urban aerosols over Little ROK.
Figure 6. Comparison between measured and OPAC simualted spectral AOD daily mean values
We have used pre-launch laboratory measurements of spectral response function as an input, which is shown in figure-7 (Murali and Padmanabhan, 2011). Both the SRF and ground reflectance data are resampled to 2.5 nm intervals using spline interpolation method.
Figure 7. Pre-launch measurements of spectral response function for VIS and SWIR channels
The 6S computes TOA radiance and atmospherically corrected surface reflectance in the forward and inverse mode respectively. 6S RT model provides an output in the form of TOA radiance, which is divided by the corresponding radiance observed by the INSAT-3D imager to yield vicarious calibration
coefficients. Same as this, 6S provides atmospherically corrected reflectance as an output for a given radiance in the inverse mode, which are compared with the ground measured reflectance by Spectroradiometer.
3.1 Analysis of BRDF effect
Surface albedo is related to surface reflectance that depends on the bidirectional reflectance distribution function (BRDF), it indicates how the reflectance depends on solar and view geometry (Nicodemus et al., 1977). Reflectance of light is an anisotropic phenomenon and this anisotropy is very small compared to Lambertian component except surface reflectance from water. The precise computation of surface reflectance requires the anisotropy estimation. The BRDF effect provides a precise computation of uncertainty in reflectance arising due to the neglecting anisotropy. We provided this BRDF effect into 6S using MODIS derived BRDF product (MCD43A1), is used to compute the effects of surface anisotropy on TOA radiance. The high-quality data product MCD43A2 provides high quality three Ross-Li BRDF model parameters (isotropic, volume scattering and geometric optical reflectance terms), which was pixel wise implemented into 6S RT model to estimates BRDF effect after resampled for 1 km. We used approximately common channels for MODIS and INSAT-3D imager. MODIS provides BRDF coefficients in the seven MODIS Land channels as well as three broad channels. In which, we used MODIS first broadband (0.4-0.7 µm) for VIS (0.55-0.75 µm) channel of INSAT-3D imager and MODIS SWIR channel (1.628-1.652 µm) for SWIR channel (1.55-1.70 µm) of INSAT-3D imager. The 6S RT model was run with and without BRDF for the estimation of BRDF effect radiance at top of the atmosphere.
4. RESULTS AND DISCUSSIONS
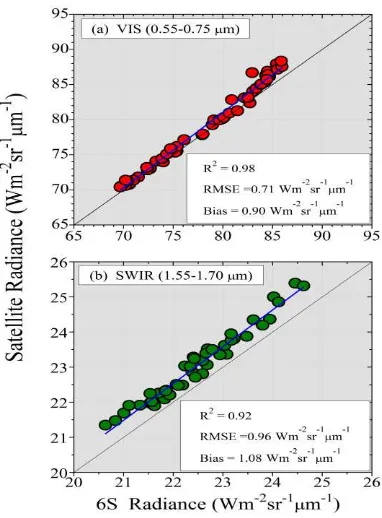
The 6S simulated TOA radiance was compared with the INSAT-3D imager radiance. The result of combined linear regression for VIS and SWIR is shown in figure 8. The good statistical agreement was observed between satellite-derived radiance and simulated radiance, with R2 values of 0.98 and 0.92 and with RMSE values of 0.71 and 0.96 for the VIS and SWIR channels respectively. The bias between satellite-derived radiance and 6S simulated radiance is minimal, with the values of 0.90 Wm-2sr-1µm-1 and 1.08 Wm-2sr-1µm-1 for VIS and SWIR channels respectively. On an average, RE between the 6S simulated and satellite derived radiance is -1.10% and -4.53% in VIS and SWIR channel respectively, i.e. INSAT-3D imager overestimates the radiance values by 1% and 5% in the VIS and SWIR channels.
Similarly, atmospherically corrected surface reflectance was estimated using 6S code in inverse mode. The 6S simulated atmospherically corrected surface reflectance was compared with the field reflectance using radiometer for VIS and SWIR channels is shown in the figure-9. The field reflectance from spectral radiometer for INSAT-3D spectral channels (VIS & SWIR) are plotted against the 6S simulated atmospherically corrected reflectance for the Little ROK site. The result of this comparison is shown in the figure-9.
The ±2% error bars represent the standard deviations of the measurement datasets only, not to measurement uncertainties. It was observed that the 6S simulated atmospherically corrected reflectance matches well with the field reflectance for both the channels, with R2 values of 0.99 and 0.93 and RMSE values of 0.2 and 0.3 for VIS and SWIR respectively.
Figure 8. Comparison of the 6S radiance with INSAT-3D imager radiance for VIS and SWIR bands over Little ROK.
Figure 9. Comparison between 6S atmospherically corrected reflectance and field reflectance using spectroradiometer
The agreement is found within ±2% for both the VIS and SWIR spectral channels. It was found that errors are increasing with the wavelength and the low errors in the shorter wavelength
indicate the very good agreement in the VIS channel than longer wavelength. A detailed statistical result of the comparison of radiance and reflectance are given in table 2. The result indicates the 6S RT model works well in both forward and inversion mode. Satellite sensor measured and 6S simulated mean TOA radiances, along with the standard deviation are shown in figure 10. It was observed that the radiance from the satellite is slightly higher than simulated TOA radiance at both the channels (less than 5%).
*Radiance in (Wm-2sr-1µm-1)
Table 2. Summary of the statistical results of comprison between INSAT-3D imager and 6S radiance along with comparison between Ground and 6S reflectance for VIS and SWIR bands.
Figure 10. Daily variation of 6s radiance and INSAT-3D imager radiance for both channels over Littel ROK.
The differences between satellite and 6S RT derived radiance at VIS channel are relatively large compared to SWIR channel due to the differences in radiance range. The radiance variation from
Channels R2 Bias RMSE RE(%)
VIS
(Radiance) 0.98 0.90 0.71 -1.10
SWIR
(Radiance) 0.92 1.08 0.96 -4.53
VIS
(Reflectance) 0.99 0.2 0.2 -0.77
SWIR
(Reflectance) 0.95 0.5 0.3 -1.49
figure 10 indicates the INSAT-3D overestimates the radiance and vicarious calibration coefficient derived from measurements at the Little ROK site over the three days. From table 3, the mean values of simulated and satellite observed radiance are highly comparable throughout the two channels of INSAT-3D imager. The differences between simulated and observed radiance are very small which is due to the intrinsic variability and meteorological variability of the sites. It was observed that radiance values for the VIS channels are more comparable than SWIR for the Little ROK.
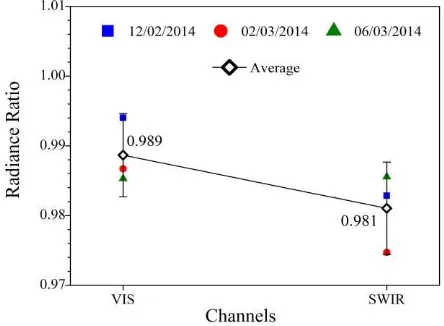
Figure 11. Mean value of vicarious calibration coefficients, which are the ratio of 6S and satellite radiance at TOA.
The vicarious calibration coefficient is the ratio of 6S simulated radiance and satellite observed radiance in the case of INSAT-3D imager. For an ideal case, if there is no degradation in the sensor during launch and ground and atmosphere are absolutely characterized and have an accurate RT code, simulated TOA radiance should precisely match with satellite observed radiance.
It means the ratio of simulated to observe radiance should be unity. In practice it is not possible, there are uncertainties in field reflectance and atmospheric measurements, modelling uncertainties in the RT code.
Figure 11 describes the ratio of the TOA radiance simulated using ground measured data to the INSAT-3D imager derived radiance for each channel and each day along with average value. The vicarious calibration coefficient data for INSAT-3D imager describes minor changes in the calibration of INSAT-3D imager for both the channels and the change is slightly more in SWIR channel with respect to VIS. The standard deviation of the calibration coefficient is less than 2% for each channel in figure 11. The ratio is decreasing with wavelength but generally, ratio does not depend on the wavelengths. This study aims towards the methodology followed and indicates that the associate with uncertainties in the atmospheric conditions or due to surface variation. The relatively small biases in the VIS and SWIR channels are well in agreement with the INSAT-3D imager radiometric uncertainty. The noted values were found to be consistent, which indicate good calibration stability of INSAT-3D imager.
4.2 Uncertainty Analysis
The simulated TOA radiance depends on many variables (i.e. atmospheric parameters, geometry, surface reflectance measurements, sensor response function, and radiative transfer code etc). For this study, many factors are affecting the accuracy of the calibration. The combined uncertainties are given for both the channels.
[1] (σ1): The uncertainty in the reflectance measurement is due
to variation in the surface characteristics over the region. This uncertainty is estimated by calculating the standard error for each channel and the average relative errors are
Table 3. The values of radiance, reflectance, and calibration coefficient are summarized for both the channels of the INSAT-3D imager (VIS and SWIR).
[2] (σ2): The uncertainty arises due to 6S RT model. The error
in the 6S RT model is figured out to be approximately 2% according to the error in radiative transfer theory.
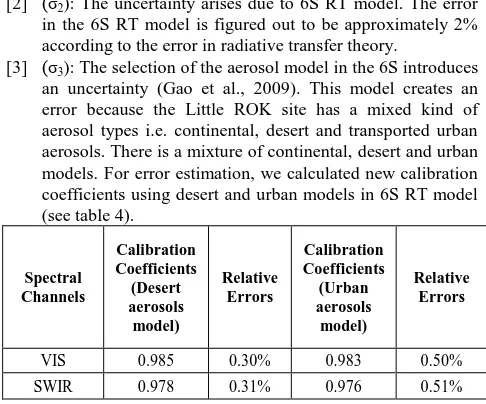
[3] (σ3): The selection of the aerosol model in the 6S introduces
an uncertainty (Gao et al., 2009). This model creates an error because the Little ROK site has a mixed kind of aerosol types i.e. continental, desert and transported urban aerosols. There is a mixture of continental, desert and urban models. For error estimation, we calculated new calibration coefficients using desert and urban models in 6S RT model (see table 4).
Table 4. The uncertainties arise due to selection of other aerosol models in 6S RT model.
[4] (σ4): The Bi-directional Reflectance Distribution Function
(BRDF) effect is introducing an uncertainty into calibration coefficient. Table 5 represents the daily mean uncertainty due to the BRDF effect in both the channels. We used mean values of BRDF effect of all three days for uncertainty
Table 5. The uncertainties introduced by BRDF effect for both the channels.
The overall uncertainty (only error related to desert aerosol is considered) is estimated using following equation:
From the above analysis, the overall uncertainty is found to be 2.63% for VIS and 3.11% for SWIR channels of INSAT-3D preferred site for post-launch calibration due to high degree of homogeneity, which helps to derive precise vicarious calibration coefficients.
2) The spatial and temporal variability of site is quantified by the variation of mean reflectance and coefficient of variation. The mean reflectance varies by 1.6% for VIS and
2.2% for the SWIR channels, the CV was found to be lesser for the Little ROK site (1%-2%) in both the channels of vicarious calibration coefficients for the INSAT-3D imager is 1.3% for VIS and 1.9% for SWIR for all three days over Little ROK site.
5) Very good statistical agreement was observed between ground-measured reflectance and 6S simulated atmospherically corrected reflectance in the inverse mode. 6) Uncertainty in TOA radiance due to selection of aerosol
model is much less. The uncertainty is found to be ~0.3% for desert model and ~0.5% for urban model with respect to continental model.
7) Uncertainty due to BRDF effect is estimated using MODIS BRDF products, which was found to be 0.52% and 0.89% for VIS and SWIR channels respectively.
8) The estimated overall uncertainties in the calibration coefficients are found to be 2.63% in VIS and 3.11% in SWIR channels of INSAT-3D imager.
ACKNOWLEDGMENT
The authors gratefully acknowledge the encouragement received from Director, SAC for carrying out the present research work. Valuable suggestions received from Deputy Director, EPSA and Group Director, ADVG are also gratefully acknowledged.
REFERENCES
C. J. Bruegge, A. E. Stiegman, R. A. Rainen, and A. W. Springsteen. (1993). Use of Spectralon as a diffuse reflectance standard for in-flight calibration of earth-orbiting sensors. Optical Engineering. 32. pp. 805–814.
C. J. Bruegge, V. G. Duval, N. L. Chrien, R. P. Korechoff, B. J. Gaitley, and E. B. Hochberg. (1998). MISR prelaunch instrument calibration and characterization results. IEEE Transactions on Geoscience and Remote Sensing. 36. pp. 1186–1198.
C. R. N. Rao. (2001). Implementation of the Post-Launch Vicarious Calibration of the GOES Imager Visible Channel. (Camp Springs, MD: NOAA Satellite and Information Vicarious Calibration joint campaign at Lunar Lake Playa, Nevada (USA). Metrologia. 35. pp. 631–638.
P. N. Slater, S. F. Biggar, R. G. Holm, R. D. Jackson, Y. Mao, M. S. Moran, J. M. Palmer, B. Yuan. (1987). Reflectance- and radiance-based methods for the in-flight absolute calibration of multispectral sensors. Remote Sensing of Environment. 22. pp. 11–37.
S. F. Biggar, M. C. Dinguirard, D. I. Gellman, P. Henry, R. D. Jackson, M. S. Moran, P. N. Slater. (1991). Radiometric The International Archives of the Photogrammetry, Remote Sensing and Spatial Information Sciences, Volume XL-8, 2014
calibration of SPOT 2 HRV: a comparison of three methods. Proc. SPIE. 1493. pp. 155-162.
D. I. Gellman, S. F. Biggar, M. C. Dinguirard, P. J. Henry, M. S. Moran, K. J. Thome, P. N. Slater,. (1993). Review of SPOT-1 and -2 Calibrations at White Sands from Launch to the Present. Proc. SPIE. 1938. pp. 118-125.
D. I. Gellman, S. F. Biggar, P. N. Slater, and C. J. Bruegge. (1991). Calibrated intercepts for solar radiometers used in remote sensor calibration. Proc. SPIE. 1493. pp. 19–24.
B. L. Markham, R. N. Halthore, S. J. Goetz. (1992). Surface reflectance retrieval from satellite and aircraft sensors: results of sensor and algorithm comparison during FIFE. Journal of Geophysical Research. 97 (D17). pp. 18785-18795.
E. Vermote, D. Tanre, J. L. Deuze, M. Herman, J. J. Morcrette, S. Y. Kotchenova. (2006). Second Simulation of Satellite Signal in the Satellite Spectrum (6S). 6S User Guide Version 3. University of Maryland.
Hess M., Koepke P., and Schultz I., 1998. Optical properties of aerosols and clouds: The software package OPAC. Bull. Am. Meteorol. Soc., 79, 831–844.
Schuster G.L., Dubovik O., Holben, B.N., 2006. Angstrom exponent and bimodal aerosol size distributions. J. Geophys. Res., 111: D07207, doi:10.1029/2005JD006328.
K. R. Murali, and D. Padmanabhan, "Spectral response details, INSAT-3D imager (FM)-V-2.0," Space Applications Centre, ISRO, Ahmedabad, Gujarat, India, Technical Report, Doc No: SAC/EOSG/GPID/30/03/2011/17, 2011.
F. E. Nicodemus, J. C. Richmond, J. J. Hsia, I. W. Ginsberg, T. Limperis. (1977). Geometrical considerations and nomenclature for reflectance. Natl. Bur. Stand. Rep. NBS MN-160. 52 pp.
Gao, H. L., X. F. Gu, T. Yu, X. Y. Li, T. H. Cheng, H. Gong,
and J. G. Li. 2009. “Radiometric
Calibration for HJ-1a Hyper-Spectrum Imager and
Uncertainty Analysis.” Acta Photonica Sinica
38: 2826–33.
S. F. Biggar, P. N. Slater, and D. I. Gellman. (1994). Uncertainties in the in-flight calibration of sensors with reference to measured ground sites in the 0.4 to 1.1 _m range. Remote Sensing of Environment. 48. pp. 242–252.
P. N. Slater, S. F. Biggar, J. M. Palmer, K. J. Thome. (1995). Unified approach to pre- and in-flight satellite sensor absolute radiometric calibration. Proc. SPIE. 2583. pp. 130–141.
K. Thome, B. Markham, J. Barker, P. Slater, S. Biggar. (1997). Radiometric calibration of Landsat. Photogramm. Eng. Remote Sensing. 63. pp. 853–858.
J. Yang, P. Gong, R. Fu, M. Zhang, J. Chen, S. Liang, B. Xu, J. Shi, R. Dickinson. (2013). The role of satellite remote sensing in climate change studies. Nature Climate Change. 3. pp. 875–883.