Statin treatment increases the sialic acid content of LDL in
hypercholesterolemic patients
Nina Lindbohm, Helena Gylling, Tatu E. Miettinen, Tatu A. Miettinen *
Department of Medicine,Helsinki Uni6ersity Central Hospital,PO Box 340,FIN 00029HYKS,Helsinki, Finland
Received 25 May 1999; received in revised form 17 September 1999; accepted 4 October 1999
Abstract
Low density lipoprotein (LDL) with low sialic acid content has been reported to cause intracellular cholesterol accumulation, and therefore desialylation has been proposed to be an atherogenic modification of LDL. However, it is not known whether hypolipidemic treatment has any effect on LDL sialylation. Accordingly, we investigated the sialic acid/apolipoprotein (apo) B ratio of total LDL and its subfractions in 26 moderately hypercholesterolemic patients at baseline and after treatment with statins for 2 – 3 months. Cholesterol and triglyceride levels were reduced in all apo B-containing lipoproteins, including all LDL subfractions, while the sialic acid ratio was increased in total LDL and in all its subfractions. Cholesterol concentrations and sialic acid ratios were inversely correlated in light and dense LDL subfractions both before and during statin treatment, and the greater the decrease in cholesterol and apo B contents of dense LDL, the higher was the increase in its sialic acid ratio. Furthermore, the lower the baseline sialic acid ratio of dense LDL, the greater was the reduction in its lipid and apo B concentrations. In conclusion, inhibition of cholesterol synthesis by statin treatment increased sialic acid/apo B ratio in LDL proportionately to the decrease of LDL apo B and cholesterol. © 2000 Elsevier Science Ireland Ltd. All rights reserved.
Keywords:Sialic acid; Hypercholesterolemia; Apolipoprotein B; LDL kinetics; Statin
www.elsevier.com/locate/atherosclerosis
1. Introduction
Low density lipoprotein (LDL) contains sialic acid residues on the carbohydrate chains of either apolipo-protein (apo) B or glycolipids [1]. In cell culture studies [2 – 8], LDL with low sialic acid content caused intracel-lular lipid accumulation while LDL with higher sialic acid content did not, and there was a strong negative correlation between LDL sialic acid content and the degree of cholesterol accumulation. LDL of patients with coronary artery disease (CAD) has been found to have a low content of sialic acid as compared with healthy controls [3,5 – 7,9]. Based on these findings, desialylation of LDL has been proposed to be one of the atherogenic modifications of LDL [3 – 8]. In our previous study [10], in type 2 diabetic patients the fractional catabolic rate of dense LDL was correlated with its sialic acid content. Low sialic acid content was also associated with high lipid concentrations in LDL [11].
Statins (e.g. simvastatin and pravastatin), specific inhibitors of 3-hydroxy-3-methylglutaryl coenzyme A (HMG-CoA) reductase, effectively decrease cholesterol synthesis, lower LDL cholesterol and apo B concentra-tions in plasma, and retard progression of atherosclero-sis [12 – 16]. The effect of statin treatment on LDL sialic acid content is not known, even though the negative association between lipid and sialic acid contents in LDL [11] suggests that the sialic acid content might increase with lipid lowering. To this end, the aim of this study was to examine the sialic acid content and metabolism of LDL at baseline and during statin-in-duced inhibition of cholesterol synthesis in patients with primary moderate hypercholesterolemia.
2. Patients and methods
2.1. Patients
Twenty-six patients, 21 males and five females, were recruited from the outpatient lipid clinic of our hospi-* Corresponding author. Tel.: +358-9-4711; fax: +
358-9-47174013.
tal. Their mean age was 56 years (36 – 75 years, SD 8 years) and the mean body mass index (BMI) was 28.8 kg/m2, SD 5 kg
/m2. They all had hyperlipidemia (LDL cholesterol \3.3 mmol/l), and all except four patients had CAD verified either angiographically (n=5), by a history of acute myocardial infarction at least six months before the study (n=5), or both (n=10), or by exercise bicycle test (n=2). Five patients had type 2 diabetes mellitus (DM) treated with diet only. Sixteen patients were on beta-blocker treatment at the time of the study, and two used thiazide diuretics for hypertension. The medications were unchanged during the study. None of the women used hormone replacement therapy. Four patients were current smokers, 13 were past smokers having stopped smoking at least 2 years before the study, and nine had never smoked. None of the patients had gastrointestinal, liver, renal or thyroid disease. The Ethics Committee of our Department had accepted the study protocol. All patients gave informed consent.
2.2. Study design
After being recruited to the study, the patients started a low-fat, low-cholesterol diet according to the instruc-tions of our dietitian. After 6 weeks on the diet, the baseline metabolic studies were performed. When the studies were finished, the patients continued the diet and started the statin treatment. Nine patients received on average 30 mg/day (20 – 40 mg) of fluvastatin, seven patients 20 mg/day of simvastatin, and ten patients on average 0.2 mg/day (0.1 – 0.3 mg) of cerivastatin. When the patients had been on statins for 2 – 3 months, the metabolic studies were repeated. Thirteen subjects volun-teered to participate in both kinetic studies. Their lipid, lipoprotein or sialic acid values did not differ from those of the 13 non-participants. Throughout the study all patients continued a low-cholesterol, low-fat diet, which contained a scheduled amount of 30 energy % of fat and B300 mg/day of cholesterol.
2.3. Methods
Blood samples were drawn after a 12-h fast during both metabolic studies. Total and free cholesterol, triglycerides, phospholipids and apo B were analysed with commercial kits (Boehringer Diagnostica, Ger-many; Wako Pharmaceuticals, GerGer-many; and Orion Diagnostica, Finland). Sialic acids were analysed by modified resorcinol method [17,18] using N -acetylneu-raminic acid (Sigma Chemical) as the standard. Sialic acid content is expressed in the following as ratio to apo B and referred to as the sialic acid ratio.
Serum lipoproteins were separated with ultracentrifu-gation [19]. After separation of total LDL, it was fractionated into three subfractions: light (d 1.019 – 1.036 g/ml), dense (d 1.037 – 1.055 g/ml) and very dense (d
1.056 – 1.063 g/ml) in a Ti 60 fixed-angle rotor (Beckman Instruments®) for 44 h at 58 000 rpm in +4°C, as described in detail earlier [20].
Dietary intake of fatty acids and cholesterol were determined from 7-day food diaries by a computer method applied to the country’s dietary ingredients [21]. For the kinetic studies, 50 ml of fasted EDTA plasma was drawn, and total (d 1.019 – 1.063 g/ml) and dense LDL (d 1.037 – 1.055 g/ml) were separated by serial density ultra-centrifugations. Dense LDL apo B was iodinated with 125I and total LDL apo B with131I by a modification of
the iodine-monochloride method [22,23]. Approximately 1 mg of a mixture of the autologous labelled total and dense LDL apo B was mixed with 5% human serum albumin, filtered, and injected into the patient. Three days before injection the subjects started to take peroral potassium iodide. The total amount of radioactivity did not exceed 60mCi.
After the injection, blood samples were collected and counted for 14 days. The die-away curves were con-structed from plasma for131I-LDL and125I-dense LDL. Fractional catabolic rate (FCR) for total and dense LDL apo B were determined using a two-pool model [24]. Transport rate (TR) was calculated by multiplying the FCR by the pool size. Pool size was the apoprotein plasma concentration multiplied by plasma volume, which was calculated to be 4.5% of body weight.
Serum non-cholesterol sterols, including the choles-terol precursor scholes-terols
8
-lathosterol, desmosterol and lathosterol, the plant sterols campesterol and sitosterol, and cholestanol, were determined from nonsaponifiable serum extract by gas – liquid chromatography on a 50-m long SE-30 capillary column [25]. The non-cholesterol sterols are transported in serum by lipoproteins similarly to cholesterol, and in order to eliminate the effect of varying cholesterol levels, the values are expressed as mmol/mol of serum cholesterol, i.e. as ratios to cholesterol.
2.4. Calculations
Statistical significances were tested with analysis of variance and pairedt-test. Correlations were analysed by calculating Pearson’s product-moment coefficient. AP -value of B0.05 was considered statistically significant.
3. Results
phospholipids was unchanged. In HDL the changes were opposite for cholesterol and triglycerides so that the proportion of cholesterol was increased and that of triglycerides was decreased (data not shown).
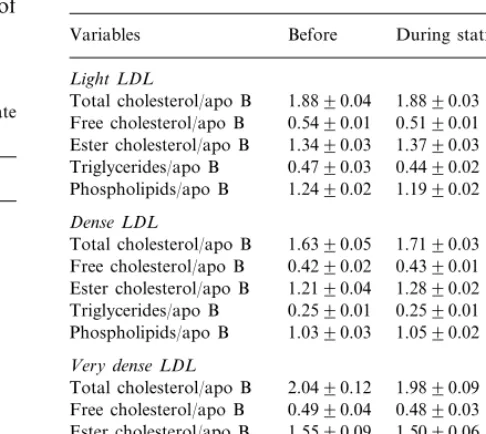
Table 3
Lipid composition per apo B of light, dense and very dense LDL subfractions (n=26, mean9SE)
Before During statin treatment Variables
Light LDL
Total cholesterol/apo B 1.8890.04 1.8890.03 Free cholesterol/apo B 0.5490.01 0.5190.01
1.3490.03
Ester cholesterol/apo B 1.3790.03 0.4790.03
Triglycerides/apo B 0.4490.02 Phospholipids/apo B 1.2490.02 1.1990.02
Dense LDL
1.6390.05
Total cholesterol/apo B 1.7190.03 Free cholesterol/apo B 0.4290.02 0.4390.01 Ester cholesterol/apo B 1.2190.04 1.2890.02 0.2590.01 0.2590.01
Triglycerides/apo B
1.0590.02 Phospholipids/apo B 1.0390.03
Very dense LDL
2.0490.12 1.9890.09 Total cholesterol/apo B
0.4990.04 0.4890.03 Free cholesterol/apo B
1.5090.06 Ester cholesterol/apo B 1.5590.09
0.5190.02 0.5690.04
Triglycerides/apo B
1.6590.15 1.6690.14 Phospholipids/apo B
Table 1
Serum and lipoprotein lipids in subjects with primary moderate hypercholesterolemia (n=26, mean9SE)
Variables in (mmol/l) Before During statin treatment
Serum cholesterol 7.0690.16 5.5090.18** 0.9090.11
VLDL cholesterol 0.6390.07** IDL cholesterol 0.3790.03 0.2490.03** LDL cholesterol 4.3390.09 2.9790.11**
1.1290.04
HDL cholesterol 1.1290.05 Serum triglycerides 2.5090.22 2.0390.16**
1.7590.20
VLDL triglycerides 1.3890.14** 0.1490.01
IDL triglycerides 0.1290.01** LDL triglycerides 0.3590.02 0.2790.01** 0.1690.01*
HDL phospholipids 1.1690.05
*PB0.05. **PB0.001.
Table 4
Sialic acid content of total and LDL subfractions (n=26, mean9
SE)
Variables Before During statin treatment (mg/mg apo B) Very dense LDL 114.097.1 153.2912.5**
*PB0.01. **PB0.001. Table 2
Lipid and apo B concentrations in total LDL and light, dense and very dense LDL subfractions (n=26, mean9SE)
Before During statin treatment Variables
Total LDL
167.693.4
Cholesterol (mg/dl) 114.994.5*** Esterified cholesterol (%) 74.190.3 74.690.3
31.191.4
Triglycerides (mg/dl) 23.591.1*** Phospholipids (mg/dl) 107.892.3 74.892.9***
100.992.3
apo B (mg/dl) 68.392.7***
Light LDL
48.892.7*** 67.394.6
Cholesterol (mg/dl)
71.190.7 72.890.4* Esterified cholesterol (%)
15.090.6
Triglycerides (mg/dl) 12.190.6*** 31.691.7*** 44.192.9
Phospholipids (mg/dl)
37.792.7
apo B (mg/dl) 27.691.5**
Dense LDL
88.694.6
Cholesterol (mg/dl) 58.493.3*** 74.590.5
Esterified cholesterol (%) 74.990.3 Triglycerides (mg/dl) 13.290.9 9.290.6***
55.192.9
Phospholipids (mg/dl) 36.892.1*** apo B (mg/dl) 57.492.7 36.592.2***
Very dense LDL
12.091.9
Cholesterol (mg/dl) 7.790.5* Esterified cholesterol (%) 76.390.7 76.290.5 Triglycerides (mg/dl) 2.890.3 2.290.2*
8.791.1 6.490.5* Phospholipids (mg/dl)
5.890.4
apo B (mg/dl) 4.290.3***
*PB0.05. **PB0.01. ***PB0.001.
Cholesterol, triglyceride, phospholipid and apo B concentrations decreased remarkably in all the LDL subfractions during statin treatment (Table 2), and the higher the baseline lipid levels, the greater were their reductions. The lipid/apo B ratios did not change (Table 3), indicating that statins decreased only the number of serum LDL particles.
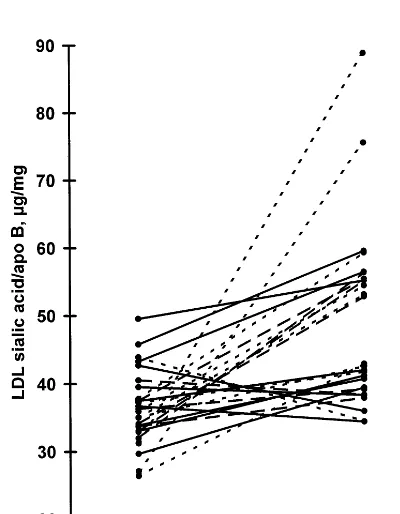
The sialic acid ratio was significantly increased in total LDL and all its subfractions during statin treat-ment (Table 4). The ratios did not differ significantly between the groups treated with different statins before or during the statin treatment, and the change was significant in total LDL for all the different statin groups separately (in the cerivastatin group, from 39.292.0 (mean9SE) to 44.492.9 mg/mg apo B; in
the fluvastatin group, from 34.491.8 to 54.895.9
mg/mg apo B; and in the simvastatin group, from
35.391.1 to 47.993.4mg/mg apo B,PB0.05 for all).
ratio was increased in 21 subjects and decreased in five subjects. The sialic acid ratio was negatively correlated with cholesterol, phospholipid and apo B concentra-tions in light and dense LDL subfracconcentra-tions, both before and during statin treatment, and with triglyceride con-centration only during statin treatment in all the sub-fractions. The changes in cholesterol, phospholipid and apo B concentrations were negatively correlated with the change in sialic acid ratio in dense LDL (r= − 0.501 for cholesterol, r= −0.464 for phospholipids, and r= −0.667 for apo B, Fig. 2). In light and dense
Fig. 3. Correlation between the baseline dense LDL sialic acid/apo B ratio and the change in dense LDL apo B concentration, r=0.614,
PB0.001,y=1.13x−54.8.n=26.
Fig. 1. Individual changes in LDL sialic acid/apo B ratio during statin treatment. Solid line ( — ), cerivastatin group, n=10; dotted line (· · ·), fluvastatin group, n=9; dashed line (- - -), simvastatin group,n=7.
LDL, baseline sialic acid ratio was also correlated with the changes in cholesterol, phospholipid and apo B concentrations, and in dense LDL also with the change in triglyceride concentration, so that the lower the baseline sialic acid ratio, the greater was the reduction in the lipid and apo B concentrations (Fig. 3). The changes in sialic acid ratios were not associated with basal lipid and apo B concentrations.
FCR for both total and dense LDL apo B was increased (from 0.27790.011 and 0.26990.030 to 0.38090.010 and 0.32590.016 pools/day, respectively,
PB0.01 for both), and TR for dense LDL apo B was decreased (from 5.2990.45 to 3.7090.30 mg/kg per day, P=0.001). None of these variables were signifi-cantly related to the sialic acid ratios or their changes.
The ratios of
8-lathosterol, desmosterol and
lathos-terol to choleslathos-terol were lowered remarkably during the statin treatment, while those of the plant sterols campesterol and sitosterol, and that of cholestanol were increased (data not shown). The baseline ratios of the non-cholesterol sterols or the changes in them were not associated with baseline sialic acid ratios nor with the changes in sialic acid ratios during statin treatment.
4. Discussion
The change in the sialic acid ratios of total LDL and all its subfractions was roughly similar in the groups treated with different statins, i.e. cerivastatin (n=10), fluvastatin (n=9) and simvastatin (n=7). The choles-terol concentrations of light and dense LDL subfrac-tions at baseline were negatively correlated with the respective baseline sialic acid ratios so that when the cholesterol contents were decreased by statins, the sialic acid ratios increased. Moreover, the higher the decrease in cholesterol or apo B concentration of dense LDL, Fig. 2. Correlation of the change in dense LDL sialic acid/apo B ratio
with the change in dense LDL apo B concentration, r= −0.667,
the higher was the increase in its sialic acid ratio. Thus, since the highest lipid lowering of LDL subfractions was found in the most hypercholesterolemic subjects, it could be assumed that these patients also had the greatest increase in sialic acid ratios. However, basal lipid levels were not correlated with the change observed in the sialic acid ratios.
The sialic acid content of LDL has been shown to affect its ability to cause intracellular lipid accumulation in cell culture, so that the lower the sialic acid content in LDL the higher was the amount of cholesterol accumulated into cells [2 – 8]. Considering this, the new finding that LDL sialic acid ratio is increased during statin treatment could contribute to the well-known observation that statin treatment is associated with a decrease in the development of atherosclerosis. The decrease in the dense LDL lipid and apo B concentrations was related to the basal sialic acid ratio of dense LDL so that a low sialic acid ratio predicted effective lowering of lipid and apo B concentrations. This suggests that baseline sialic acid ratio of dense LDL is associated with the degree of decrease in dense LDL cholesterol caused by statins.
In a recent study by Orekhov et al. [26], the sialic acid content of LDL was increased in patients treated with amlodipine alone or with the combination of amlodipine and lovastatin. The increase was seen more rapidly with the combination treatment than with amlodipine alone, but after a treatment of 4 weeks, the final level of sialic acid was the same whether or not lovastatin was used. In contrast to their findings, our results suggest that statin treatment alone causes an increase in LDL sialic acid ratio.
LDL sialic acid ratio was increased in most but not all subjects during the statin treatment. The five subjects with a decreased sialic acid ratio had a higher LDL sialic acid ratio at baseline than the rest, but otherwise they did not differ from the others in clinical characteristics, baseline lipid or apo B concentrations or LDL kinetic parameters, and the changes in these parameters during statin treatment were not different from subjects with increasing LDL sialic acid content. Thus it is difficult to speculate why their LDL sialic acid content responded differently.
In our previous study, the sialic acid ratio of LDL was markedly higher in diabetic patients compared with non-diabetics [10]. In the present study the five patients with diabetes had non-significantly higher baseline sialic acid ratios than non-diabetics, and the sialic acid increment during the statin treatment was similar to the rest of the group. The small number of non-CAD-subjects (n=4) does not allow us to draw conclusions about the lack of differences in sialic acid ratio between CAD- and non-CAD-subjects from this study. The same is true for the differences between males and females and between smokers and non-smokers.
The sialic acid to apo B ratio of LDL is of an overall higher level in our study than in many others [3,5,9]. However, our results with the resorcinol method are constant in repeated analyses, and highly similar to those we have obtained with the thiobarbituric acid assay [27], which has been used by most other groups.
The sialic acid ratio was clearly higher in the very dense LDL subfraction compared with light and dense subfractions in all the subjects. This is presumably due to this subfraction having a higher concentration of Lp(a), which is known to be highly sialylated [28]. In contrast, the dense LDL subfraction having a remarkably lower sialic acid ratio probably does not contain significant amounts of Lp(a), and our measurements show that less than 30% of subjects had detectable amounts of Lp(a) in dense LDL, and in these subjects its mean concentration was 11.692.0 mg/l or 4.7% of serum total Lp(a). Similarly, very dense LDL contained 8.3% of serum Lp(a). Statin treatment generally does not affect Lp(a) levels [29], and we assume that Lp(a) did not affect the change in LDL sialic acid ratios during statin therapy.
As the lipid contents of lipoproteins decreased during the statin treatment, their metabolism was also affected. The fractional catabolic rates of total and dense LDL apo B were increased, implying an accelerated catabolism. Furthermore, there was a decrease in the TR for dense LDL, reflecting a diminished production of this subfraction, while the TR for total LDL was not affected. This suggests that statin treatment decreased the conversion of light LDL to the more atherogenic dense subfraction, which has also been associated with a lower sialic acid content [30]. However, we found no association between baseline sialic acid ratios and LDL metabolic parameters, nor between the changes in them during statin treatment, but a possible connection cannot be ruled out because of a small number of subjects (n=13) in the kinetic studies.
The observed increases in LDL sialic acid ratio and LDL catabolic rate can be due to more sialic acid-rich LDL being produced and/or to sialic acid-poor LDL being removed by receptors more avidly than LDL with high sialic acid ratio. Both the hepatic asialoglycoprotein receptor [31] and the lectin receptor in macrophages [32,33] have been shown to remove desialylated LDL remarkably faster than sialic acid-rich LDL. The same could be true for IDL, so that sialic acid-poor IDL could be removed more effectively by apo E or B receptors, leaving less IDL with low sialic acid ratio to be converted to light and dense LDL. Both of these pathways would lead to a higher sialic acid ratio in LDL.
Acknowledgements
The study was supported with grants from the Uni-versity Central Hospital of Helsinki and the Medical Council of Finnish Academy. The authors wish to thank Leena Kaipiainen, Pia Hoffstro¨m, Orvokki Ahlroos, Ritva Nissila¨ and Leena Saikko for expert technical assistance.
References
[1] Swaminathan N, Aladjem F. The monosaccharide composition and sequence of the carbohydrate moiety of human serum low density lipoproteins. Biochemistry 1976;15:1516 – 22.
[2] Filipovic I, Schwarzmann G, Mraz W, Wiegandt H, Buddecke E. Sialic-acid content of low-density lipoproteins controls their binding and uptake by cultured cells. Eur J Biochem 1979;93:51 – 5.
[3] Orekhov AN, Tertov VV, Mukhin DN, Mikhailenko IA. Mod-ification of low density lipoprotein by desialylation causes lipid accumulation in cultured cells: discovery of desialylated lipo-protein with altered cellular metabolism in the blood of atherosclerotic patients. Biochem Biophys Res Commun 1989;162:206 – 11.
[4] Sobenin IA, Tertov VV, Orekhov AN, Smirnov VN. Synergetic effect of desialylated and glycated low density lipoproteins on cholesterol accumulation in cultured smooth muscle intimal cells. Atherosclerosis 1991;89:151 – 4.
[5] Orekhov AN, Tertov VV, Mukhin DN. Desialylated low density lipoprotein — naturally occurring modified lipoprotein with atherogenic potency. Atherosclerosis 1991;86:153 – 61.
[6] Tertov VV, Sobenin IA, Gabbasov ZA, Popov EG, Jaakkola O, Solakivi R, Nikkari T, Smirnov VN, Orekhov AN. Multiple-modified desialylated low density lipoproteins that cause intra-cellular lipid accumulation. Isolation, fractionation and characterization. Lab Invest 1992;67:665 – 75.
[7] Tertov VV, Sobenin IA, Orekhov AN. Characterization of desia-lylated low-density lipoproteins which cause intracellular lipid accumulation. Int J Tiss Reac 1992;14:155 – 62.
[8] Orekhov AN, Tertov VV, Sobenin IA, Smirnov VN, Via DP, Guevara J Jr, Gotto AM Jr, Morrisett JD. Sialic acid content of human low density lipoproteins affects their interaction with cell receptors and intracellular lipid accumulation. J Lipid Res 1992;33:805 – 17.
[9] Ruelland A, Gallou G, Legras B, Paillard F, Cloarec L. LDL sialic acid content in patients with coronary artery disease. Clin Chim Acta 1993;221:127 – 33.
[10] Melaja¨rvi N, Gylling H, Miettinen TA. Sialic acids and the metabolism of low density lipoprotein. J Lipid Res 1996;37:1625 – 31.
[11] Lindbohm N, Gylling H, Miettinen TE, Miettinen TA. Sialic acid content of LDL and lipoprotein metabolism in combined hyperlipidemia and primary moderate hypercholesterolemia. Clin Chim Acta 1999;285:69 – 84.
[12] Scandinavian Simvastatin Survival Study Group. Randomised trial of cholesterol lowering in 4444 patients with coronary heart disease: the Scandinavian Simvastatin Survival Study (4S). Lancet 1994;344:1383 – 9.
[13] West of Scotland Coronary Prevention Study Group, Shepherd J, Cobbe SM, Ford I, Isles CG, Lorimer AR, Macfarlane PW, McKillop JH, Packard CJ. Prevention of coronary heart disease with pravastatin in men with hypercholesterolemia. N Engl J Med 1995;333:1301 – 7.
[14] Cholesterol and Recurrent Events Trial Investigators, Sacks FM, Pfeffer MA, Moyne LA, Rouleau JL, Rutherford JD, Cole TG, Brown L, Warnica JW, Arnold JMO, Nash DT, Wun C-C, Davis BR, Braunwald E. The effect of pravastatin on coronary events after myocardial infarction in patients with average cholesterol levels. N Engl J Med 1996;335:1001 – 9.
[15] AFCAPS/TexCAPS Research Group, Downs JR, Clearfield M, Weis S, Whitney E, Shapiro DR, Beere PA, Langendorfer A, Stein EA, Kruyer W, Gotto Jr AM. Primary prevention of acute coronary events with lovastatin in men and women with average cholesterol levels. Results of AFCAPS/TexCAPS. J Am Med Assoc 1998;279:1615 – 22.
[16] The Long-Term Intervention with Pravastatin in Ischaemic Dis-ease (LIPID) Study Group. Prevention of cardiovascular events and death with pravastatin in patients with coronary heart disease and a broad range of initial cholesterol levels. N Engl J Med 1998;339:1349 – 57.
[17] Svennerholm L. Quantitative estimation of sialic acids. II. A colorimetric resorcinol-hydrochloric acid method. Biochim Bio-phys Acta 1957;24:604 – 11.
[18] Miettinen T, Takki-Luukkainen I-T. Use of butyl acetate in determination of sialic acid. Acta Chem Scand 1959;13:856 – 8. [19] Lipid Research Clinics Program. Manual of Laboratory
Opera-tions. Lipids and Lipoprotein Analysis. National Institutes of Health. DHEW Publication No. (NIH) 75-628. Bethesda, MD 1974;1:51 – 59.
[20] Gylling H, Vanhanen H, Miettinen TA. Effects of ketoconazole on cholesterol precursors and low density lipoprotein kinetics in hypercholesterolemia. J Lipid Res 1993;34:59 – 67.
[21] Knuts L-R, Rastas M, Haapala P. MicroNutrica, Version 1.0. Helsinki: Kansanela¨kelaitos (National Pensions Institute), 1991. [22] McFarlane AS. Efficient trace-labelling of proteins with iodine.
Nature 1958;182:53.
[23] Bilheimer DW, Eisenberg S, Levy RI. The metabolism of very low density lipoprotein proteins. I. Preliminary in vitro and in vivo observations. Biochim Biophys Acta 1972;260:212 – 21. [24] Matthews CME. The theory of tracer experiments with 131
I-la-belled plasma proteins. Phys Med Biol 1957;2:36 – 53.
[25] Miettinen TA. Cholesterol metabolism during ketokonazole treatment in man. J Lipid Res 1988;29:43 – 51.
[26] Orekhov AN, Tertov VV, Sobenin IA, Akhmedzhanov NM, Pivovarova EM. Antiatherosclerotic and antiatherogenic effects of a calcium antagonist plus statin combination: amlodipine and lovastatin. Int J Cardiol 1997;62:S67 – 77.
[27] Warren L. The thiobarbituric acid assay of sialic acids. J Biol Chem 1959;234:1971 – 5.
[28] Ehnholm C, Garoff H, Renkonen O, Simons K. Protein and carbohydrate composition of Lp(a) lipoprotein from human plasma. Biochemistry 1972;11:3229 – 32.
[29] Berglund L. Diet and drug therapy for lipoprotein (a). Curr Opin Lipidol 1995;6:48 – 56.
[30] La Belle M, Krauss RM. Differences in carbohydrate content of low density lipoproteins associated with low density subclass patterns. J Lipid Res 1990;31:1577 – 88.
[31] Lee YC, Townsend RR, Hardy MR, Lo¨nngren J, Arnarp J, Haraldsson M, Lo¨nn H. Binding of synthetic oligosaccharides to hepatic Gal/GalNac lectin. Dependence on fine structural fea-tures. J Biol Chem 1983;258:199 – 202.
[32] Grewal T, Bartlett A, Burgess JW, Packer NH, Stanley KK. Desialylated LDL uptake in human and mouse macrophages can be mediated by a lectin receptor. Atherosclerosis 1996;121:151 – 63.