ANALYSIS
Intra-generational equity and sustainable welfare: a time
series analysis for the UK and Sweden
Susanna Stymne, Tim Jackson *
Centre for En6ironmental Strategy,Uni6ersity of Surrey,Guildford,Surrey,GU2 5XH UK Received 4 May 1999; received in revised form 14 October 1999; accepted 18 October 1999
Abstract
This paper discusses the importance of intra-generational equity to sustainable development. It outlines a number of methodologies for measuring income inequality in the economy, and presents several possible ways of incorporat-ing the impact of distributional effects into measures of welfare in the economy. The authors highlight in particular an index developed by Atkinson (Atkinson, A.B., 1970. Distributive politics and economic growth. Q. J. Econ., May, 465 – 490.) based on the social welfare model. This method possesses two main advantages over other methods. Firstly, it is expressed directly in terms of social well-being. Secondly, value judgements incorporated into the measure are made explicit through the parametero which expresses society’s degree of aversion to income inequality. The
paper calculates the value of the Atkinson index for two case study countries (Sweden and the UK) between 1950 and 1996 for a central estimate ofo=0.8. The results show that the welfare loss due to inequalities in the distribution of income varied between 5 and 10% for Sweden, and between 6 and 14% for the UK, with the higher values coming towards the end of the period. The paper explores the sensitivity of these results to changes in the value ofofor the
case of the UK, and discusses the relevance of the work to the measurement of sustainable welfare. © 2000 Elsevier Science B.V. All rights reserved.
Keywords:Equity; Sustainability; Income distribution; Income inequality; Gini coefficient; Atkinson index
www.elsevier.com/locate/ecolecon
1. Introduction
Equity is a key concept in sustainable develop-ment. The literature on sustainable development
and on ecological economics has devoted most attention to the concept of inter-generational eq-uity. Although well recognised in economic the-ory, the concept of intra-generational equity has received less attention in the ecological economics literature. Nevertheless, it is clearly important to sustainable development because there are recog-nised links between income inequality, economic
* Corresponding author.
E-mail addresses: [email protected] (S. Stymne), [email protected] (T. Jackson)
growth, human capital and the environment. Thus, levels of inequality in the economy may have considerable impact not only on present levels of well-being, but also on the well-being of future generations.
This paper discusses those links in conceptual terms (Section 2). It then outlines a number of methods for measuring income inequalities (Sec-tion 3) and discusses the ques(Sec-tion of integrating those measures into measures of national welfare (Section 4). Using two of these measures, it then presents a time series analysis on trends in the distribution of incomes in two case study coun-tries (the UK and Sweden) and carries out a sensitivity analysis (for the UK) on one key parameter — the value of o in the Atkinson inequality index (Section 5).
The differences between equity, equality, fair-ness and justice have been extensively discussed in the literature (e.g. Le Grand et al., 1976; Daly 1992; Dasgupta, 1995; Sen 1997). Quite clearly the concept of intratemporal equity is broader than the concept of intratemporal income equality. A thorough analysis of the former issue must pay attention to the intratemporal distribution of a wide variety of resources, including natural, envi-ronmental, cultural, human and social resources as well as purely financial ones. Acknowledging these limitations, it is nonetheless our contention that the distribution of incomes in the economy represents a reasonable proxy with which to illus-trate the welfare impacts of inillus-tratemporal equity, and this paper proceeds on that basis.
2. Well-being and income inequality
Traditional measures of economic growth, such as the gross domestic product (GDP), reflect changes in the absolute level of activity but tend to ignore relative and positional changes. A dollar income rise to a poor person is assumed to have the same welfare effect as a dollar increase to a rich person, and aggregate increases in income are assumed to yield equivalent increases in well-be-ing no matter how they are distributed. In reality, however, we would expect the distribution of incomes to have differential effects on well-being for a number of reasons.
In the first place, most societies express some kind of social preference for equality over in-equality; i.e. a society with less inequality in the distribution of resources is preferred to one with more inequality. As a rule, therefore, societies tend to strive for a more equal distribution of resources, although there are different views on what the right le6el of equality for a society is.
Some countries might emphasise the poorest peo-ple in society, while others strive for total equal-ity. Daly (1992) argues that a ‘good distribution is one that is just or fair, or at least one in which the degree of inequality is limited within some accept-able range.’ Le Grand et al. (1976) identify several approaches to the question of a fair distribution:
the minimum standard approach — which is
concerned only with the poor in the society and argues that nobody’s income should fall below a certain minimum level;
the total equality approach — which argues
that everyone should have the same income, i.e. the bottom 10% of the population should receive 10% of the income;
the need or desert approach — which accepts
inequalities either on the grounds that some people need more income or because people deserve more due to own effort, sacrifice, intel-ligence, etc;
equality of opportunity or procedural
ap-proach — inequality accepted if everyone has had the same opportunity, or if the distribution is a result of a fair process.
The social justice approach introduced by Rawls (1971) is what Le Grand et al. (1976) refers to as a ‘combined approach’ in which inequalities are only justified to the extent that they benefit the least advantaged.
A third issue linking inequality and well-being is the relationship between economic growth and equality. The question here is whether there is a trade-off between economic efficiency (higher na-tional income) and equity (a more equally dis-tributed income). The conventional view has been that striving for income equality slows down eco-nomic growth for several reasons. Firstly, it is argued that higher equality will lead to less incen-tive to work and less incenincen-tive to be producincen-tive. (This is related to the impact of tax rates, and is only one of many incentive effects.) It has also been argued that higher equality can lead to a reduction in domestic savings and thereby a re-duction in growth. This argument is based on the assumption that rich people have a higher mar-ginal propensity to save (Klasen, 1994). In recent years, however, the issue of the relationship be-tween growth and income inequality has been turned on its head. Income equality is now being advanced by some as a promoter of growth (Per-otti, 1993; Alesina and Rodrick, 1994; Persson and Tabellini, 1994; Be´nabou, 1996). In these studies, it has been argued that pre-tax income equality could dampen the demands for redistri-bution policy (financed by taxes) and hence en-hance investment, education and R and D.
A further reason for incorporating consider-ations of intra-generational equity into assess-ments of sustainable welfare is the relationship between investment and income inequality. The potential conflict between investment in savings (for future welfare) and investment in improve-ments in intra-generational equity has already been remarked upon. The level of direct and indirect investment in human capital is also of importance for the sustainability of an economy. A healthy and well-educated work force will help to ensure future generations’ consumption possi-bilities. Research has shown the equalising income differentials might have greater effect on the status of health and mortality than increasing income (Fritzell and Lundberg, 1995; Wilkinson, 1996). This is of particular importance in devel-oped countries where the relative dimension, i.e.
how a person’s economic situation compares to others can trigger ‘psychological mechanisms’ that can affect the status of health.
From the point of view of sustainable develop-ment, it is clearly important to question whether or not there is a relationship between intra-gener-ational equity and environmental quality. A now well-known hypothesis put forward by Kuznets (1967) supposes that as income levels increase (through economic growth), income inequality passes through an inverted U-shaped curve, with increasing levels of inequality in the early years of development giving way to diminishing inequities as development advances. A similar curve (termed the Environmental Kuznets Curve) has been pro-posed for the relationship between environmental degradation and levels of income. It should be noted that both these hypotheses are contentious;2
and any conclusions that could be drawn from these parallel relationships are beyond the scope of this paper. However, recent investigations do indicate that there are important relationships between equity and environmental quality.
Boyce (1994) has argued that a more equitable distribution of power contributes to improve-ments in environmental quality. His definition of a power function is based on a combination of an income inequality index (Gini), a literacy variable, political rights and civil liberties, and certain other factors (mainly geographical). The overall conclusion from a study of seven different envi-ronmental factors for a cross-section of high and low income countries is that the ‘results provide fairly robust support for the hypothesis that greater inequality in the distribution of power leads to more pollution’ (Torras and Boyce, 1998). This hypothesis also appears to be sup-ported by empirical work in relation to the distri-bution of power within a country (Boyce et al., 1999).
The basis for the correlation between greater inequalities and increased environmental
degrada-2On the environmental Kuznets curve, see the special issue
of Ecological Economics, 25 (2), 1998, in relation to income inequality; it should be noted that the results reported in this paper provide no obvious support for the Kuznets curve hypothesis.
1This has become known as the Pigou – Dalton criterion
tion can be summarised in three points (Boyce, 1994).
1. In a situation where there are benefits as well as costs of environmental degradation, the ex-tent of the degradation will depend on who is most powerful (the winner or the loser). As power and wealth are often correlated, it is likely that the rich will be the ones with power. If these are the ones who benefit from the degradation, there will be greater environmen-tal degradation since the difference in distribu-tion leads to some groups in society not having the power to counteract the costs. This is the main argument in Torras and Boyce (1998).
2. Greater inequality leads to less concern for the future, i.e. a higher rate of environmental time preference. The poor have a high environmen-tal time preference as they are concerned with day-to-day survival rather than future environ-mental degradation. The rich, Boyce argues, also experience high rates of environmental time preference because political and economic inequality pose threats to the legitimacy of the powerful (for instance, through social unrest). This prompts those in power to pursue the extraction of short-term profits even if this is at the expense of future environmental degradation.
3. Environmental degradation is often valued in willingness to pay, which is related to the ability to pay — income will affect the valua-tion of the costs and benefits. Greater inequal-ity raises the benefits to the rich, relative to the costs of the poor.
There are clearly a number of other complex relationships between income distribution and the environment, exemplified, for example, by the ex-tent to which security in low income families in developing countries is often gained through larger families, which in turn leads to higher environmental impacts (Markandya, 1998), or by the extent to which identity in developed economies is developed through materially inten-sive consumption patterns (Jackson and Marks, 1999). The underlying issue in all of these rela-tionships is the question of the distribution of benefits versus the distribution of costs. Higher
consumption patterns benefit richer communities, but the cost of these consumption patterns often impact most on poorer communities.
It is clear from these considerations that the relationships between intra-generational equity and sustainable welfare are complex, but of con-siderable importance. As the UNDP (1996) has pointed out: ‘average material welfare can be defined by the per capita GDP. However, statisti-cal averages can mask the diversity that exists within any country. Therefore, from a sustainable development perspective, it is informative to ex-amine income and wealth distribution throughout a population.’ This brings us to the issue of how to measure inequalities and how to include con-sideration of these inequalities into measures of national well-being. This is the subject matter of the following two sections.
3. Measuring income inequalities
There are several different types of inequality measures. Coulter (1989) divides inequality mea-sures into four distinct types, according to the mathematical model on which they are based. These are:
measures based on the combinatorial model; measures based on the entropy model; measures based on deviation models; measures based on the social welfare model.
The first type of measure, based on combinatorial analysis, ‘reflects the probability of randomly se-lecting a pair of identical units (for equality polar-ity) or different units (for inequality polarpolar-ity) from a pool of units divided among two or more components’ (Coulter, 1989). The second type of index, using the entropy model, is ‘generally based on an interpretation involving the number of bits of information that are necessary to identify the location of any unit in its component’ (Coulter, 1989).
of intra-generational and inter-generational eq-uity. The most commonly used deviation index is probably the Gini coefficient.
The final type of measure, based on the social welfare model, attempts to measure the social welfare implications associated with particular levels of inequality. In this context, social welfare is taken to mean the well-being or happiness of a society. However, since it is difficult to actually measure well-being or happiness, the utility from income is often used as a proxy for welfare. For example, Dalton (1920) proposed measuring so-cial welfare W as the aggregate of the utilities
U(yi) associated with each income yi. Thus:
W=%iU(yi) (1)
Dalton is also often referenced as the first to argue that a measure of income inequality could be based on this social welfare model. In practice, of course, what is required to carry out this measurement is a way of relating different in-comes to the utility associated with them.
In this paper, we focus on two specific types of welfare measure, namely, a deviation-type mea-sure based on the Gini coefficient, and a method first proposed by Atkinson (1970) based on the social welfare model. These two measures are examples of what Sen (1997) classifies as objective and normative measures, respectively. Where the Gini coefficient is used only to rank different levels of inequality in an objective fashion, the Atkinson index is normative in the sense that it incorporates specific value perspectives by relating income inequality to social welfare. In the follow-ing subsections, we present time series data on the distribution of incomes in Sweden and the UK for each of these different types of measures.
3.1. Gini coefficient for Sweden and the UK
The Gini coefficient is measured as one-half of the average of the absolute difference between all pairs of relative incomes. The Gini coefficient is often explained graphically as the ratio of the area difference between the curve of actual income distribution and the line of equal distribution. The coefficient takes a value between 0 and 1, where 0
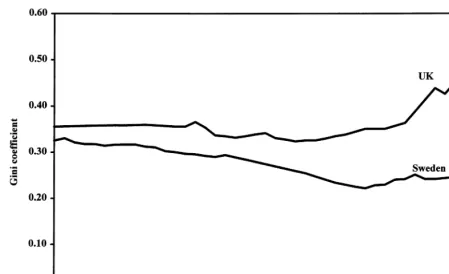
represents total equality. The higher the value of the Gini coefficient, the greater the level of in-equality. Fig. 1 shows the value of the Gini coeffi-cient in the UK and Sweden between 1950 and 1996.
It is clear from the figure that prior to 1980, income inequality declined consistently in Sweden, mainly as a result of a number of specific social welfare policies. In the UK, by contrast, the dis-tribution of income remained more or less con-stant until about the mid-1960s. From then, until the mid-1970s inequality in the UK fell slightly. In both countries, however, income inequality in-creased during the later years of the period, al-though this trend is considerably more noticeable in the UK than it is in Sweden.3
3.2. Atkinson index in Sweden and the UK
The Atkinson index can be interpreted as ‘the proportion of the present total income that would be required to achieve the same level of social welfare as at present if incomes were equally distributed’ (Atkinson, 1983). Atkinson suggested that it is possible to derive the total welfare corresponding to a particular distribution of in-come according to the following formula:
W=Y*
%i(yi/y)(1−o)· pi
n
(1/1−o)
(2)
whereYis the total income;yiis the mean income
of theith group;y is the mean income of the total
income population; pi is the proportion of the
3The Swedish index is based on several different studies, as
Fig. 1. The Gini coefficient in Sweden and the UK, 1950 – 1996.
total income population in theith group; and o is
a factor which represents the weight attached by society to inequality in the distribution of income. The Atkinson index is then defined by:
I=1−W
Y (3)
Since welfare falls as the inequality of income distribution rises, the Atkinson index provides an increasing function of inequality in the economy, defined by the difference (normalised with respect to total income) between the total income and the welfare which it delivers. In a perfectly distributed economy, yi=y for each income group, and so
the welfare level is given by:
W=Y*
%ipin
1 1−o=Y (4)
In this case, the inequality measureIreduces to 0, as would be expected.
The factor o is an important parameter in the
measure. It represents society’s preference for
equality of distribution of incomes. Since it is possible to conceive of societies which have a positive preference for an unequal distribution of income, it is clear that o can take both negative
and positive values. When o =0, society is
indif-ferent to the distribution of income, and welfare again reduces to the total income in the economy:
W=Y*
%iyiy
·pin
=Y (5)and welfare is considered equal to the total in-come.4The parameterotherefore allows explicitly
for the possibility of attributing different welfare levels according to different attitudes towards in-equality in society. A value of 0 would mean that society is indifferent to the distribution of income. As the value of o rises, more weight is placed by society on the lower income groups. When o
reaches , society will accept nothing less
4To see this, note thaty=Y/PwherePis the total income
Fig. 2. The Atkinson index for Sweden and the UK, 1950 – 1996.
than total equality for all sectors of the popula-tion. By contrast, a value below 0 would mean that society is prepared to lose some income in order to achieve greater income inequality.
The value of ocan be determined, in theory, in terms of transfer efficiency. The method is ex-plained by Atkinson (1983) through a ‘thought experiment’ in which he looked at how much a rich person would be prepared to lose in transfer costs (from administration or inefficiency for ex-ample) when distributing income from the rich to the poor. According to Atkinson, a transfer will only take place if the net benefit (including trans-fer losses) is positive. This thought experiment provides a formula for determiningo given by:
1
x=d
o
(6)
wherex is the proportion of income that is to be transferred to the poorer person for the rich per-son to accept the transfer and d is the (propor-tional) distance between the rich and the poor person. As an example, suppose that a richer
person has twice the income of a poorer one (i.e.
d=2) and that s/he is prepared to lose 40 pence in transfer costs (i.e. x=0.4). Then o is given by
1/0.6=2o
(i.e.o=0.74).
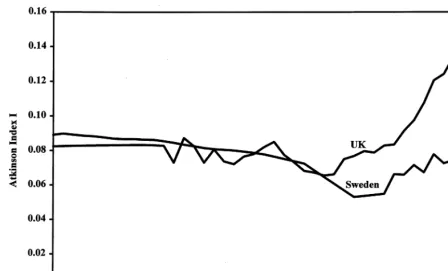
Fig. 2 illustrates the value of the Atkinson index for Sweden and the UK between 1950 and 1996, using an o value of 0.8.5
The basic trends illustrated in Fig. 1 are also apparent in Fig. 2: improvements in income
distri-5The income distribution data for the UK has been taken
bution during earlier years of the period are offset by greater inequality in the later years. Again, the trend towards increased inequality since about 1975 is more marked in the UK. In this case, however, Fig. 2 provides an interpretation of this increase in terms of social welfare. The Atkinson index I can be interpreted as the loss of welfare associated with a given level of inequality in the distribution of incomes. Fig. 2 reveals that in 1978 this loss of welfare for the UK was around 6.5%, a slight improvement over the 9% loss associated with income inequality in 1950. By 1996, on the other hand, the welfare loss had more than dou-bled to over 14%.
4. Incorporating income inequality into a welfare index
It is clear from the discussion above that the Atkinson index has the advantage of offering an immediate interpretation in terms of social wel-fare, and can thus be used to incorporate the effects of income inequality directly into welfare measures. For example, where income is used directly as a proxy for social welfare, we find that Eq. (3) can be recast as:
Yadj=Y*(1−I) (7)
Yadjnow represents the distribution-adjusted wel-fare measure. This method can be generalised in a straightforward fashion to other kinds of welfare measures W through:
Wadj=W *(1−I) (8)
In the following section we present a case study in which the Atkinson index is used to adjust several different kinds of welfare measure in the two case study countries (Sweden and the UK). First, however, it is worth pointing out that a number of other suggestions have been made concerning the incorporation of distributional as-pects into welfare measures. In the literature, dis-tributional adjustments have been made, for example, to the GDP, the World Bank’s human development index (HDI) and Daly and Cobb’s index of sustainable economic welfare (ISEW) (Daly and Cobb, 1989). Each of these indicators
incorporates some kind of income concept as its basis, and it this income variable that is most obviously open to adjustment from a distribu-tional perspective.
Perhaps the most widely used methodology in-corporates the Gini coefficient in some form. A Gini-based welfare indicator was derived, for ex-ample, by Sen (1976, 1997) and has been used in several empirical works, such as by UNDP (1993) (to correct the HDI) and by Klasen (1994) (to adjust income in the USA). A welfare function adjusted using the Gini coefficient could take the following shape (as in the Human Development Index (UNDP, 1993)):Wadj=W *(1−G)whereW
is the welfare index, G is the Gini coefficient and
Wadj is the distribution-adjusted welfare index. Alternatively, the adjustment could be made using a Gini index formulated relative to a particular base year:
Gbase is the Gini coefficient in the base year, and
Gn is the Gini coefficient in the year of interest.
Even though this method is quite widely used there are several problems with it. Firstly, al-though the Gini coefficient satisfies the principle of transfers — i.e. a transfer from a rich person to a poor person always reduces the inequality measure — it does not satisfy the principle of
diminishing transfers — i.e. that the effect of a transfer diminishes as the absolute level of income increases (Schwartz and Winship, 1979). Further, in spite of the classification of the Gini coefficient as an objective measure, it does implicitly include value judgements. For example, distributions to-wards the middle are implicitly preferred in the index. However, these value judgements remain hidden within the index. Perhaps the most in-tractable problem is that there is no direct wel-fare-theoretic interpretation of the Gini index.
since the Atkinson index is formulated from a welfare-theoretic model. In addition, however, there is much greater transparency with regard to value judgements. Given that the conventional summary measures inevitably introduce distribu-tional values, Atkinson (1983) argues that ‘it may be preferable to consider such values explicitly. Only then can it be clear just what distributional objectives are being incorporated as a result of adopting a certain measure.’ The Atkinson index incorporates these value judgements explicitly through the valueoin Eq. (2). This allows the user
of the index to incorporate particular value judge-ments about the importance of distributional ele-ments to welfare.
It should perhaps be mentioned that it would also be possible to construct a distribution-ad-justed welfare model using a relative Atkinson index by a straightforward analogy with the method proposed in Eqs. (10) and (11) for the Gini coefficient. In this case, the distribution-ad-justed measure Wadjwould be given by:
Wadj=
WIbaseis the Gini coefficient in the base year, andIn
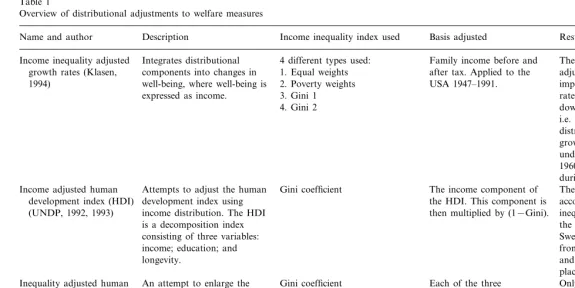
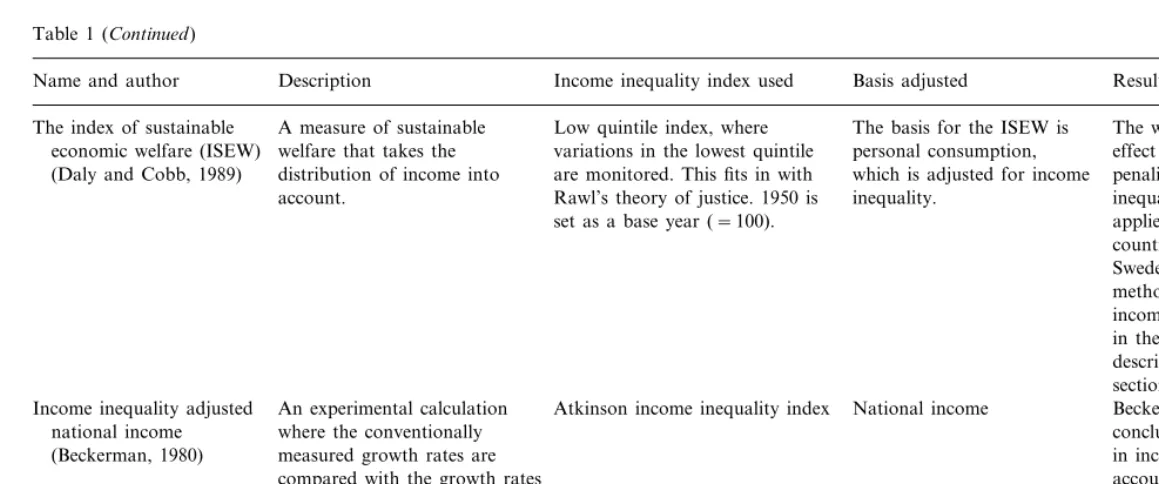
is the Atkinson index in the year of interest. It is not clear however, that this method offers any advantages over a direct welfare-theoretic adjust-ment. Table 1 summarises a variety of attempts to adjust welfare measures for distributional properties.
5. Case study: distribution-adjusted welfare measures for Sweden and the UK
This section reports on a time-series analysis of the impact of adjusting two specific measures for distributional effects using the Atkinson index. Firstly, we apply the Atkinson index to time series data on personal consumer expenditure in Sweden and the UK between 1950 and 1996. Secondly, we apply the index to adjust the index of sustainable
economic welfare in each of these case study countries. As noted in the previous section, all inequality measures include value judgements. In most cases these value judgements remain hidden within the methodological assumptions made. However, in the Atkinson index, some of these values are made explicit through the parameter o.
This parameter is defined as: ‘the weight attached by society to inequality in the distribution’ (Atkinson, 1983).
Although this construction works in theory, placing an appropriate value on o at the national
level is difficult. Empirical studies of the value are scarce. Schwartz and Winship (1979) refer to Stevens (1959), Schwartz (1974) and Winship (1976) who all used ‘attitudinal survey data about the level of well-being associated with different levels of income’. The results indicated that o
should take a value between 0.5 and 0.75. Schwartz and Winship (1979) also refer to Stern (1977) who examined data on individual con-sumer maximising behaviour. His results indicated that oshould range between 0 and 10 with a best
‘guesstimate’ of 2. Schwartz and Winship them-selves argued that ‘most sociologists would agree that when using Atkinson’s measure to address normative questions, o should be between −0.5
and 2.5’ (Schwartz and Winship, 1979).
In choosing appropriate values of o for this study, we have been guided mainly by a study by Blundell et al. (1994) (cited by Pearce and Ulph (1995)) based on household consumption be-haviour over time. The value of o emerging from
this study was 0.8. It is most probable that in-equality aversion in the UK and Sweden differ, and therefore arguable that o should also differ.
However, at the current stage of the research, no value of o has been found for Sweden, and we
therefore used 0.8 as our central value in both case study countries. However, it is clearly appro-priate to investigate the sensitivity of distribu-tional adjustments to changes in the value of o.
Table 2 below shows the variation in the Atkin-son index (I) in Sweden and the UK for a range ofovalues. Using a value ofo=0.8, the Atkinson
S
.
Stymne
,
T
.
Jackson
/
Ecological
Economics
33
(2000)
219
–
236
Table 1
Overview of distributional adjustments to welfare measures
Result Name and author Description Income inequality index used Basis adjusted
Integrates distributional
Income inequality adjusted 4 different types used: Family income before and The income distribution components into changes in 1. Equal weights after tax. Applied to the
growth rates (Klasen, adjusted measure shows an
USA 1947–1991. improvement in the growth well-being, where well-being is
1994) 2. Poverty weights
expressed as income. 3. Gini 1 rate during the 1960s and a
4. Gini 2 down-turn during the 1980s,
i.e. without the income distribution adjustment, the growth rates are
underestimated during the 1960s and overestimated during the 1980s. Attempts to adjust the human
Income adjusted human Gini coefficient The income component of The HDI index is lower when the HDI. This component is accounting for income development index using
development index (HDI)
(UNDP, 1992, 1993) income distribution. The HDI then multiplied by (1−Gini). inequalities. The ranking of the countries slightly changes. is a decomposition index
consisting of three variables: Sweden, for example, changed
from 5th place to 3rd place, income; education; and
longevity. and the UK from 10th to 9th
place (year 1993). Only looked at developing An attempt to enlarge the
Inequality adjusted human Gini coefficient Each of the three scope of distributional issues in
development index components of the HDI are nations. The percentage loss
(Hicks, 1997) the HDI, to include adjusted for inequality by a of HDI varies from 30–57%, but does not change ranking distribution in longevity and factor ofli(1−Gi), whereY
education. is a weighting factor so each by more than four places. dimension could be given a
S
.
Stymne
,
T
.
Jackson
/
Ecological
Economics
33
(2000)
219
–
236
229
Result Income inequality index used
Name and author Description Basis adjusted
Low quintile index, where A measure of sustainable
The index of sustainable The basis for the ISEW is The weighting has a negative
effect on the USA index, economic welfare (ISEW) welfare that takes the variations in the lowest quintile personal consumption,
are monitored. This fits in with which is adjusted for income penalising rising income (Daly and Cobb, 1989) distribution of income into
Rawl’s theory of justice. 1950 is
account. inequality. inequality. The ISEW has been
set as a base year (=100). applied to several other countries, of which the UK and Sweden are two. The
methodology for accounting for income distribution has changed in these studies, and is
described in the empirical section of this paper. National income Beckerman comes to the Income inequality adjusted An experimental calculation Atkinson income inequality index
national income where the conventionally conclusion that taking changes
in income distribution into measured growth rates are
(Beckerman, 1980)
compared with the growth rates account ‘barely affects the
of ‘equivalently distributed growth rates of most countries’.
Applied to several developed income’.
Table 2
Atkinson index in the UK and in Sweden in 1992 for differentovalues
o=0.8 o=1.6
o= −0.5 o=2.5
UK SWE UK SWE
SWE UK SWE UK
−0.065 0.083 0.136 0.168 0.250
Atkinson index (I) −0.034 0.265 0.351
1 – 0.136) of present total income, if the incomes were equally distributed. (it is to be noted, of course, that the value of I depends not only on the value ofo, but also on how current income is
distributed).
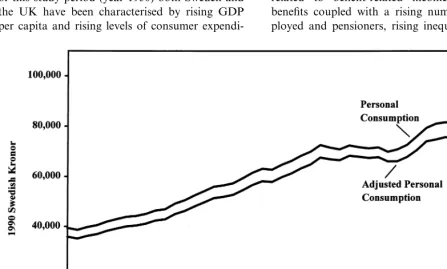
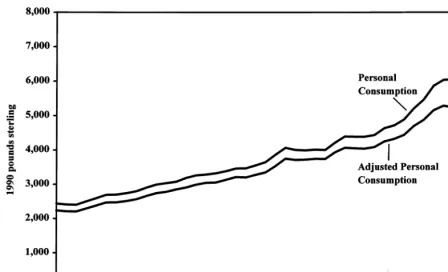
Figs. 3 and 4 show distributionally adjusted personal consumer expenditure for Sweden and the UK (respectively) using an o value of 0.8.
It is clear from the figures that the adjustment has a depressive effect on the chosen measure, although the effect is somewhat more marked for the UK than it is for Sweden. Since the beginning of this study period (year 1950) both Sweden and the UK have been characterised by rising GDP per capita and rising levels of consumer
expendi-ture. The two countries have, however, had differ-ent income distribution policies. In Sweden, one of the main long-term goals of the government has been to smooth out inequalities in the econ-omy, and this was clearly successful (as Figs. 1 and 2 illustrate) at least until the early 1980s.
In the UK, by contrast, intervention by the government has been limited. It is, for example, only very recently that the government has estab-lished a minimum wage for the UK. Atkinson (1993) points out several domestic reasons behind rising inequalities in the UK: a shift from work-related to benefit-work-related income, changes in benefits coupled with a rising number of unem-ployed and pensioners, rising inequalities among
Fig. 4. Distribution-adjusted per capita consumer expenditure in the UK (1950 – 1996).
those not in work and a rise in earnings inequalities.
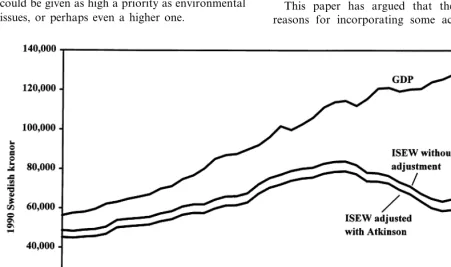
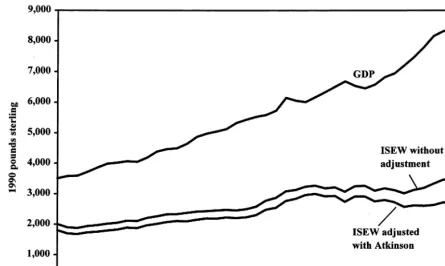
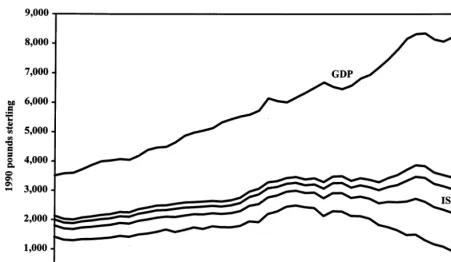
The same kind of distributional adjustment can also be applied to the Daly and Cobb ISEW. The original formulation of the ISEW incorporated income inequality through the use of a relative Gini-coefficient adjustment (as set out in Eqs. (10) and (11)). In the most recent version of the UK ISEW, however, Jackson et al. (1997) proposed using the Atkinson method in place of the Gini coefficient method for the reasons discussed at the end of Section 4. Figs. 5 and 6 show the effects of this adjustment on the ISEW for Sweden and the UK, respectively, using ano value of 0.8.
These graphs illustrate the now-familiar depar-ture of the trend in ISEW from the trend in GDP over the later years of the study. However, they also show the impact which income inequality adjustment has on the index. In both case study countries, the distribution-adjusted ISEW is de-pressed below the unadjusted measure. Fig. 5 illustrates that the negative impact due to income inequality adjustments in Sweden is relatively
con-stant over the time period, indicating that the welfare impact of inequalities in Sweden has not changed drastically over the time period of the study. However, Fig. 6 shows that the negative effect is considerably greater for the UK. Indeed, the impact of the income inequality adjustment changes the shape of the ISEW over the later years of the study from one in which sustainable economic welfare is relatively stable (although with some variations) to one in which sustainable economic welfare is declining. It is clear from this analysis that distributional adjustments can have a significant influence over judgements about the trend in real welfare over time. However, as Fig. 7 shows, these influences are critically dependent upon the particular value chosen for the parame-ter o.
Fig. 7 shows a sensitivity analysis on the distri-bution-adjusted ISEW for the UK over the period 1950 – 1996, using values of o ranging from −0.5
towards the later years of the study. Thus, in a society which is averse to income inequality (o\
0), the measure would be expected to experience a downward influence in the later years. Conversely, in a society which positively favours income in-equality (oB0), the reverse trend would be visible.
Both these trends are visible in Fig. 7. Ato=0, of
course, the ISEW reduces to an index which takes no account of income distribution, since at this value society has no aversion to income inequality.
For higher negative values ofo, Fig. 7 illustrates
a rather significant depressive effect on the welfare index over time. In fact, the choice of an o value
of 2.5 leads to a shift in the ISEW which domi-nates most of the other adjustments to the index, including those introduced by ecological variables (Jackson et al., 1997). Thus, in a society where there is a high aversion towards income inequality (i.e. there is a high o value), distributional issues
could be given as high a priority as environmental issues, or perhaps even a higher one.
It would be possible to take an even broader approach to the distributional issue, which ac-counts not only for income inequalities, but also for inequalities in the distribution of ecological resources. This could change the relative emphasis on ecological and distributional variables in the ISEW considerably. One possible outcome might be that a country with a high aversion to income inequality would also have a high aversion to ecological inequalities, and the depressive effect on the welfare measure would be increased further over time. Taken in conjunction with the argu-ments of Boyce and his coworkers discussed in Section 2, these considerations reinforce the con-clusion that addressing the problem of income inequality is a critical component in the search for sustainable development.
6. Conclusions
This paper has argued that there are good reasons for incorporating some account of the
Fig. 6. Distribution-adjusted ISEW and GDP per capita in the UK (1950 – 1996).
level of intra-generational equity into national measures of well-being in the economy. Further-more, it has been pointed out that intra-genera-tional equity also plays an important part in the determination of future well-being, and a critical role in the search for sustainable development.
We have reviewed a number of attempts to construct indices of inequality in the distribution of income-related variables and to incorporate such indices into measures of welfare. In particu-lar, we have examined in some detail an index proposed by Atkinson (1970) based on the social welfare model, and applied this index to measures of welfare in two case study countries. The results of the empirical analysis suggest that adjusting for distributional effects can have significant impacts both on the value of welfare measures, at particu-lar points in time, and on the trend in such measures over time. The magnitude of this impact will depend both on the degree of inequality in the distribution of incomes during the time period in question, and also on the value of the parametero
— the degree of aversion to income inequality in society.
The work reported in this paper suffers from some clear limitations. In the first place, empirical data on appropriate values of o are sparse.
Lim-ited references in the literature suggest a value of 0.8 as appropriate in the UK, but this work is now somewhat dated, and no comparable data were found for Sweden. Work on evaluating o in
the case study countries is continuing.
Fig. 7. Sensitivity of distributional adjustments in the UK to the value ofo.
consumption. Hicks (1997) has suggested a tech-nique for adjusting the longevity and educational variable of the HDI with a distributional variable. The relationship between income distribution and the environment was explored by Boyce (1994), reviewed in Section 2 above.
In spite of its limitations, the analysis in this paper has confirmed the value of incorporating distributional aspects into measures of current well-being in society, and has indicated the rele-vance of distributional issues for future welfare levels. Moreover, the techniques developed in this paper could potentially be extended to other as-pects of welfare including the distribution of eco-logical, social and human capital.
Acknowledgements
The work described in this paper has been supported in part by the European Commission (TMR Marie Curie Research Training Grant: numbers ENV4-CT96-5033 and
ENV4-CT98-5110, under the Environment and Climate Pro-gramme), by the Engineering and Physical Sciences Research Council and by the Royal Academy of Engineering. An earlier version of the paper was presented at the European Ecological Economics Society’s conference in Geneva March 4 – 7 1998, and we are grateful for critical input and advice from a number of people including Anthony Atkinson, Giles Atkinson, Steven Dodds, Alissa Goodman, Andrew Klemer, Karl-Go¨ran Ma¨ler and Jack Ruitenbeek. The views expressed and any remaining errors are, of course, the responsibility of the authors.
References
Alesina, A., Rodrick, D., 1994. Distributive politics and eco-nomic growth. Quart. J. Econ. May, 465 – 490.
Atkinson, A.B., 1970. On the measurement of inequality. J. Econ. Theory 22, 44 – 263.
Atkinson, A.B., 1983. The Economics of Inequality, second ed. Oxford University Press, NY.
Beckerman, W., 1980. Comparative growth rates of ‘measur-able economic welfare’: some experimental calculations. In: Matthews, R.C.O. (Ed.), Economic Growth and Re-sources, vol. 2. Macmillan, London and NY.
Be´nabou, R., 1996. Inequality and growth. NBER Working Paper No. 5658. National Bureau of Economic Research, Cambridge, MA.
Bjo¨rklund, A., 1995. Preliminary report on income distribu-tion. Mimeo, SOFI 95-06-11. Stockholm University, Stockholm.
Blundell, R., Brewning, M., Meghit, C., 1994. Consumer demand and the life-cycle allocation of household expendi-tures. Rev. Econ. Stud. 61, 57 – 80.
Boyce, J.K., 1994. Inequality as a cause of environmental degradation. Ecol. Econ. 11, 169 – 178.
Boyce, J.K., Klemer, A.R., Templet, P.H., Willis, C.E., 1999. Power distribution, the environment, and public health: a state-level analysis. Ecol. Econ. 29 (1), 127 – 140. Coulter, P.B., 1989.. Measuring Inequality: a Methodological
Handbook. Westview Press, Boulder, San Francisco and London.
Dalton, H., 1920. The measurement of the inequality of in-comes. Econ. J. 30, 348 – 361.
Daly, H., 1992. Allocation, distribution, and scale: towards an economics that is efficient, just, and sustainable. Ecol. Econ. 5, 185 – 193.
Daly, H., Cobb, J., 1989. For the Common Good — Redi-recting the Economy Towards Community, the Environ-ment and a Sustainable Future. Beacon Press, Boston. Dasgupta, P., 1995. The population problem: theory and
evidence. J. Eco. Lit. 33, 1879 – 1902.
Eisner, R., 1994. The index of sustainable welfare: comment. In: Cobb, C., Cobb, J. (Eds.), The Green National Product. University of Americas Press.
ET, various years. Economic Trends — Annual Supplement 1993. Central Statistical Office, HMSO, London. FES, various years. Family Expenditure Surveys. Central
Statistical Office, HMSO, London.
Fritzell, J., Lundberg, O., 1995. Income Distribution, Income Change and Health: On the Importance of Absolute and Relative Income for Health Status in Sweden. Reprint Series No. 452. Swedish Institute for Social Research, Stockholm University, Stockholm.
Goodman, A., Webb, S., 1994. For Richer, for Poorer. The changing distribution of income in the United Kingdom, 1961 – 91. Commentary No. 42. The Institute for Fiscal Studies (IFS), London.
Hicks, D.A., 1997. The inequality-adjusted human develop-ment index: a constructive proposal. World Dev. 25 (8), 1283 – 1298.
Jackson, T., Marks, N., 1994. Measuring Sustainable Eco-nomic Welfare: a Pilot Index 1950 – 1990. Stockholm Envi-ronment Institute/New Economics Foundation (UK), Stockholm.
Jackson, T., Marks, N., 1999. Consumption, sustainable wel-fare and human needs — with reference to UK expendi-ture patterns 1954 – 1994. Ecol. Econ. 28 (3), 421 – 442.
Jackson, T., Stymne, S., 1996. Sustainable Economic Welfare in Sweden: a Pilot Index 1950 – 1992. Stockholm Environ-ment Institute, Stockholm.
Jackson, T., Marks, N., Ralls, J., Stymne, S., 1997. An Index of Sustainable Economic Welfare for the UK 1950 – 1996. Centre for Environmental Strategy (University of Surrey)/ New Economics Foundation, London.
Jansson, K., 1994. Inkomstfo¨rdelningen i Sverige 1975 – 1992 med sa¨rskild beskrivning av perioden 1989 – 1992. Rapport 1994:1 (1994-08-17) Programmet fo¨r Inkomster och Fo¨r-mo¨genhet, Statistics Sweden, SCB publication service, O8rebro.
Jansson, K., 1994a. Inkomstfo¨rdelningen i Sverige 1980 – 1991 med sa¨rskild analys av skattereformen 1990 – 91. Rapport 1993:1 (1994-05-11). Programmet fo¨r Inkomster och Fo¨r-mo¨genhet, Statistics Sweden, SCB publication service, O8rebro.
Klasen, S., 1994. Growth and well-being: introducing distribu-tion-weighted growth rates to revaluate US post-war eco-nomic performance. Rev. Income Wealth 40 (3), 251 – 272. Kuznets, S., 1967. Population and economic growth. Proc.
Am. Phil. Soc. 3, 170 – 193.
Le Grand, J., Propper, C., Robinson, R., 1976. The Econom-ics of Social Problems, third ed. Macmillan, Hampshire and London.
Markandya, A., 1998. Poverty, income distribution and pol-icy-making. Environ. Resour. Econ. 11 (3/4), 459 – 472. Pearce, D., Ulph, D., 1995. A social discount rate for the
United Kingdom. CSERGE working paper GEC 95-01, CSERGE, London.
Perotti, R., 1993. Political equilibrium, income distribution, and growth. Rev. Econ. Stud. 60, 755 – 776.
Persson, T., Tabellini, G., 1994. Is inequality harmful for growth? Amer. Econ. Rev. 84 (3), 600 – 621.
Rawls, J., 1971. A Theory of Justice. Harvard University Press, Cambridge, MA.
Ruitenbeek, H.J., 1996. Distribution of ecological entitle-ments: implications for economic security and population movement. Ecol. Econ. 17, 49 – 64.
SCB, 1997. Inkomstfo¨rdelningsunderso¨kningen 1995. BE 21 SM 9701. Statistics Sweden, SCB Publication Service, O8rebro.
Schwartz, J.E., 1974. Taking a look at income. Mimeo, Har-vard University, Cambridge, MA. Cited in Schwartz and Winship, 1979.
Schwartz, J., Winship, C., 1979. The welfare approach to measuring inequality. In: Schuessler, K.F.K (Ed.), Socio-logical Methodology 1980. Jossey – Bass Publishers, San Francisco, Washington and London (Chapter 1). Sen, A., 1976. Real national income. Rev. Econ. Stud. 43,
19 – 36.
Sen, A., 1997. On Economic Inequality. Expanded edition with a substantial annexe by Foster, J.E and Sen, A. Clarendon Press, Oxford.
Proceedings of the Association of University Teachers of Economics. Blackwell, Oxford.
Stevens, S.S., 1959. Measurement, psychophysics, and utility. In: Churchman, C.W., Ratoosh, P. (Eds.), Measurement: Definition and Theories. Wiley, NY.
Torras, M., Boyce, J.K., 1998. Income, inequality, and pollu-tion: a reassessment of the environmental Kuznets curve. Ecol. Econ. 25 (2), 147 – 160.
UNDP, 1992. Human Development Report 1992. Published for the United Nations Development Programme (UNDP). Oxford University Press, NY and London.
UNDP, 1993. Human Development Report 1993. Published for the United Nations Development Programme (UNDP). Oxford University Press, NY and London.
UNDP, 1996. Indicators of Sustainable Development Frame-work and Methodologies. Methodology Sheets. United Nations Department for Policy Co-ordination and Sustain-able Development (DPCSD). http://www.undp.org. Wilkinson, R.G., 1996. Unhealthy Society: the Afflictions of
Inequality. Routledge, London and NY.
Winship, C., 1976.. Psychological Well-being, Income and Income Inequality. Mimeo, Harvard University, Cam-bridge MA.