Relationship Model Anomaly Harvested
Rice with a Weighted Rainfall Index in
Buru Maluku Using Bootstrap
Aggregating MARS Methods to Predict
the Forecast Error Rates Harvested Area
and Rice Production
Kondo Lembang F1, Loupatty G2, Talakua M.W3
1,3
Lecturer of Mathematic Department, Faculty of Mathematics and Natural Sciences,
Pattimura University
2
Lecturer of Physics Department, Faculty of Mathematics and Natural Sciences,
Pattimura University
Abstract— Seasonal climate variations is one of the main causes of the diversity of crop production in Indonesia. Long drought and drought causing crop failures and food shortages that could affect agricultural production and food security. The indicator is a decline in acreage , harvested area and production declined sharply when climate irregularities. The magnitude of the impact caused by climatic irregularities cause we need a model that connects the harvested area with indicators of climate anomalies that can do the proper planning and anticipation measures early in order to avoid the risk of crop failure. Buru as the largest rice -producing areas in the provinces of Maluku course is expected to avoid the risk of crop failure in order not to disrupt the supply of rice. Data Collection and forecast rice production annually conducted by the Central Statistics Agency (BPS). BPS forecast model but has not entered a climatic factor, while the climate affect rice production. This research used the bootstrap aggregating MARS method to model anomaly rice harvested area with a weighted rainfall index to predict the error rate forecast harvested area and rice production. From the analysis using the best models of replication bagging MARS 150 times in the first period (January-April) and 200 times in second period (May-August) and third period (September-December) obtained an error rate forecast harvested area and rice production respectively by 5.72% and 6.81%.
Keywords— Anomaly Area harvested, weighted rainfall index, MARS, Boostrap Aggregating, rice production.
1
I
NTRODUCTION2
R
EVIEWO
FL
ITERATURE 2.1 MARSMARS is an implementation technique popularized by Friedman [4] for solving regression problems with the aim of predicting the response variable values of a number of predictor variables. MARS is an approach to the development of Recursive Partitioning Regression (RPR) which still has the drawback that the resulting model is not continuous at the knots. MARS model is used to overcome weaknesses in the model generate the RPR is continuous at knots. In spline modeling, the first step is to determine the points of data or a change in the pattern of behavior is called the point knots. The selection of knots in MARS using forward and backward algorithms. The selection of the model using a forward step taken to get the maximum number of base functions with base selection criteria function is to minimize Average Sum Of Square Residual. To parsimony concept (simple model) performed a backward step is selecting base functions of forward stage by minimizing the value of the Generalized Cross-Validation or GCV [4].
The minimum GCV as a criterion for determining knots are as follows:
GCV M
( )
=yi : Value of the response variable ˆ
fM
( )
xi : Estimated value of the response variable on M base functions.From forward and backward, MARS models obtained as follows:
ˆ
m : coefficients of m-base functions M : maximum of base function
tkm : Point knots of independent variables x
v k(,m)
Algorithms for MARS models are as follows:
1. Starting with a simple model involving only constant base functions.
2. Finding space of base functions, for each variable and for all knots are possible, and add it to minimize the prediction error.
Finally, in the last stage, the trimming procedure is applied in which the base functions are not significantly removed to obtain the minimum GCV.
2.2 Bagging MARS
Bagging method was first used by Breiman [1]. Bagging is used as a tool to form a more stable classifier. Bagging predictors is a method to generate multiple versions of a predictor and use it to aggregate predictors. Multiple versions of the bootstrap replication is formed by a set of data.
Defined a set data £ consists of
(
yn,xn)
,n=1,…,N wherey a numerical response or a class label. If x the input is then y predicted byφ
(x,£), whereφ
(x,£) is a predictor. To gain a better predictor performed bootstrap replication {£k} is then called {φ
(x,£k) }. Performed totally B-times of bootstrap replication so that{£(B)} from £ where {£(B)} resampling with replacement and established predictors of {
φ
(x,£(B)}.Bagging MARS algorithm is as follows.
1. Taking bootstrap n samples of set data £ with n-repetitions to each aggregate variables in each observation.
2. MARS modeling sets data £B bootstrap sample results.
3. Test the model generated in step 2.
4. Repeating steps 1-3 as much as B-times (bootstrap replication).
5. Obtain the best model.
6. Forming bagging MARS models of the average of each parameter at each sampling to B-times.
To obtain better results then the bootstrap replication is done as much as possible.
2.2.1 Weighted rainfall index and anomalies Harvested Rice
Weighted rainfall index (weighted rainfall index: WRI) is compiled based on monthly rainfall data is weighted. WRI which can be used in the modeling is that the WRI weighted system has been modified by Sutikno (2008). The modification is written as follows.
WRI
: Area weighted rainfall Regional weather forecast region (DPM) / DPM revision in the region/
district/ city
m : a large area of DPM
Aj : Total area of j-DPM
LTt : Plant area at t-month
From the equation above three equations obtained for each of the following. AnLP1i = WRI1i+ WRI2i+ WRI3i + WRI4i
AnLP2i = WRI5i + WRI6i+ WRI7i + WRI8i
AnLP3i = WRI9i + WRI10i+ WRI11i + WRI12i
where
i
= 1, 2, 3,..., n (n is the number of observations)p = 1, 2, 3 (Period)
AnLP1 = harvested area Anomaly in first period (January to April)
AnLP2 = harvested area Anomaly in second period (May to August)
AnLP3 = harvested area Anomaly in third period (September to December)
WRI1, ..., WRI4 indicates a weighted rainfall index first until the fourth month in a first period (WRI1 = in January, WRI2 = in February, WRI3 = in March, WRI4 = in April).
WRI5, ..., WRI8 indicates a weighted rainfall index first to fourth month in a second period (WRI5 = in May, WRI6 = in June, WRI7 = in July, WRI8 = in August).
WRI9, ..., WRI12 indicates a weighted rainfall index first to fourth month in a third period (WRI9 = in September, WRI10 = in October, WRI11 = in November, WRI12 = in December).
3
M
ETHODO
FA
NALYSISMethods of data analysis performed in this study can be explained as follows .
1. Identification of data includes the identification and the relationship between WRI and
AnLP
p that can be shown on the scatter plot.2. To model based anomaly harvested area weighted rainfall index for the data in- sample using the bagging MARS method with the following stages.
• In MARS models for the first sets data
− Determine the maximum base functions
− Determine the maximum number of interactions
− Determine the minimum number of observations between knots
− Determine the number of degrees of freedom
•
Getting the best MARS models for the initial set of data based on the value of the smallest MSE and GCV.•
Getting the significant variables of the best MARS models for the initial set of data.•
Perform bagging of the pair response variable and the predictor variables were significant from the best MARS models for data sets beginning with 50, 100, 200, and 250 bootstrap replication.•
Perform MARS modeling on each sample-B bootstrap replication with the maximum numberof base functions, the maximum amount of interaction and the minimum number of observations between knots is equal to the maximum number of base functions, the maximum amount of interaction and the minimum number of observations between knots at best MARS models for data sets beginning.
•
Getting MSE at each sampling B bootstrap replication.•
Getting MSE bagging of the average MSE at each sampling to Bthe value of changing each knots for each replication so that the estimated parameters cannot be averaged.
3. Counting rice production forecast for the year to out -sample of data as follows.
•
Calculating forecast rice harvested area forecast results by adding the anomalous area harvested to each period results of MARS best modeling with an average area harvested during a certain period (2002 to 2008).•
Suspect productivity to each period using the average productivity of the last five years (2007 to 2011).•
Calculating forecast rice production to each period.Pp = Prop× LPp with p = 1,2,3
Pp : forecast of production in the p-period Prop : forecast of productivity in the p-period LPp : forecast of harvested area in the p-period
•
Getting forecast of rice production for the year, which is the sum of the third period of the forecast.• Comparing rice production forecast results have been obtained with the MARS method with the actual value of rice production from BPS issued last three years (2009 to 2011).
4
D
ISCUSSION4.1 Identification Data
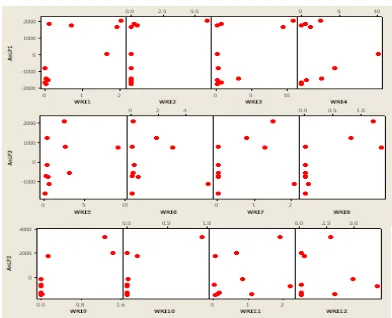
To model the relationship between the anomalous area harvested and predictor variables weighted rainfall index first identified patterns of relationship between the two. Identification of relationship pattern is very necessary to know the exact model in modeling the relationship between the two variables.
Figure 1 shows that the pattern of relationships between AnLP and WRI appears no linierity clear pattern not even have a specific pattern. Likewise, the direction of the relationship is positive or negative. This suggests that AnLP in first period (January to April), second period (May to August), and third period (September to December) are not affected by these two variables are linearly so necessary to find the possibility of non-linear statistical models.
4.2 Relationship between the model anomaly rice harvested to each Period (AnLPp) and weighted
rainfall index (WRI) using Bagging MARS method.
In this study bagging MARS method is applied in modeling the anomalous area harvested per period as the response variable and weighted rainfall index as a predictor variable. The data used for modeling can be quite small, namely 10 years since year 2002 to year 2011, so it needs to be done in preparing the model resampling methods. Resampling method used is that a bagging sampling with replacement for a data set consisting of the response variable and the predictor variables (significant base functions).
4.2.1 Relationship between the model anomaly rice harvested area (AnLP) and the weighted rainfall
index (WRI) in first period using bagging MARS method.
4.2.1.1 MARS Model
Initial step of MARS modeling done by trial and error on the maximum base function (BF), maximum interaction (MI), minimum number of observations between knots or minimum observation (MO), and the number of degrees of freedom (DB) until an optimal model is obtained with the MSE and GCV minimum. Friedman [4] suggests a maximum number of basis functions of two to fourth times the number of predictor variables. Maximum interaction one, two, or three with a consideration if more than three will result in a very complex model. As well as, the minimum distance between knots or knots as the minimum observation between 0, 10, 20, 50, and 100.
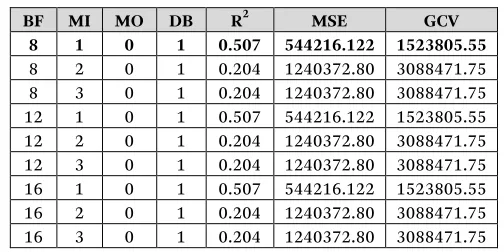
Table 1 shows the value of R2, MSE, and GCV in combination BF, MI, MO, and DB based on the criteria of goodness of the model, selected models with minimum MSE and GCV. From the above results it can be concluded the model with a combination of BF = 8, MI = 1, MO = 0, and DB = 1 is the best model. The best MARS model is as shown below.
ˆ
From the best MARS models can be interpreted that each increase of one unit of the base functions 1 (BF1) can increase rice yields broad anomalies in the period 1 at 985.757 if weighted rainfall index in January (WRI1) more than 0,088 mm, with a base of other functions that go assumed to be constant in the model. Meanwhile, for each increase of one unit of the base function 4 (BF4) can reduce anomalies rice harvested area of 9,439.66 a first period if the weighted rainfall index in February (WRI2) of less than 0.251 mm with base other functions are included in the model held constant. The next best model obtained from two
TABLE 1. TRIAL AND ERROR MODEL MARS A FIRST PERIOD IN BURU
predictor variables were entered into the model, which is a weighted index of rainfall in February (WRI2) and weighted rainfall index in January (WRI1) based on the relative variable importance table. Percentage of contribution weighted rainfall index in February (WRI2) and weighted rainfall index in January (WRI1) are shown in Table 2 below.
4.2.1.2 MSE calculations on models of bagging MARS
MARS modeling of the data sets obtained MSE Value in the first period is 544,216.122. To minimize the error variance performed on the data resampling. Table 3 below shows the results for the first period bagging MARS in Buru.
Table 3 gives the smallest MSE value of the information obtained during the boostrap replicate as much as 150 times. thus it can be concluded that the best results obtained in the replication boostrap bagging as many as 150 times. Bagging models can lower the MSE value of the data model that is equal to the initial set of 544,216.122 be 1,538.90 or in other words bagging can reduce the value of MSE of 542,677.222 of the initial data sets.
4.2.2 Relationship between the model anomaly rice harvested area (AnLP) and the weighted rainfall
index (WRI) in second period using bagging MARS method.
4.2.2.1 MARS Model
Trial and error to BF, MI, MO, and DB MARS modeling in second period are shown in Table 4.
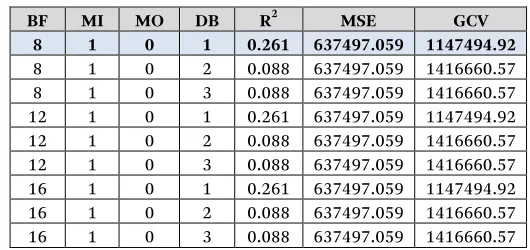
From Table 4 it is seen that the best MARS model is a combination of BF = 8, MI = 1, MO = 0, and DB = 1. It can be seen from the MSE and the smallest GCV among others, are respectively 637,497.059 and 1,147,494.92 so the best MARS model is as shown below.
TABLE 2. PERCENTAGE OF CONTRIBUTIONS OF EACH VARIABLE IN THE FIRST PERIOD
Variable Contribution
WRI2 100 %
WRI1 57.711 %
TABLE 4. TRIAL AND ERROR MODEL MARS A SECOND PERIOD IN BURU
BF MI MO DB R2 MSE GCV
8 1 0 1 0.261 637497.059 1147494.92
8 1 0 2 0.088 637497.059 1416660.57
8 1 0 3 0.088 637497.059 1416660.57
12 1 0 1 0.261 637497.059 1147494.92
12 1 0 2 0.088 637497.059 1416660.57
12 1 0 3 0.088 637497.059 1416660.57
16 1 0 1 0.261 637497.059 1147494.92
16 1 0 2 0.088 637497.059 1416660.57
16 1 0 3 0.088 637497.059 1416660.57
TABLE 3. RESULTS OF BAGGING MARS IN FIRST PERIOD
Bootstrap replication
Average value of MSE
Decrease in the value of MSE
25 times 19511.60 524704.522
50 times 3566.25 540649.872
100 times 3993.14 540222.982
150 times 1538.90 542677.222
ˆ
This model can be interpreted that each increase of one unit of the base functions 1 (BF1) can increase rice yields broad anomaly in second period for 1,654.87 if weighted rainfall index in August (WRI8) more than 0.22 × 10⁻⁷ mm, on the base of other functions in the model are held constant. Furthermore, Table 5 looks only variable weighted rainfall index in August (WRI8) are included in the model. So important variable scores for weighted rainfall index in August (WRI8) worth 100%, which means the variable weighted rainfall index in August has a dominant influence on anomalous rice harvested area in second period (May-August).
4.2.2.2 MSE calculations on models of bagging MARS
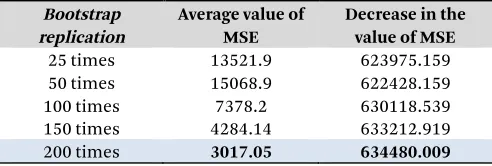
The best MARS models between anomalous rice harvested area weighted rainfall index in second period provide information that model has a MSE is 637,497.059, with a significant predictor variables are weighted rainfall index in August (WRI8). Table 6 below shows the average MSE in second period.
Table 6 provides information that bootstrap replication earned 200 times average value of the smallest MSE is 3,017.05, So based on the above results it can be concluded that the results obtained by bagging the best with an average value of the smallest MSE is a bootstrap replicate as much as 200 times. With replication as much as 200 times, bagging can reduce MSE of the initial set of data models is 637,497.059 be 3,017.05 or in other words bagging can reduce the value of MSE of 634,480.009 from the initial set of data models.
4.2.3 Relationship between the model anomaly rice harvested area (AnLP) and the weighted rainfall
index (WRI) in third period using bagging MARS method.
4.2.3.1 MARS Model
Table 7 gives information based on that value the smallest MSE and GCV is combination of BF=8, MI=1, MO=0, and DB=1. So that model with the combination is the best model. This model is shown below.
ˆ
TABLE 5. PERCENTAGE OF CONTRIBUTIONS OF EACH VARIABLE IN THE SECOND PERIOD
Variable Contribution
WRI8 100 %
TABLE 6. RESULTS OF BAGGING MARS IN SECOND PERIOD
Bootstrap
25 times 13521.9 623975.159
50 times 15068.9 622428.159
100 times 7378.2 630118.539
150 times 4284.14 633212.919
From the best model can be interpreted that each increase of one unit of the base function 2 (BF2) can reduce anomalies rice harvested area in the period 3 of 24,391.732 if weighted rainfall index in September (WRI9) of less than 0.141 mm, with bases other functions assumed to be constant in the model. Later in the third period, based on table 8 weighted rainfall index in September (WRI9) contributes 100%, which means the variable weighted rainfall index in September to have a dominant influence on anomalous rice harvested area in the third period.
4.2.3.2 MSE calculations on models of bagging MARS
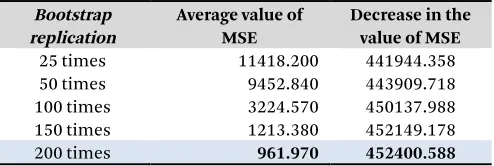
The best MARS models between anomalous rice harvested area weighted rainfall index for the third period provides information that the model has a MSE is 453,362.558 significant predictor variables are weighted rainfall index in September (WRI9). Table 9 below shows the average MSE results of bagging MARS in third period.
Table 9 provides information that the bootstrap replication earned 200 times the average of the smallest MSE value is 961.970, so it can be concluded that the results obtained by bagging the best with an average value of the smallest MSE is a bootstrap replicate as much as 200 times. With replication as much as 200 times, bagging can reduce MSE of the initial set of data models for 453,362.558 be 961.970, or in other words, bagging can reduce the value of MSE is 452,400.588 from the initial set of data models.
4.3 Rice Production forecast
To evaluate the model and see the level of reliability that is formed, it can be seen from the average forecast error rates for harvested area and production of rice in the year 2009 to the year 2011. Rice production Forecast to each period is the multiplication of the value of the harvested area forecast productivity. Used to estimate the productivity of the average productivity value over the last five years. While
TABLE 7. TRIAL AND ERROR MODEL MARS A THIRD PERIOD IN BURU
BF MI MO DB R2 MSE GCV
8 1 0 1 0.761 453362.558 816052.711
8 2 0 1 0.749 453362.558 858437.928
8 3 0 1 0.749 453362.558 858437.928
12 1 0 1 0.761 453362.558 816052.711
12 2 0 1 0.749 453362.558 858437.928
12 3 0 1 0.749 453362.558 858437.928
16 1 0 1 0.761 453362.558 816052.711
16 2 0 1 0.749 453362.558 858437.928
16 3 0 1 0.749 453362.558 858437.928
TABLE 8. PERCENTAGE OF CONTRIBUTIONS OF EACH VARIABLE IN THE THIRD PERIOD
Variable Contribution
WRI9 100 %
TABLE 9. RESULTS OF BAGGING MARS IN THIRD PERIOD
Bootstrap replication
Average value of MSE
Decrease in the value of MSE
25 times 11418.200 441944.358
50 times 9452.840 443909.718
100 times 3224.570 450137.988
150 times 1213.380 452149.178
the forecast harvest area was obtained from the sum of the forecast anomalies rice harvested area with average area of rice crop. Of the best MARS models which have been obtained from the previous analysis can be calculated models forecast values for harvested area and production of rice to each period as shown in Table 10.
Table 10 provides information based on the results of the forecast error for the harvested area and rice production to each period look distinctly average prediction error rate is at least third periods respectively 14.61% and 14.36%, followed by a period of 2 each by 20.01% and 18.97%, as well as period 1 respectively 26.53% and 26.52%. BPS and the Ministry of Agriculture every year to data collection and forecast rice production in Indonesia is divided into three periods, namely from January to April, May to August, and September to December. Harvested area of each period obtained from the amount of harvested area in the first month until the fourth month in a period. Production and harvested area in one year (January to December) is obtained from the sum of production and harvested area for three periods. So the forecast results for the year and harvested area of rice production MARS models as shown in Table 11 below.
Based on the results of Table 11 forecasts to each year for harvested area and rice production of MARS models can be calculated the average error rate forecast harvested area of rice by 5.72% while the average error rate for rice production forecast is 6.81%. Average error rate of rice production forecast issued BPS to each province ranged from 5% to 10%.
TABLE 10. FORECAST VALUE OF HARVESTED AREA AND RICE PRODUCTION TO EACH PERIOD (USING MODELS MARS)
Period Year
Harvested Area Production (Abs (∆)/Act) x100%
Actually Forecast Actually Forecast Harvested
area Production
TABLE 11. FORECAST VALUE OF HARVESTED AREA AND RICE PRODUCTION HARVESTED TO EACH YEAR
Year
Harvested area (Ha) Production (ton) (Abs (∆)/Act) x100%
Actually Forecast Actually Forecast Harvested
5
C
ONCLUSIONSResults of rice harvested area forecast MARS model in Buru has an error rate forecast is 5.72%. As for rice production forecast results have an error rate of 6.81%. In accordance with an error rate forecast of rice production issued BPS ranging between 5% to 10%, it can be said rice production forecast errors in Buru is in accordance with the rate specified by BPS.
6
R
EFERENCES[1] Breiman. L, “Bagging Predictor”, Technical report 421, Statistics Department of the University of California, 1994. [2] Efron. B. and Tibshirani. R.J, “An Introduction to the Bootstrap”, Chapman & Hall, Inc., New York, 1993. [3] Eubank. R. L, “Spline Smoothing and Nonparametric Regression”, Mercel Dekker, New York, 1988.
[4] Friedman. J. H, “Multivariate Adaptive Regression Splines”, Rev Tech Report 102, Department of Statistics Stanford University Stanford, California, 1990.
[5] Kartini. A. Y, “Bagging MARS for Developing forecast Models of Anomalies Area Rice Harvested of Weighted Rainfall Index in Ngawi”, Thesis, Graduate Program, Sepuluh Nopember Institute of Technology, Surabaya, 2010.
[6] Sutikno, “Statistical Downscaling GCM Outcomes and Utilization for Rice Production Forecasting”, Dissertation, Graduate Program, Bogor Agricultural University, Bogor, 2008.