*Corresponding author: E-mail: [email protected]
Strengthening No: 36b/E/KPT/2016 Available online at http://medpet.journal.ipb.ac.id/
Potency of Culled Saanen Crossbred Goat in Supplying Raw Meat for Traditional
Thai Butchery
A. A. Putraa,c, S. Wattanachanta,*, & C. Wattanachantb
aDepartment of Food Technology, Faculty of Agro-Industry, Prince of Songkla University,
Hat Yai, Songkhla, 90112, Thailand
bDepartment of Animal Science, Faculty of Natural Resources, Prince of Songkla University,
Hat Yai, Songkhla, 90112, Thailand
cDivision of Technology of Animal Products, Faculty of Animal Science, Universitas Andalas,
Limau Manis, Padang, 25163, Indonesia
(Received 07-03-2017; Reviewed 04-04-2017; Accepted 22-05-2017)
ABSTRACT
Potency of culled Saanen crossbred goat meat to replace the supply of yearling Boer crossbred goat meat was evaluated. Selected muscles from leg and shoulder cuts were analysed for their nutritional
(proximate composition, collagen, amino acids, fatty acids), physicochemical (pH, myoglobin, drip loss,
cook loss, shear force, lightness (L*) redness (a*) yellowness (b*), microstructure), and sensory (triangle test, hedonic test) evaluations. Meat samples from culled Saanen crossbred goat exhibited higher val-ues in protein, collagen, and MUFA (P<0.05) than those from Boer crossbred goat, while lower valval-ues in ash, soluble collagen, and SFA were obtained (P<0.05). Meat from culled Saanen crossbred goat re-vealed higher cook loss, shear force, and redness compared to those from a yearling Boer crossbred goat (P<0.05). In addition, thicker perimysium in meat of Saanen crossbred goat was obtained particularly that
could be seen on leg part. In sensory evaluation result, the panels could detect the differences between raw meat characteristics of these goat breeds (P<0.05) within the same muscle. However, the panels could not distinguish the difference between breeds in leg meat after being cooked. Shoulder meat of Saanen
crossbred goat had less acceptance level compared to the other samples (P<0.05) particularly on its texture and taste quality. In summary, shoulder cut of culled Saanen crossbred goat exhibited a well-intentioned potency to substitute the supply of meat from yearling Boer crossbred goat. Nevertheless, pre-treatment might be applied to leg cut of Saanen crossbred goat to solve the less acceptance level of its textural and taste characteristics.
Keywords: Saanen goat, Boer goat, goat meat quality, goat meat composition, microstructure of goat meat
ABSTRAK
Potensi daging kambing peranakan Saanen tua untuk mensubstitusi suplai daging kambing per-anakan Boer telah dievaluasi. Otot dari bagian kaki dan bahu telah dianalisis untuk melihat kandungan
nutrisi (komposisi proksimat, kolagen, asam amino, dan asam lemak), sifat fisikokimia (pH, mioglobin,
susut drip, susut masak, shear force, lightness (L*) redness (a*) yellowness (b*), dan mikrostruktur), dan penilaian sensori (uji segitiga dan uji hedonik). Berdasarkan penelitian didapatkan bahwa kandungan protein, kolagen, dan MUFA daging kambing peranakan Saanen lebih tinggi (P<0.05) daripada daging kambing peranakan Boer, sedangkan kadar abu, kolagen terlarut, dan SFA-nya lebih rendah (P<0.05). Susut masak, shear force, dan redness daging kambing peranakan Saanen lebih tinggi daripada daging kambing peranakan Boer (P<0.05). Selain itu, gambaran perimisium yang lebih tebal (P<0.05) pada daging kambing peranakan Saanen telah didapatkan, terutama dapat dilihat pada bagian kaki. Pada pe-nilaian sensori, panelis dapat membedakan daging mentah dari kedua bangsa kambing pada dua bagian karkas, tetapi panelis tidak dapat membedakan daging kaki di antara kedua bangsa kambing setelah di-masak. Daya terima panelis terhadap daging bahu paling rendah (P<0.05) dibandingkan sampel lainnya, terutama terkait dengan kualitas tekstur dan rasanya. Dapat disimpulkan bahwa daging bagian bahu kambing peranakan Saanen berpotensi sebagai alternatif pengganti daging kambing peranakan Boer. Sementara itu, daging bagian kaki kambing peranakan Saanen memerlukan perlakuan lanjutan untuk mengatasi daya terimanya yang rendah terkait sifat tekstur dan rasanya.
INTRODUCTION
In Thailand, goat is an alternative livestock that is increasingly raised for meat and milk purposes. From statistics data, the number of goats increased about 23.2% from 380,277 heads in the year of 2010 to 468,377 heads in the year of 2014 (DLD, 2015). Goat rearing is popular in Thai-Muslim community (Anothaisinthawee
et al., 2010; Seilsuth et al., 2016), particularly in Southern
Thailand that shows an increasing rate of goat meat consumption (Jittapalapong et al., 2012). In general, goat
reared traditionally under an extensive- or semi-inten-sive system using native goat breed supported with the availability of local feed sources.
Due to the lower performances of Thai native goat compared to the crossbred and pure bred goat
(Supakorn et al., 2011; Anothaisinthawee et al., 2012),
the Department of Livestock Development of Thailand imported several exotic breeds such as Boer, Anglo-Nubian, Saannen to upgrade Thai goat breed. Thai crossbred goat obtained from native female Thai x male Anglo-Nubian has been popularized since the last 30
years (Wasiksiri et al., 2013). Moreover, among various
latest breeding programs now, Boer is one of the most accepted meat-type goat in Thailand, and is being a popular goat breed for goat meat butchery. This was due to the Boer and its crossbred goats performed bet-ter with a higher live weight gain and provided a betbet-ter carcass yield than the other exotic crossbred or native
goats (Anothaisinthawee et al., 2010; Anothaisinthawee
et al., 2012).
From 2009 to present, the demand of goat meat was generally increased while the number of meat goat is not sufficient to slaughter for Thai goat meat consump -tion. Thus, to substitute the consumer needs, meat from dairy goat, particularly Saanen, is used to compensate the meat for the meat goat. Although Saanen is a popu-lar dairy-type goat due to its higher milk yield (Mioč
et al., 2007; Mioč et al., 2008), meat from Saanen both
buck and culled doe are commonly supplied to the lo-cal butcher. However, meat from culled Saanen does might be less tender due to the older age, so the price is lower than meat from Boer meat goat. In fact, it should be highlighted that traditional consumers in the market pay an attention to the meat yield rather than the meat quality. Thus, it is needed to compare the quality of culled Saanen milking goat with Boer goat meat.
The objective of this study was to compare nutri -tional, physicochemical, and sensory attributes of meat between Saanen crossbred and Boer crossbred goats. Information obtained from this study would be benefit for consumers, butchers, producers, and researchers to see the possibility of culled Saanen does as an alterna-tive for goat meat demand. In addition, it could also be a consideration to decide an appropriate pre-treatment for culled Saanen goat for meat products if it is needed. Moreover, some variations among various muscles within similar goat breed could be obtained. Thus, it was important to determine meat characteristics be-tween selected muscles in leg and shoulder.
MATERIALS AND METHODS
Materials
Four 5-year-old Saanen crossbred (87.5% Saanen x 12.5% Thai native; a main dairy breed reared in Thailand) and four 1-year-old Boer crossbred (75% Boer x 12.5% Anglo-Nubian x 12.5% Thai native; a main meat breed reared in Thailand) goats were ob -tained from Sitichai Dairy Goat Farm located in Sadao district, Songkhla, Thailand. Culled Saanen crossbred goats were raised under intensive system and were fed
withchopped Napier grass (Pennisetum purpureum) ad
libitum and concentrate was supplemented at 2.5% of
body weight (14% crude protein (CP) and 3.2 Mcal/kg) to build up their body condition for about 3 months be-fore being slaughtered. Boer crossbred goats were raised under a semi-intensive system when goats were kept in
house and fed with chopped Napier grass ad libitum and
concentrate diet (14% CP and 3.2 Mcal/kg) at 1.5% of body weight of each. Under a semi-intensive system, the experimental goats were allowed to graze on Ruzi grass (Brachiaria ruziziensis) paddock for about 3 to 4 h daily
before being slaughtered.
The animals were transferred and slaughtered at Meat Laboratory, Department of Animal Science, Faculty of Natural Resources, Prince of Songkla University, Hat Yai District, Songkhla Province. The slaughtering procedure followed the guidelines enlight-ened in Thai Agricultural Standard 8400-2007 (National Bureau of Agricultural Commodity and Food Standards of Thailand, 2007) and Thai Agricultural Standard 9040-2013 (National Bureau of Agricultural Commodity and Food Standards of Thailand, 2013). After dress -ing the carcass us-ing the skinn-ing method, the carcass obtained was stored at 4°C/18 h for aging. Then, meats
from the leg cut (biceps femoris and semitendinosus) and
the shoulder cut (supraspinatus and infraspinatus) were
selected for analyses. Biceps femoris and supraspinatus
representing samples used for physicochemical analyses
and sensory evaluation, while semitendinosus and
infra-spinatus representing samples used for fatty acid profiles
determination.
Methods
Proximate analysis. Proximate analysis was conducted based on the guidelines of the AOAC (2000). Moisture content was examined using oven drying, protein was measured using Kjeldahl, fat was investigated using soxhlet, and ash was obtained using dry ashing.
using a UV-spectrophotometer (UV-1700 PharmaSpec, Shimadzu Corporation, Japan). A-7.25 factor conversion was multiplied with hydroxyproline to convert the ob-tained diluted collagen into mg/g meat sample.
Soluble collagen. The extraction of meat soluble col-lagen was prepared following the procedure explained
by Liu et al. (1996). A total of 2 g minced meat was
mixed with 25% Ringer solution using a homogenizer
(WiggenHauser®, Germany) for 1 min. A heating proce
-dure of the homogenate in a water bath at 77°C for 70 min was applied. Then, the centrifugation of heated homog-enate at 2300xg/30 min/4°C was conducted. Supernatant obtained from centrifugal separation was collected. The precipitate was extracted again as the same procedure explained. After that, the latter obtained supernatant was combined with the former one. The hydrolysis procedure followed the same method as explained in total collagen hydrolysis. The result of soluble collagen was reported as a percentage of total collagen.
Fatty acid composition. Lipid extraction was prepared for fatty acid determination by following the method described by Bligh & Dyer (1959). Then, the extracted lipids were esterified into fatty acid methyl esters (FAME)
(Jham et al., 1982). After that, fatty acid methyl esters were
determined using Gas Chromatograph, 7890 (Agilent Technologies, USA) based on Gas Chromatography– Flame Ionization Detector technique.
pH. pH determination was measured using the
guide-lines explained by Wattanachant et al. (2004). A total of
1 g sample was mixed with 25 mL deionized water us
-ing a homogenizer (WiggenHauser®, Germany) for
1 min. A digital pH meter (SevenGo S62-FK2 Mettler Toledo, Switzerland) was used to measure the pH of the homogenate.
Myoglobin. An adapted method from Krzywicki (1982) was conducted to determine myoglobin content of the sample. The absorbance was determined at 572, 565, 545, and 525 nm using a UV-spectrophotometer (Libra S22 Biochrom, England). The total myoglobin content (Mmol/L) was calculated using the following formula: Total myoglobin= (-0.1666R1 + 0.086R2 + 0.088R3 + 0.099) x A525
where R1, R2, and R3 are symbolised of A572/A525, A565/A525, and A545/A525, respectively.
A-16824 Da as molecular weight of goat myoglobin
(Suman et al., 2009; Suman & Joseph, 2013) was multi
-plied with the obtained myoglobin content to convert the result from Mmol/L of diluted myoglobin into mg/g of meat sample.
Drip loss and cook loss. Stainless steel surgical blade (Feather Safety Razor co ltd., Japan) was used for sizing meat sample into 2x1x0.5 cm. For drip loss determina -tion, the sample was blotted with multipurpose towel pa -per and weighed before being moved into a sealed plastic bag (size 4x6 cm). Then, the covered sample was stand on refrigerated temperature (4°C) for 24 h. After that, the sample was moved, blotted, and weighed again as was
conducted in the initial preparation. Finally, drip loss was determined based on post weight and initial weight of sample measured and reported in percentage. For cook loss determination, sealed-plastic bag samples were heat-ed on a water bath (80°C) for 10 min. After that, heatheat-ed sample was cooled, blotted and weighed as performed on the beginning preparation. Calculation of cook loss was similar to that of drip loss (Wattanachant, 2005).
Texture. Sizing procedure of sample was conducted with the same protocol used for determinations of drip loss and cook loss. Texture of sample was determined using a texture analyser (TA-XTplus Stable Micro System Texture Analyser, UK). A-2 mm/s cross head speed and a-50 kg load cell was fixed on such instrument. Score obtained after a Warner-Bratzler blade cut the sample representing
shear force of sample (Dawson et al., 1991).
Color. A Huntarlab colorimeter (Hunterlab ColorFlex, Virginia) was used to determine the color of sample. A black glass and a white standard tile were used to stan-dardize the instrument before being applied for color measurement, respectively. Color was reported into lightness (L*), redness (a*), and yellowness (b*) as used in International Commission on Illumination (CIE) system.
Microstructure. Microstructure determination was conducted using the method explained by Palka & Daun (1999) with slight modification. A sizing procedure of meat into 1x0.5x0.5 cm was applied carefully using similar razor blade used in sample preparation for drip loss, cook loss, and texture analyses. The specimen was, then, fixed in 0.1 M phosphate buffer pH 6.5 containing 2.5% glutaraldehyde. After 2 h room temperature fixation, a rinsing procedure using distilled water was applied. Every 1 h, then, a gradual dehydrated procedure using 25%, 50%, 70%, 95%, and absolute ethanol of specimen were conducted. The latter procedure were applied twice. A nitrogen-short dipping procedure was conducted on specimen before a thin-cutting process using razor blade was performed. After the remaining of non solid substance was removed using critical point dryer (Polaron CPD7501, East Sussex, UK), the thin fragments were placed on an aluminium stubs and then a gold coating procedure was applied using sputter coater (West Chester, PA, USA). Then, the photograph of sample was taken using a SEM on 10 kV accelerating voltage. A 500x (cross section) and a 10.000x (longitudinal section) magnification were used. Afterward, muscle fibre diameter and sarcomere length were determined using planimeter and vernier caliper, respectively. Fifteen measurements in each three video prints obtained were examined both for muscle fibre diameter and sarcomere length.
Sensory evaluation. Sensory evaluation was divided into triangle test and hedonic test following the general
guidelines explained by Meilgaard et al. (2016). Thirty
samples and one odd sample). The panel was asked to determine the odd sample. The determination of samples in triangle test was conducted for both raw leg and shoulder meat. In hedonic test, samples were prepared by cooking until reaching 80°C of end point temperature using boiling method. Then, the plain cooked samples were served to the panels. Nine-point-hedonic scale (1= dislike extremely, 9= like extremely) was applied to determine the preferences level for color, texture, taste, aroma, and overall acceptances.
Statistical analysis. This study was conducted using completely randomized design (CRD) for physicochemi -cal analyses. The model of this design was Yij = a + tj + eij, where Yij was an observed value, a was an overall mean, t was a fixed effect of treatment i, and eij was a random effect. In particular for sensory preference, randomized complete block design (RCBD) was applied through the following model: Yij = a + bj + tj + eij, where Yij was an ob
-served value, a was an overall mean, b was a block effect
or panel effect i, t was a fixed effect of treatment j, and eij was a random effect. Statistical data analyses of physi -cochemical and sensory preferences were subjected to a one way ANOVA followed by Duncan’s New Multiple Range Test using SPSS Statistics at 0.05 significant level. Significance in triangle test (0.05) was determined based on critical number (minimum) of correct answers as de
-scribed by Meilgaard et al. (2016).
RESULTS
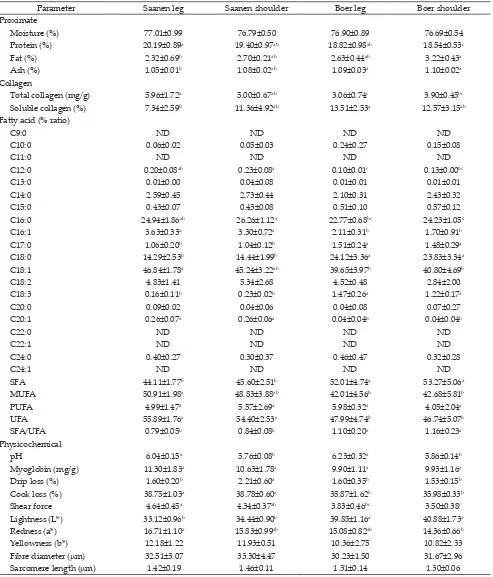
The result of nutritional composition and physi-cochemical characteristics of meat from yearling Boer and culled Saanen goats is presented in Table 1. Protein content of Saanen goat meat was considerably higher than that of Boer goat meat, while its intramuscular fat content exhibited a lower trend. Lower trend of fat content in Saanen meat compared to that of Boer meat was performed. Total collagen of meat from Saanen goat was higher than that of Boer goat within the same cut, while lower soluble collagen percentage of leg of Saanen goat meat was obtained. Saanen goat meat contained substantial lower saturated fatty acid (SFA) compared to Boer goat meat, while its monounsaturated fatty acids (MUFA) were higher. At the same time, polyunsaturated fatty acids (PUFA) of meat between breeds were not different.
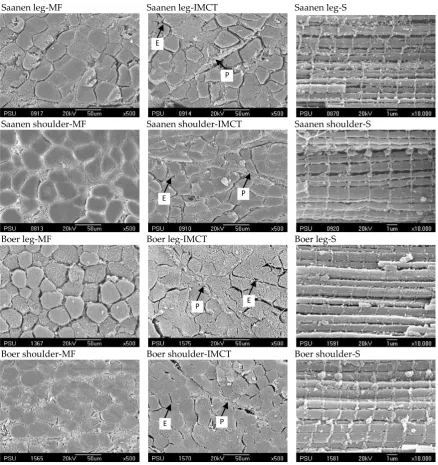
pH of meat was varied between cuts, while meats from the leg cuts exhibited higher pH than those of the shoulders. Cook loss and shear force of Saanen goat meat were significantly higher than those of Boer goat meat, while its lightness was significantly lower. At the same time, the myoglobin content of the samples was not much different. The non-significant differences were obtained in the microstructure of samples both fibre diameter and sarcomere length. However, higher standard deviations in Saanen goat meat than those of Boer goat meat were obtained. Scanning electron mi-crographs of cross and longitudinal sections of muscles from culled Saanen crossbred and Boer crossbred goats are presented in Figure 1. From this Figure, it could be seen that fibre diameter among samples were not much
different. Muscles structure of Saanen crossbred goat had thicker perimysium and endomysium compared to those of Boer crossbred goat, especially in leg peri-mysium. Moreover, smaller muscle fibre near the peri -mysium of meat from both breeds was obtained. At the same time, comparable sarcomere length in all samples were observed.
The results of sensory characteristics among goat meat samples were provided in Table 2. In triangle test, significant difference between breeds was found in raw leg, raw shoulder, and cooked leg samples, while no significance difference was obtained in cooked shoulder samples. In hedonic test, significant differences between breeds and muscle cuts were obtained for texture, taste, flavor, and overall acceptability. Moreover, texture and taste of leg meat from Saanen crossbred goat had the least acceptance level.
DISCUSSION
Higher protein contents obtained from Saanen samples related to the higher formation of collagen with the increasing age of the goat. The trend is similar with the result between dairy cattle (22.39%) vs beef cattle (20.85%) (Lizaso et al., 2011). It was noticed that
dairy breed reached earlier maturity than beef breed
(Wondifraw et al., 2013). Maturity level of animal breed
determines collagen properties. Earlier mature animals were characterized by the higher collagen deposition
(Jurie et al., 2007). Fat deposition between breeds is
more associated with different locations of fat deposite. Visually, fat deposition of Saanen carcass could be seen in the form of adipose tissue in some areas between muscles as energy reserver rather than in intramuscular fat in the muscle. The phenomenon of the importance of adipose tissue as energy reserver in dairy breed was
explained in Mishra et al. (2016).
Grain-concentrate feed provided for Saanen goat (2.5%/d) was higher than that of Boer goat (1.5%/day). In line with previous study, cattle finished on concen -trate (45.91%) presented a higher MUFA deposition compared to forage-finished (35.93%) (Duckett et al., 2013). Grain-concentrate either commercial or self-man -ufactured by farmers was unsaturated-rich components. Deposition of unsaturated-rich components in muscle was responsible for this phenomenon.
The phenomenon occurred in pH might be related to the glycogen concentration. Glucose as a source of energy stored as glycogen is mostly in skeletal muscle
(Ostrowska et al., 2015). Selected muscle in leg cut (biceps
femoris) plays more activity movement during daily life,
while selected muscle in shoulder cut (supraspinatus) at
-tached near the bond and thus less active during animal movement. More active muscle used more glycogen concentration during daily activity. Thus, this condition lead to a less remaining of glycogen in leg cut could be converted to lactate to decrease the pH.
older age and limited movement of Saanen goat makes a balance condition toward younger age and higher movement of Boer goats. This phenomenon is similar
with the age- (Kim et al., 2012) and activity-related fac
-tors (Huuskonen et al., 2010) implied from the results of
previous studies.
During heating, structure of collagen would be ini-tially denatured and shrinkaged particularly on its peri-Note: Means in the same rows with different superscripts differ significantly (P<0.05). ND= not detected.
Table 1. Nutritional composition and physicochemical characteristics of meat from culled Saanen crossbred and yearling Boer cross-bred goats
Parameter Saanen leg Saanen shoulder Boer leg Boer shoulder
Proximate
Moisture (%) 77.01±0.99 76.79±0.50 76.90±0.89 76.69±0.54
Protein (%) 20.19±0.89a 19.40±0.97ab 18.82±0.98ab 18.54±0.53c
Fat (%) 2.32±0.69b 2.70±0.21ab 2.63±0.44ab 3.22±0.43a
Ash (%) 1.05±0.01b 1.08±0.02ab 1.09±0.03a 1.10±0.02a
Collagen
Total collagen (mg/g) 5.96±1.72a 5.00±0.67ab 3.06±0.74c 3.90±0.45bc
Soluble collagen (%) 7.34±2.59b 11.36±4.92ab 13.51±2.53a 12.57±3.15ab
Fatty acid (% ratio)
C9:0 ND ND ND ND
C10:0 0.06±0.02 0.05±0.03 0.24±0.27 0.15±0.08
C11:0 ND ND ND ND
C12:0 0.20±0.08ab 0.23±0.08a 0.10±0.01c 0.13±0.00bc
C13:0 0.01±0.00 0.04±0.08 0.01±0.01 0.01±0.01
C14:0 2.59±0.45 2.73±0.44 2.10±0.31 2.43±0.32
C15:0 0.43±0.07 0.43±0.08 0.51±0.10 0.57±0.12
C16:0 24.94±1.86ab 26.26±1.12a 22.77±0.68bc 24.23±1.05c
C16:1 3.63±0.33a 3.30±0.72a 2.11±0.31b 1.70±0.91b
C17:0 1.06±0.20b 1.04±0.12b 1.51±0.24a 1.48±0.29a
C18:0 14.29±2.53b 14.44±1.99b 24.12±3.36a 23.83±3.34a
C18:1 46.84±1.78a 45.24±3.22ab 39.65±3.97b 40.80±4.69b
C18:2 4.83±1.41 5.34±2.68 4.52±0.48 2.84±2.00
C18:3 0.16±0.11b 0.23±0.02b 1.47±0.26a 1.22±0.17a
C20:0 0.09±0.02 0.04±0.06 0.04±0.08 0.07±0.27
C20:1 0.26±0.07a 0.26±0.06a 0.04±0.04b 0.04±0.04b
C22:0 ND ND ND ND
C22:1 ND ND ND ND
C24:0 0.40±0.27 0.30±0.37 0.46±0.47 0.32±0.28
C24:1 ND ND ND ND
SFA 44.11±1.77b 45.60±2.51b 52.01±4.74a 53.27±5.06a
MUFA 50.91±1.98a 48.83±3.88ab 42.01±4.56b 42.68±5.81b
PUFA 4.99±1.47a 5.57±2.69a 5.98±0.32a 4.05±2.04a
UFA 55.89±1.76a 54.40±2.53a 47.99±4.74b 46.74±5.07b
SFA/UFA 0.79±0.05b 0.84±0.08b 1.10±0.20a 1.16±0.23a
Physicochemical
pH 6.04±0.15a 5.76±0.08b 6.23±0.32a 5.86±0.14b
Myoglobin (mg/g) 11.30±1.83a 10.63±1.78a 9.90±1.11a 9.93±1.16a
Drip loss (%) 1.60±0.20b 2.21±0.60a 1.60±0.35b 1.53±0.15b
Cook loss (%) 38.75±1.03a 38.78±0.60a 35.87±1.62b 35.98±0.33b
Shear force 4.64±0.45a 4.34±0.37ab 3.83±0.46bc 3.50±0.38c
Lightness (L*) 33.12±0.96b 34.44±0.90b 39.85±1.16a 40.88±1.73a
Redness (a*) 16.71±1.10a 15.83±0.99ab 15.08±0.82ab 14.36±0.66b
Yellowness (b*) 12.18±1.22 11.93±0.51 10.36±2.75 10.82±2.33
Fibre diameter (mm) 32.51±3.07 33.30±4.47 30.23±1.50 31.67±2.96
Table 2. Sensory evaluation of meat from culled Saanen crossbred and yearling Boer crossbred goats
Note: Means in the same rows with different superscripts differ significantly (P<0.05)
Sensory evaluation
Triangle test Raw leg Raw shoulder Cooked leg Cooked shoulder
Significance P<0.05 P<0.05 P<0.05 P≥0.05
Hedonic test Boer leg Boer shoulder Saanen leg Saanen shoulder
Color 5.97±1.97 6.57±1.74 6.13±1.80 6.23±1.48
Texture 5.83±1.84ᵇ 6.93±1.72ᵃ 4.57±2.03c 6.13±1.66ab
Taste 5.67±1.81ᵇ 6.53±1.28ᵃ 5.00±1.97c 5.77±1.81ᵇ
Flavor 5.77±1.85ab 6.13±1.80ᵃ 5.00±2.23c 5.77±1.68ab
Overall acceptance 5.83±1.64bc 6.73±1.28ᵃ 5.27±1.82c 6.07±1.48ᵇ
Figure 1. Scanning electron micrographs of cross and longitudinal sections of leg and shoulder from culled Saanen crossbred and yearling Boer crossbred goats. Note: MF= muscle fibre, IMCT= intramuscular connective tissue, S= sarcomere, P= perimy -sium, E= endomysium. with x500 magnification in muscle fibre (MF) and intramuscular connective tissue (IMCT) micrographs was equivalent to 50 mm, with x100.000 magnification in sarcomere (S) micrograph was equivalent to 1 mm. Saanen leg-MF Saanen leg-IMCT Saanen leg-S
522
523
Saanen shoulder-MF Saanen shoulder-IMCT Saanen shoulder-S
524
525
Boer leg-MF Boer leg-IMCT Boer leg-S
526
527
Boer shoulder-MF Boer shoulder-IMCT Boer shoulder-S
528
529
530
531
532
533
534
535
536
537
P E
P E
P E
mysium and endomysium. Then, collagen solubilisation
gradually occurred (Chang et al., 2011). As a result, some
water progressively comes out from muscle fibre. Thus, a higher cook loss performed in Saanen goat might be related to its higher collagen content. It was also reliable that, to some degree, higher collagen percentage might be lowering myofibrillar protein percentage. Then, sample with less myofibrillar content was also going into limited ability to hold water.
A higher shear force found in Saanen goat meat was directly related to its collagen content. Besides, Saanen goat meat also had less soluble collagen percent-age than that of Boer goat meat particularly on leg part. This represented that Saanen leg had a higher cross link-ing collagen, which lead to tougher texture. In addition, thicker perimysium in Boer leg (Figure 1) supports this
phenomenon. A research reported by Ding et al. (2010)
also found a higher shear force in the meat from dairy goat compared to that of its crossing with Boer goats.
A slightly higher trend in fat of Saanen samples might lead to a significant effect on lightness (L*) as was also noticed in positive correlation of fatness-ligtness re-ported by Węglarz (2010). Other possible factor such as variation of oxidative stability of myoglobin (Adeyemi
et al., 2016) might be also reliable to elucidate the higher
difference in meat lightness.
Some muscle fibres in Saanen crossbred goat might be developed well and bigger as the effect of age, while some others had limited development resulted from less mobility and thus leading to a high variation of fibre di -ameter. At the same time, muscle fibre in the Boer cross -bred goat developed in a better way by less variation size due to a routine activity in a wider area (paddock).
As explained by Joo et al. (2013), total number and cross
section area of fibre were related with its contractile function and fibre type composition. In addition, muscle structure of Saanen goat meat had thicker perimysium and endomysium, especially in leg perimysium.
Result in triangle test reflected that panels could detect difference of meat between breeds in both raw leg and shoulder samples. In brief, texture of sample resulted more effect in triangle test. At the same time, difference in cooked leg samples between Boer cross -bred and Saanen cross-bred meat also detectable. Lower soluble collagen percentage in Saanen leg representing a higher collagen crosslinking as also found in bulls as
explained by Christensen et al. (2011). The more collagen
crosslinking caused less collagen solubilization. Thus, the structure still tougher than Boer shoulder after being cooked. Similar collagen percentage between shoulder cuts of both breeds resulted comparable cooked condi-tion. Less perimysium in meat of shoulder cut caused more heat energy to rupture meat structure during heating.
In hedonic score, texture and taste of leg meat from Saanen goat had the least acceptance level. This was due to the tougher texture intensity obtained from such sample. Besides, the higher trend of MUFA on leg meat might attribute to a more oxidation during cooking. The difference in fatty acid composition might be the most substantial factors to explain the triangle test result in leg cooked samples.
CONCLUSION
Meat from Saanen crossbred goat was healthier as related to its higher MUFA percentage. However, extra proper handling would be required since lipid oxida-tion was possibly prone to be oxidized in this sample. Tougher texture resulted in selected mucle in raw leg Saanen crossbred samples revealed the comparable occurrence after cooking as implied from the result in the triangle test. Shear force and fatty acids might contribute more impact to make a difference in sensory acceptance. Meat from selected muscles of shoulder cut of Saanen crossbred could be directly used to substitute Boer crossbred meat. However, the meat from selected muscles of leg cut of Saanen crossbred goat needed pre-treatment before being cooked to solve its textural and taste challenging.
ACKNOWLEDGEMENTS
This research was funded by Prince of Songkla University of Area Based Research Grant number AGR581130S-0. First author acknowledged the scholar -ship provided by the Ministry of Research, Science and Technology of the Republic of Indonesia.
REFERENCES
Adeyemi, K. D., R. M. Shittu, A. B. Sabow, M. Ebrahimi, & A.
Q. Sazili. 2016. Influence of diet and post-mortem ageing on oxidative stability of lipids, myoglobin and myofibrillar proteins and quality attributes of gluteus medius muscle in goats. PLoS ONE. 11:1-15. https://doi.org/10.1371/jour -nal.pone.0154603
Anothaisinthawee, S., K. Nomura, T. Oishi, & T. Amano. 2010. Goat genetic resources and breeding strategies in Thailand. J. Anim. Genet. 38:41-48. https://doi.org/10.5924/ abgri.38.41
Anothaisithawee, S., C. Wattanachant, K. Nomura, T. Oishi, &
T. Amano. 2012. Carcass and meat quality of three geno-type populations in goat breeding for meat purposes in Thailand. J. Agr. Sci. 57:63-70.
AOAC. 2000. Official Methods of Analysis of AOAC International. 17thed. Association of Official Analytical Chemists (AOAC) International, Maryland.
Bergman, I., & R. Loxley. 1963. Two improved simplified meth -ods for the spectrophotometric determination of hydroxy-proline. Anal. Chem. 35:1961-1965. https://doi.org/10.1021/ ac60205a053
Bligh, E. G., & W. J. Dyer. 1959. A rapid method of total lipid extraction and purification. Can. J. Biochem. Physiol. 37:911-917. https://doi.org/10.1139/o59-099
Chang, H., Q. Wang, X. Xu, C. Li, M. Huang, G. Zhou, & Y. Dai.
2011. Effect of heat-induced changes of connective tissue and collagen on meat texture properties of beef semiten-dinosus muscle. Int. J. Food Prop. 14:381-396. https://doi. org/10.1080/10942910903207728
Christensen, M., P. Ertbjerg, S. Failla, C. Sa-udo, R. I. Richardson, G. R. Nute, J. L. Olleta, B. Panea, P. Albertí,
M. Juárez, J.-F. Hocquette, & J. L. Williams. 2011. Relationship between collagen characteristics, lipid con-tent and raw and cooked texture of meat from young bulls of fifteen European breeds. Meat Sci. 87:61-65. https://doi. org/10.1016/j.meatsci.2010.09.003
70:2359-2367. https://doi.org/10.3382/ps.0702359
Ding, W., L. Kou, B. Cao, & Y. Wei. 2010. Meat quality param-eters of descendants by grading hybridization of Boer goat and Guanzhong dairy goat. Meat Sci. 84:323-328. https:// doi.org/10.1016/j.meatsci.2009.04.015
DLD. 2015. Statistic of Goat in Thailand Year 2014. Department of Livestock Development (DLD), Ministry of Agriculture, Thailand. http://ict.dld.go.th/th2/index.php/th/report/196- report-thailand-livestock/reportservey2557/700-report-survey57-1 [1May 1, 2015].
Duckett, S. K., J. P. S. Neel, R. M. Lewis, J. P. Fontenot, & W.
M. Clapham. 2013. Effects of forage species or concen -trate finishing on animal performance, carcass and meat quality. J. Anim. Sci. 91:1454-1467. https://doi.org/10.2527/ jas.2012-5914
Huuskonen, A., E. Joki-Tokola, M. Honkavaara, L. Tuomisto,
& R. Kauppinen. 2010. Meat quality and fatty acid profile of M. longissimus dorsi of growing bulls under insulated, uninsulated and outdoor housing conditions. Agric. Food Sci.19:214-222. https://doi.org/10.2137/145960610792912620 Jham, G. N., F. F. F. Teles, & L. G. Campos. 1982. Use of aque -ous HCl/MeOH as esterification reagent for analysis of fatty acids derived from soybean lipids. J. Am. Oil Chem. Soc. 59:132-133. https://doi.org/10.1007/BF02662261
Jittapalapong, S., S. Saengow, N. Pinyopanuwat, W. Chimnoi,
W. Khachaeram, & R. W. Stich. 2012. Gastrointestinal helminthic and protozoal infections of goats in Satun, Thailand. J. Trop. Med. Parasitol. 35:48-54.
Joo, S. T., G. D. Kim, Y. H. Hwang, & Y. C. Ryu. 2013. Control of fresh meat quality through manipulation of muscle fiber characteristics. Meat Sci. 95:828-836. https://doi. org/10.1016/j.meatsci.2013.04.044
Jurie, C., B. Picard, J. –F. Hocquette, E. Dransfield, D. Micol, &
A. Listrat. 2007. Muscle and meat quality characteristics of Holstein and Salers cull cows. Meat Sci. 77:459-466. https:// doi.org/10.1016/j.meatsci.2007.04.014
Kim, Y. H. B., A. Stuart, C. Black, & K. Rosenvold. 2012. Effect of lamb age and retail packaging types on the quality of long-term chilled lamb loins. Meat Sci. 90:962-966. https:// doi.org/10.1016/j.meatsci.2011.11.040
Krzywicki, K. 1982. The determination of haem pig -ments in meat. Meat Sci. 7:29-36. https://doi. org/10.1016/0309-1740(82)90095-X
Liu, A., T. Nishimura, & K. Takahashi. 1996. Relationship be -tween structural properties of intramuscular connective tis-sue and toughness of various chicken skeletal muscles. Meat Sci. 43:43-49. https://doi.org/10.1016/0309-1740(95)00065-8
Lizaso, G., M. J. Beriain, A. Horcada, J. Chasco, & A. Purroy.
2011. Effect of intended purpose (dairy/beef production) on beef quality. Can. J. Anim. Sci. 91:97-102. https://doi. org/10.4141/CJAS10078
Meilgaard, M., G. V. Civille, & B. T. Carr. 2016. Sensory Evaluation Techniques. 5th ed. CRC Press, Florida.
Mioč, B., V. Pavić, Z. Barać, Z. Prpić, & I. Vnučec. 2007. Milk yield of some goat breeds in Croatia. Mljekarstvo. 57:67-77.
Mioč, B., Z. Prpić, I. Vnučec, Z. Barać, V. Sušić, D. Samaržija, & V. Pavić. 2008. Factors affecting goat milk yield and composition. Mljekarstvo. 58:305-313.
Mishra, S., K. Kumari, & A. Dubey. 2016. Body condition of dairy cattle: A review. RRJVS. 2:58-65.
National Bureau of Agricultural Commodity and Food Standards of Thailand. 2007. Halal Food (TAS 8400-2007). National Bureau of Agricultural Commodity and Food Standards, Ministry of Agriculture and Cooperatives, Bangkok, Thailand.
National Bureau of Agricultural Commodity and Food Standards of Thailand. 2013. Good Manufacturing Practices for Goat and Sheep Abattoir (TAS 9040-2013). National Bureau of Agricultural Commodity and Food Standards, Ministry of Agriculture and Cooperatives, Bangkok, Thailand.
Ostrowska, M., J. Jarczak, & L. Zwierzchowski. 2015. Glucose transporters in cattle – A review. Anim. Sci. Pap Rep. 33:191-212.
Palka, K. 1999. Changes in intramuscular connective tissue and collagen solubility of bovine m. semitendinosus during retorting. Meat Sci. 53:189-194. https://doi.org/10.1016/ S0309-1740(99)00047-9
Palka, K., & H. Daun. 1999. Changes in texture, cooking loss -es, and myofibrillar structure of bovine m. semitendi -nosus during heating. Meat Sci. 51:237-243. https://doi. org/10.1016/S0309-1740(98)00119-3
Seilsuth, S., J. H. Seo, H. S. Kong, & G. J. Jeon. 2016. Microsatellite analysis of the genetic diversity and popula-tion structure in dairy goats in Thailand. Asian Australas. J. Anim. Sci. 29:327-332. https://doi.org/10.5713/ajas.15.0270 Suman, S. P., & P. Joseph. 2013. Myoglobin chemistry and
meat color. Annu. Rev. Food Sci. Tech. 4:79-99. https://doi. org/10.1146/annurev-food-030212-182623
Suman, S. P., P. Joseph, S. Li, L. Steinke, & M. Fontaine. 2009. Primary structure of goat myoglobin. Meat Sci. 82:456-460. https://doi.org/10.1016/j.meatsci.2009.02.017
Supakorn, C., W. Pralomkarn, & S. Tumwason. 2011. Estimation of additive, non additive gene effects and ge -netic parameters on pre-weaning growth traits in meat goats in southern Thailand. Walailak J. Sci. & Tech. 8:41-50. Wasiksiri, S., S. Sripongpun, A. Ratanaphan, & P.
Sookras. 2013. Survey to determine the presence of the N-acetylglucosamine-6-sulfatase (G6S) gene mutation in Anglo-Nubian goats in Southern Thailand. Thai J. Vet. Med. 43:99-103.
Wattanachant, S., S. Benjakul, & D. A. Ledward. 2004. Composition, color, and texture of Thai indigenous and broiler chicken muscles. Poult. Sci. 83:123-128. https://doi. org/10.1093/ps/83.1.123
Wattanachant, S., S. Benjakul, & D. A. Ledward. 2005. Effect of heat treatment on changes in texture, structure and prop-erties of Thai indigenous chicken muscle. Food Chem. 93:337-348. https://doi.org/10.1016/j.foodchem.2004.09.032
Węglarz, A. 2010. Meat quality defined based on pH and colour depending on cattle category and slaughter season. Czech J. Anim. Sci. 55:548-556.