SYSTEM ANALYSIS TO PROVIDE THE
ACHIEVEMENT OF TWO MILLION TONS
SURPLUS OF RICE PRODUCTION THROUGH 2014
IN NUSA TENGGARA BARAT
I Putu Cakra Adnyana
1*and M. Nazam
11
Assesment Inovation of Agriculture Technology West Nusa Tenggara
*corresponding author: [email protected]
ABSTRACT: Until now, rice is still the staple food for more than 95% of NTB people and has high sensitivity towards political, economic and social issue. Challenge that faced in this food supply is lesser land area, both its wide and quality due to continuous conversion of agricultural land to non-agricultural use. Rice supply system is a complex system because it involves multiple sectors and covers many aspects. To solve the problem, it is required more comprehensive and holistic approach. This study aims to analyze rice supply system to the achievement of 2 million tons surplus of rice production through 2014 in NTB. Data in this research was collected by survey, FGD, consultation, observation and desk study. Analysis in this research used dynamic system. The result showed that rice self-sufficiency could be achieved if it is accompanied by assessment to increase rice productivity and supporting policy where there will be no expansion and no conversion of wetland or paddy field area at NTB in 2014. The government should immediately establish the policy to introduce new rice varieties, which potentially can yield 8 tons rice/ha, 5% grain loss and 2.5% rice loss through harvest tools and post harvest process. It should also be accompanied by IP (cropping index) score increase to 1.94 per year through 30% irrigation improvement and balanced fertilization. Rice crop should be improved by 1.146, 75% balanced fertilization, 75% seeds quality improvement and 75% decrease of pests and plant diseases. In addition, the government is necessary to establish regulations which governing responsibility between government, private sector and farmer in order to achieve IDR 208 billions budget in 2014.
Keywords: rice, production, consumption, model, surplus
INTRODUCTION
Until now, rice still represents as staple food for more than 95% NTB people and has high sensitivity towards political, social and economic aspect. Sufficient food availability includes into human right, which must always be guaranteed by the state. (FAO, 1998; Byron, 1988). It is also mentioned in the Act (UU) No.7 Year of 1996 about Food and Government Regulation (PP) No. 68 Year of 2002 about Food Security.
Challenges come in order to achieve rice surplus such as lack of farm resources, both quantity and quality, and the increasing of land conflict (Pasandaran, 2006). The conversion of
agricultural land into non-agricultural use exacerbated the lack of agricultural land.
More than 90% rice production produced from lowland irrigation. However, it is empirically more vulnerable than wetland rice conversion (Iqbal and Sumaryanto, 2007). Population growth, more income and rapid development lead to the more complex land problem. Land is very important as major factor in food production process. In the other hand, land also required for housing, industries and other supporting infrastructures. Conversion is ongoing and getting difficult to control.
the complex problem, it is required more comprehensive and holistic approach. The best approach is dynamic system approach.
Dynamic system approach is an approach to conduct analysis using characteristic system as its starting point (Marimin , 2004) . According to Eriyatno (1999) dynamic system is always looking for any integration among many aspects through an understanding. Thus, we need a new framework known as dynamic systems approach. A dynamic system approach is kind of problem solving which started with need assessment and able to provide basis for broader understanding to the factors that affect system behavior. It also provides an understanding to the multiple problem causes within system framework. Thus, it can produce an effective operating system.
So, it is very important to know dominant factor (key factor) that most affected the provision system and rice consumption in NTB. The identification result of key factor can be used to create model and strategy that can be implemented to the system. Therefore, comprehensive and holistic analysis to the problem of provision system and rice consumption is necessary.
The aim of this research was to create model and strategy to achieve 2 million tons surplus of rice production through 2014 in NTB. The research output was model and strategy to achieve 2 million tons surplus of rice production through 2014 in NTB.
RESEARCH METHOD
The research was conducted from January to December 2013 in NTB Province. This study was macro study on aggregation of NTB. According to Simatupang (2007), related to the purpose of policy analysis, food security can be assessed at aggregation level: household and regional (local, provincial, and national) level.
Data in this research was primary and secondary data. Primary data was collected by survey techniques through in-depth interview using list of questions. Primary data collection was conducted to wetland and dryland rice farming. Location and respondent determination was conducted by multi-stages stratified random sampling method.
Secondary data was collected trough desk study from BPS, Department/Institution, BMKG, Universities, Research Institutes and scientific
publications, such as books, journals, dissertations, and research reports.
Data Analysis
The first stage was input - output analysis to the income of wetland and dryland rice farming and to determine rice farming conformity to the various land typologies using certain formula (Downey and Erickson, 1985).
The second stage was production capacity and paddy demand analysis using descriptive method. Production capacity was affected by wetland rice area, dryland rice area, rice productivity and rice cropping index (IP) (IAARD, 2005a). Rice demand was influenced by number of population, rice consumption per capita per year, need of agro-industries, government rice stock, seeds, export, import and transfer. Mathematically, food self-sufficiency measurement performed using certain calculation of powersim 2.5d programme Rachman et al. (2004).
The third stage was model and strategy preparation to achieve 2 million tons surplus of rice production through 2014. It was performed with dynamic system approach. Dynamic systems approach is an approach to conduct analysis using characteristic system as starting point of analysis (Marimin, 2004).
In principle, this system methodology, according to Marimin (2004), conducted through six analysis stages, namely: requirement analysis, system identification, problem formulation, establishment of alternative system, termination from physical, social, and political realization, and economic and financial determination. According to Manetch and Park (1977) in Hartrisari (2007), stages of dynamic system approach starts from need assessment, problem formulation, system identification, modeling, verification and validation, and system implementation.
value closer to zero then the model is not bias or it can be said as consistent (simulated value neither above nor below the actual data value).
Criteria that used to assess sensitivity performance in this study followed criteria as proposed by Maani and Cavana (2000), in which parameter stated as sensitive when parameter changed by 10% and the impact on the system performance reaches 5-14%, as very sensitive ranging from 15-34% and highly sensitive when the impact is greater than 35%. Parameter which has high sensitivity is an important parameter that can be used in policy determination of policy. In the simulation model of this research, parameter was sensitive type that could achieve the goal in certain time period.
RESULT AND DISCUSSION
Initial value of empirical data (Staus Quo/Model 0) to the variable that used as the conditions in 2002 or in accordance with data availability as follow:
1. Wetland rice area = 214,910 ha , dryland rice area = 36,215 ha
2. Land conversion :
a. Rate of wetland rice conversion was 1.9 % year-1
b. Rate of wetland rice extensification was 3.57 % year-1
Based on data above, rate of wetland rice extensification in NTB still greater than conversion rate of 1.67 % year-1 or 9.359 ha year-1
3. Rice farming technology
a. Productivity and IP (cropping index) score of lowland rice farming were 4.673 tons ha-1 year-1. Rate of productivity and IP score was 1.02 % year-1 and 2 % year-1 respectively. It was based on performance of rice farming technology in implementation period of 2002-2012
b. Dryland rice farming, b.1.
Productivity was 2.38 tons ha-1 year-1, b.2. Rate of productivity was 5.14 % year-1 (conditions in 2002-2012), b.3. Rate of cropping index (IP) score was 1 % year-1
b. The average of rendement was 56.22% c. The use of seeds in wetland rice area was 50 kg ha-1 and dryland rice area was 70 kg ha-1
4. Population growth
a. Total population was 3,929,774 people ( 2002 )
b. Birth rate was 2.16 % year-1 and mortality rate was 0.73 year-1
c. Immigration rate 0.08 % and
Emigration rate 0.34 % 5. Rice Consumption
a. Consumption per capita was 131 kg per year in 2007 ,
b. Rate of rice consumption per capita was 2.6 % year -1. Based on the research result, income elasticity of rice consumption was still positive (Irawan 2005 ).
b. Total rice stock was 198,300 tons (2009 ), with incoming transfer rate -6.9% per year and outgoing transfer rate 0.7 % year-1
6. Rice grain price was assumed to have no effect on the increase of production. It was consistent with the finding that the increase of rice grain price was not accompanied by effort to increase production by farmers for any reason such as: (1) rice farming was seasonal and (2) farmer’s paddy field area was relatively small.
7. In 2008, the number of domestic and foreign travelers who visit NTB was 544,501 people with rice consumption rate 300 gr / day/ person and the average of visit period was 2.48 days / person.
8. Rice demand at agro-industry sector in 2009 was 16.251 tons with rate of 1% per year
9. Rice losses was 2.5% and grain losses was 7%
10. Rate of harvest failure was 18% per year because of drought and flooding (BPS). 11. Wetland area other than paddy field was
56981 ha in 2002 (BPS processed data). The rate of wetland area used other than paddy field was 1% per year
12. Irrigation was only 64% (not good) 13. Provision of extension workers was only
80% from total number of villages.
14. The use of balanced fertilization was 67.73% of total planting area
15. The use of qualified seeds was 40.00% from total planting area
16. The effect of pest and plant disease to the productivity was 4% which covered 50% of total planting area
17. Land extensification cost IDR
The number of village in NTB was 1146 villages (CBS, 2013).
18. Fertilizer price (DG PSP, 2012)
a. Urea = IDR 1.800/kg with
recommendation of use 100 kg / ha
b. NPK = IDR 2.300/kg with
recommendation of use 300 kg / ha
c. SP36 = IDR 2.000/kg with
recommendation of use of 200 kg / ha
d. ZA = IDR 1.400/kg with
recommendation of use 75 kg / ha 19. Irrigation repair or improvement cost was
IDR 1.000.000/ha (Directorate PSP, 2012). 20. Farm equipment cost was IDR 34 million
per village.
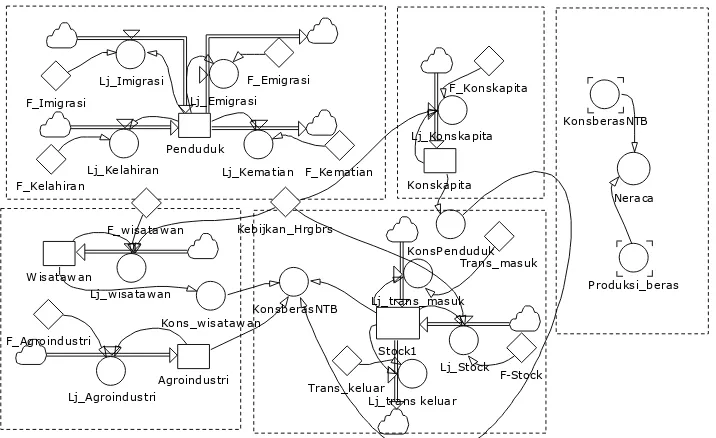
Model Simulation Diagram
Flowchart simulation to the rice availability in NTB presented in Figure 1 and 2. Flowchart is causal translation diagram, which can be simulated with Powersim software based on data quantification. Flowchart simulation consists of three parts: aspects related to rice production (part A), rice consumption (part B) and rice balance (part C). This simulation was carried out to the next 10 years period starting from 2002.
Model Validation Simulation
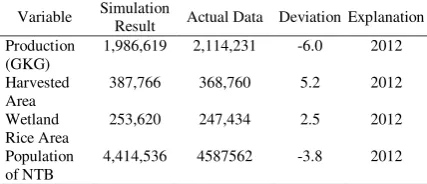
Simulation trial was conducted to determine model accuracy and validity by computing data in the period of 2002 - 2012 to predict the condition in 2012. The result of simulation trial is presented in Table 1.
Based on the result, there was relative small deviation between simulation and actual data and obtained MAPE score <10%, means that the models was appropriate (accurate).
Table 1. The result of simulation trials
Efforts to achieve rice self-sufficiency
One very realistic thing related to the rice self-sufficiency in NTB was ability of domestic production. Various measurements could be taken in order to consider it carefully. In addition to production needs, policy that ruled about wetland should be established, productivity and IP score should be increased, efficient post-harvest management should be made, wetland rice area should be expanded and disaster mitigation and pest disease problems shlud be solved.
In term of consumption, policy about food source diversification should be established,
people’s income should be increased and family
planning programme should be implemented continuously. Related to the efforts of rice self-sufficiency, domestic rice availability simulations was performed with the reference wetland perennial policy, the increasing of rice productivity and wetland expansion as the following criteria:
Model one referred to the policy of rice productivity improvement, policy of wetland expnsion in NTB and wetland conversion rate as in 2002-2014. This model could be interpreted as follows:
1. Rice productivity 51.53 kw/ha to 78.23 kw/ha in 2014
2. Wetland extensification in NTB 4,800 ha in 2014.
3. Rate of wetland conversion 1% per year or 2,450 ha in 2014
4. 10% grain loss
5. Rate of wetland use other than paddy field -1%
6. Relative impact to the productivity determinant, such as cost of:
a. Seeds = 5% which could reach up to 25% (Nurasa, et al,. All, 2009) b. Fertilizer = 10% (Darwanto, 1993)
which could reach up to 10% (Darwanto, 1993)
c. Land extension = 6.6% which could reach up to 16.6% (Saridewi, et al., All, 2010)
d. Pests and diseases = -1% which could reach up to -4% (Darwanto, 1993) 7. Effect to the other things was constant.
Variable Simulation
Result Actual Data Deviation Explanation Production
(GKG)
1,986,619 2,114,231 -6.0 2012
Harvested Area
387,766 368,760 5.2 2012
Wetland Rice Area
253,620 247,434 2.5 2012
Population of NTB
Figure 1. Flowchart of rice consumption and balance in NTB
Figure 2. Flowchart of Rice Production and Rice Cost in NTB
F_Agroindustri Ba kuSw hpdi iriga si
ba ik
kove rsi_ga ba h_ke _ be ra s
Pe rba ika n_ja r_iriga si Ja r_iriga si_kura ng
be rfungsi Tota l_by_pe rba ika n
_Ja r_iriga si tota l_bia ya _pe rta ni
a n
Ala t_pe rta nia n By_tra ktor&Re a pe r
Model two referred to the policy of rice productivity improvement and policy of perennial wetland (no expansion and no conversion of wetland area in NTB through 2014) with the condition in 2002-2014 as follows:
1. Rice productivity 51.53 kw / ha to 62.43 kw / ha in 2014
2. Rate of rice productivity improvement referred to the situation in 2002-2012 was 1.02 % per year and rate of IP score increasing was 1.1 % per year
3. No expansion of wetland area through 2014.
4. No conversion of wetland area through 2014
5. The effect of pest and plant disease decreased from 4 % to 1 % against rice productivity
6. 5 % grain loss
7. Rate of wetland use other than paddy field -1% per year
8. Irrigation improvement was 30% against wetland rice area
9. Relative impact to the productivity determinant, such as cost of:
a. Seeds = 5% which could reach up to 25% (Nurasa, etal., All, 2009) b. Fertilizer = 10% which could reach up
to 10% (Darwanto, 1993)
c. Land extension = 6.6% which could reach up to 16.6% (Saridewi, et al., All, 2010)
d. Pests and diseases = -1% which could reach up to -4% (Darwanto, 1993) 10. Effect to the other things was constant.
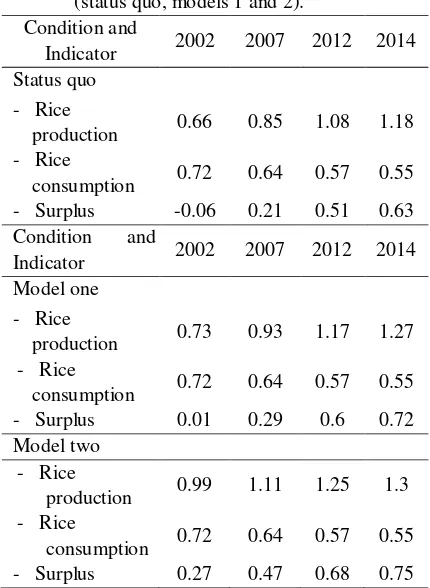
The simulation resulted in three models including initial conditions (status quo) which presented in Table 2. Model of Status Quo suggested that 2 million tons surplus of rice production could be achieved in 2011 until 2014. However, for long term condition (15-30 years later), it might cannot be achieved due to limited agriculture land, conversion of agricultural land to non-agricultural land, the increasing of rice consumption as with population growth in NTB. Thus, it needed new policy as alternative solution that given by models 1 and 2.
Model one showed that rice self-sufficiency could be achieved if it is accompanied by efforts to increase rice productivity, policy that ruled wetland area expansion for 4,800 ha in NTB 2014 and rate of wetland conversion for 1% per
year. Wetland area expansion covered an area of 4,800 ha in 2014 and total investment cost about IDR 120 billion year - 1. Thus, this expansion should be reduced for commodity or agricultural land. Moreover, there should be rice productivity improvement through new rice varieties, for example, Inpari variety that developed by ICRR (has high production potential). The average production of inpari variety reaches up to 8.3 tons per ha. Inpari rice variety also has high rendement for 70%, or 7 % higher than other rice varieties. The increasing of rice productivity could be conducted through extension agent mentoring, proper fertilization, and pest control. The investment for seeds, fertilizer, pest control, education and agricultural implementation reached IDR 670 billions.
Table 2. Initial condition and simulation result of rice balance (million tons) and availability at NTB in 2002 to 2012 (status quo, models 1 and 2).
Condition and
Indicator 2002 2007 2012 2014
Status quo - Rice
production 0.66 0.85 1.08 1.18
- Rice
consumption 0.72 0.64 0.57 0.55
- Surplus -0.06 0.21 0.51 0.63
Condition and
Indicator 2002 2007 2012 2014
Model one - Rice
production 0.73 0.93 1.17 1.27
- Rice
consumption 0.72 0.64 0.57 0.55
- Surplus 0.01 0.29 0.6 0.72
Model two - Rice
production 0.99 1.11 1.25 1.3
- Rice
consumption 0.72 0.64 0.57 0.55
- Surplus 0.27 0.47 0.68 0.75
conducted through the introduction of new rice varieties, extension agent mentoring, proper fertilization, and pest and plant disease control as with model 1. Budget allocation that needed in 2013 was IDR 207 billions, while in 2014 reached IDR 208 billion. Unfortunately, due to limited funds in NTB, the available budget in 2013 was only 7.1 million dollars. Thus, in 2014, the government required new regulation or
presidential decree which governing
responsibility between central government, private sector, farmer and local government.
CONCLUSION AND SUGGESTION
The result showed that rice self-sufficiency could be achieved if it is accompanied by assessment to increase rice productivity and perennial wetland policy of, where there will be no expansion and no conversion of wetland area in NTB through 2014. The government should immediately establish policy to introduce new rice variety, which has high yield potential of 8tons/ha, 5% grain loss and 2.5% rice loss due to harvest process. IP score should be increased to be 1.94 per year by improving irrigation area for 30% and balanced fertilization. Rice crop should be improved by 1.146, 75% balanced fertilization, 75% seeds quality improvement and 75% decrease of pests and plant diseases. In addition, the government is necessary to establish regulations which governing responsibility between government, private sector and farmer
in order to achieve IDR 208 billion budget in 2014.
REFERENCES
IAARD. (2005a). Prospek dan Arah
Pengembangan Agribisnis Padi.
Indonesian Agency for Agricultural research and development (IAARD). Jakarta.
Byron, W. J. (1988). On the Protection and Promotion of the Right to Food: An Ethical Reflection. In B.W.J. LeMay (eds.), Sience, Ethics, and Food.
Smithsonian Institution Press,
Washington, D.C. and International Rice Research Institute, Manila, p.14-30 Downey, W. D. dan S. P. Erickson. (1985).
Manajemen Agribisnis. Dialih-bahasakan oleh Rochidayat, Gonda S. dan Alfonsus. Penerbit Erlangga. Jakarta. 516 p.
Eriyatno. (2003). Ilmu Sistem: Meningkatkan Mutu dan Efektivitas Manajemen. Jilid Satu IPB Press. Bogor.147 hal.
Hartrisari. (2007). Sistem Dinamik. Konsep Sistem dan Pemodelan untuk Industri dan
Lingkungan. SEAMEO BIOTROP.
Bogor.
Irawan. (2005). Analisis Ketersediaan Beras
Nasional: Suatu Kajian Simulasi