T he application
of T QM in a
hospital
57
The application of TQM in a
hospital’s casualty and
pathology departments
Rajiv Kohli
Holy Cross Health System, South Bend, Indiana, USA ,
Barbara Kerns
St Joseph Medical Center, Towson, Maryland, USA , and
Guisseppi A . Forgionne
University of Maryland Baltimore County, Catonsville, Maryland, USA
Introduction
To be successful in the long term, an organization must produce quality goods o r serv ices. Quality is the value of goods o r serv ice as perceived by the customer. In recognition of these realities, good managers will establish a set of quality management principles that focuses on customer satisfaction and continuous improvement in the organization’s processes. T his set of principles is known as total quality management (T QM)[1].
A lthough the details may vary, the same T QM principles and concepts can be, and have been, successfully applied across enterprise types[2]. Generally, manufacturing enterprises have been leaders in T QM applications, and service firms have rapidly followed this lead. A n exception has been the health-care organization[3].
In health care, quality monitoring has focused on individual performance and decision making. Historically, quality assurance methodologies embellished the theory of the “bad apple” or of finding the individual with a pattern of less than optimal care outcomes. In recent years, the cost of health care has become a major concern, and competition surfaced as a significant factor for health-care providers. T hese providers began to realize that customer (patient, family, physician, insurer and employee) satisfaction would be a major determinant for survival in the newly competitive marketplace. T he health-care industry began to examine T QM and the success stories of the manufacturing and service industries.
A lthough T QM may be in various stages of implementation throughout health care, the entire industry has embraced the concept. In addition, the Joint
International Journal of Quality & Reliability Management, Vol. 12 No. 9, 1995, pp. 57-75, © MCB University Press, 0265-671X T he authors wish to thank the entire T QM committee, especially Ken Walsch, for sharing with us
IJQRM
12,9
58
Commission on A ccreditation of Healthcare Organizations (JCA HO) has been progressively incorporating T QM into the accreditation process. Because of the market and accreditation pressures, hospitals are attempting to implement T QM philosophies and concepts. A n A merican Hospital A ssociation (A HA ) study, for example, showed that 44 per cent of the surveyed hospitals use T QM to improve performance[4].
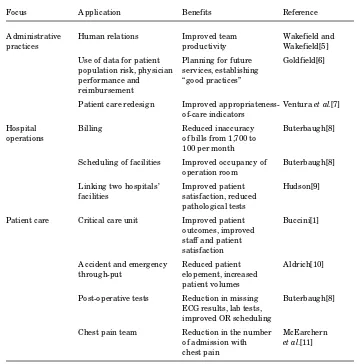
A s Table I illustrates, all hospital T QM applications seek ways to lower costs and improve care. Some focus on improving administrative practices. Others concentrate on enhancing hospital operations. A dditional applications demonstrate the use of T QM in ameliorating direct patient care processes (see[1,5-11]).
One area in which T QM has not been applied ex tensively is in the co-ordination of accident and emergency room (A E), i.e. casualty and pathology
Table I.
T QM applications in health care
Focus Application Benefits Reference
A dministrative Human relations Improved team Wakefield and
practices productivity Wakefield[5]
Use of data for patient Planning for future Goldfield[6] population risk, physician services, establishing
performance and “good practices” reimbursement
Patient care redesign Improved appropriateness- Ventura et al.[7] of-care indicators
Hospital Billing Reduced inaccuracy Buterbaugh[8]
operations of bills from 1,700 to
100 per month
Scheduling of facilities Improved occupancy of Buterbaugh[8] operation room
Linking two hospitals’ Improved patient Hudson[9] facilities satisfaction, reduced
pathological tests
Patient care Critical care unit Improved patient Buccini[1] outcomes, improved
staff and patient satisfaction
A ccident and emergency Reduced patient A ldrich[10] through-put elopement, increased
patient volumes
Post-operative tests Reduction in missing Buterbaugh[8] ECG results, lab tests,
improved OR scheduling
T he application
of T QM in a
hospital
59
operations. T his co-ordination is important for several reasons. Patholog y turnaround time significantly affects A E care, attending staff satisfaction, and the patient’s perception of quality. Improving this turnaround time can provide the hospital with an advantage over the competition. Since the accident and emergency room accounts for a sizeable portion of hospital admissions, such an advantage can have a substantial impact on financial performance.
Several studies have been conducted to review the quality of patholog y labo rato ry perfo rmance throug h increased turn around time (TAT ) in hospitals[12-14]. T he College of A merican Pathology (CA P) publication CA P
Today observes that a laboratory should be able to provide 90 per cent of tests
ordered by A E within 45 minutes of the order. However, only 30 per cent of the hospitals participating in the studies were able to meet this goal. Ringel[15] indicates that doctors expect the TAT to be below 30 minutes which can be achieved by optimizing every possible method and pathway.
T his article explains how T QM can be used to facilitate the co-ordination and optimization of hospital’s A E department and pathology laboratory operations to improve TAT, and thus patient serv ice. A case study involv ing these operations at a medium-sized, regional hospital is used to illustrate and validate the concepts. T he article first overviews the case and the objective of the study. It then describes the flow of the A E laboratory process. Next, it describes how T QM was used to improve the co-ordination of the hospital’s A E and pathology operations. T he article then presents the benefits and lessons learned from the T QM application and the implications for hospital management.
Overview of the case
T he T QM study was conducted at a 460-bed multi-specialty facility in a metro-politan suburban area. T he hospital’s A E accounts for approximately 40 per cent of the annual 20,000 in-patient admissions. T herefore, the efficient functioning of the A E is critical to the hospital’s performance. For a number of years, the casualty department had been requesting faster turnaround time from the supporting pathology laboratory.
Goal of the T QM study
T he goal of the T QM study was to reduce the TAT of the Stat lab tests, currently 60 minutes from the time they are ordered. Specifically, the goal was to reduce the TAT to 30 minutes. A dministrators believed that the improved TAT would place the casualty department in a competitive position with other area casualty departments. A s part of the T QM effort, the team was required to document the patient and specimen flows and collect data of the time it took at various points in the process.
Patient and specimen flows
IJQRM
12,9
60
assesses the patient’s condition. If immediate care is needed, the patient is taken in for treatment; otherwise, the patient is diverted to registration.
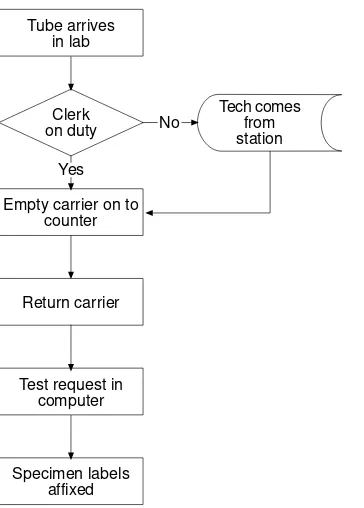
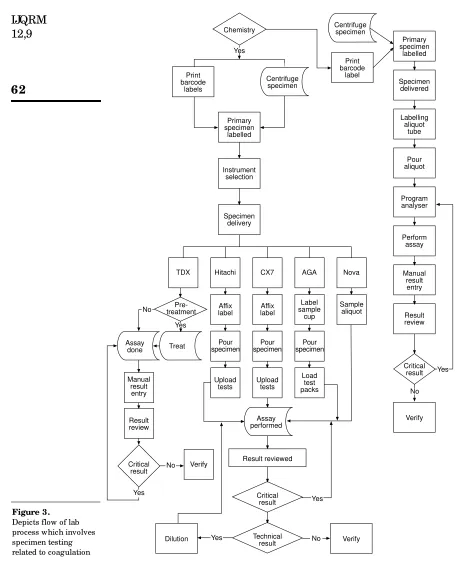
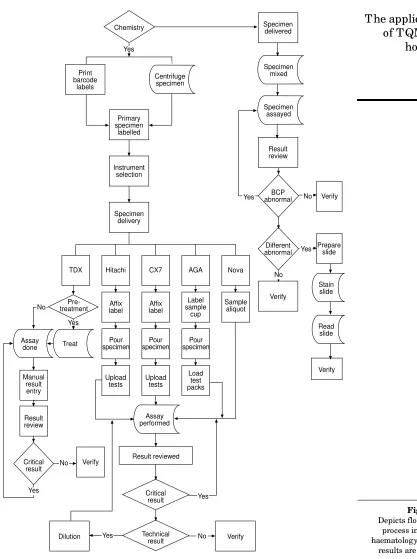
Diagnosis and treatment for almost all AE patients require pathological tests. A fter receiving the patient, the A E sends specimen (blood, urine and other) samples to pathological laboratories (a regular lab and often a Stat lab for urgent cases). The flow of specimens within the laboratory is shown in Figures 2-4.
Figures 2-4 document the sequence of tasks for management study and policy improvement. T hey also identify the activities that must be co-ordinated with A E operations. T he patient flow described in this article is typical of most hospitals.
A ctivity co-ordination
Diagnosis and treatment cannot be initiated until laboratory test results are received. To reduce TAT, then, administrato rs must improve the flow of
Patient signs in
Patient to triage
Expected care
Triage RN draws blood
Triage RN completes lab slip
Tube system open
Specimen sent
Registration madePlate Waiting
room Treatmentroom
RN protocol
RN tech draws blood
Lab slip completed
Tube system
open
Specimen sent
Wait for MD
MD completes
H&P
Orders written
RN takes order Chart in rack
RN tech takes blood into lab Blood sits on counter
No No
No
No
Yes Yes
Yes Yes
Patient arrives
Figure 1.
T he application
of T QM in a
hospital
61
specimen samples and info rmation between the casualty and patholog y departments. It is apparent from Figures 1-4 that such improvement will require the effective co-ordination of a number of activities. A delay at any step will hamper the entire process.
Some staff members made informal suggestions to improve the flow of specimen samples between the A E and pathology departments. T hese suggest-ions, however, were non-comprehensive in nature, and they had a minor impact on the turnaround time.
TQM solution
T he senior management recognized the need for a systematic analysis of the operational links between the casualty department and Stat lab. Taking action, the management authorized the vice-president on clinical information/risk management to constitute a T QM team that would develop ways to improve the co-ordination of A E and Stat lab operations using the principles of T QM and continuous quality improvement (CQI). T he objective of the effort was to achieve an industry-competitive pathology TAT.
T QM team
T he T QM g roup, called the Casualty Department/Laboratory Continuous Quality Improvement Team, was the first official T QM/CQI assembly within the hospital. It was led by the chief of medicine (an MD) who was familiar with
Tech comes from station Tube arrives
in lab
Clerk on duty
Empty carrier on to counter
Return carrier
Test request in computer
Specimen labels affixed
Yes
No
IJQRM
12,9
62
Primary specimen labelled Specimen delivered Labelling aliquot tube Pour aliquot Program analyser Perform assay Manual result entry Result review Critical result Verify Centrifuge specimen Print barcode label Nova AGA CX7 Hitachi TDX Sample aliquot Label sample cup Affix label Pour specimen Load test packs Upload tests Affix label Pourspecimen specimenPour
T he application
of T QM in a
IJQRM
12,9
64
the workings of the hospital, and it consisted of personnel from casualty, laboratory, quality assurance, and hospital information systems departments.
Casualty. Casualty personnel involved one docto r, two nurses, and one
administrative staff. T he doctor was the head of emergency medicine while the nurses were the head A E nurse and a staff nurse. A dministrative staff was a representative from the registration department.
Laboratory. Laboratory personnel comprised two doctors, two administrators,
and a technician. T he doctors were the head of pathology and one additional pathologist, while the technician was a lab worker. T he administrators were the director and the technical director of the medical laboratory.
Quality assurance and hospital information systems. Quality assurance
personnel consisted of the manager of quality assurance, w ho w as the facilitator of the T QM team, and an RN representative, who was the scribe for the team. T he hospital information systems department’s member was a systems analyst.
Team agenda
Initially, the team underwent a rapid orientation to T QM/CQI. T he goals of the team were outlined, issues were identified, and actions were taken to resolve these issues.
Goals and issues. T he team acknowledged that the customer was the A E
patient. It also agreed on an objective of reducing turnaround time for Stat lab results. A fter studying the patient and specimen flows in detail, the team consensus was that data collection and staff resistance presented major barriers for the project.
Existing hospital information systems did not contain the data needed to implement T QM/CQI successfully. Since there w as no w ay to collect the essential information from these systems, manual data collection was required. T he team decided that sampling through observation was the best method to collect the necessary data.
Issue resolution. T he casualty and laboratory team members identified the
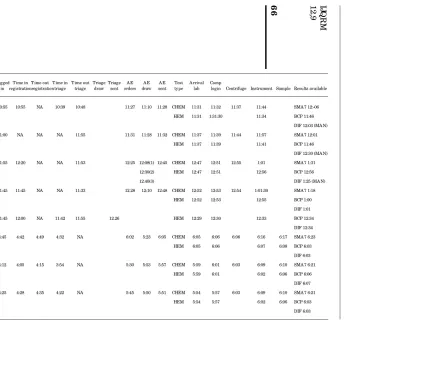
factors that can cause variations in A E and Stat lab work volumes. Virtually all were time-based (day of the week, hour of the day, shift, breaks and so on). A sample was designed to collect representative work condition data[16]. In the design, the team facilitator and a nurse observed patient and specimen flows over three whole (eight-hour) shifts on sampled hours of the day, including breaks, for three different days of the week. Collected data were recorded on worksheets such as the document shown in the Appendix.
T he worksheet collected the data in a form that was suitable for statistical analysis. It also provided the supporting detail that would be useful to explain the analytical results. Moreover, the document served as a store of the collected data.
T he application
of T QM in a
hospital
65
explained that the focus of the project was on the patient and specimen flows and not on any employee’s individual performance. A E and Stat lab staff were assured that the T QM implementation would not threaten their jobs o r advancement prospects. T hese staff were requested to work at their normal pace during the observation period.
Data analyses
Raw data from the worksheets were accumulated and the composite was recorded in tabular form. Table II illustrates a portion of a composite table. T he fig ure focuses on the suppo rting detail for justification and ex planato ry summary repo rts; and prov ides the data for the g raphic representations included in the summary reports for management.
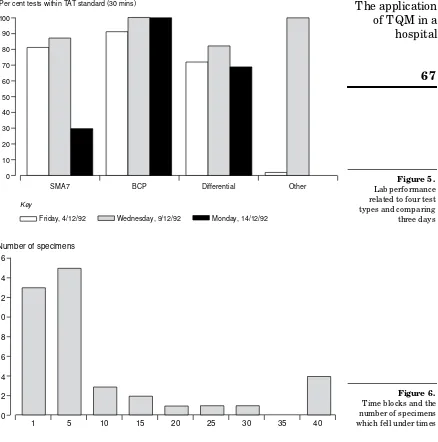
Data were compiled for three specific tests – SMA 7, BCP and Differential – and depicted with histograms (bar charts) with written descriptions. T he first series of charts showed the percentage of tests that were completed within 30 minutes by day, shift and test. Figure 5 gives an example of this first type of chart. A second series of charts displayed performance by department. Figure 6 gives an example of this second type of chart. Diagrams such as Figures 5 and 6 helped the team to understand the variable relationships better. T hey also suggested directions for further evaluations and analyses.
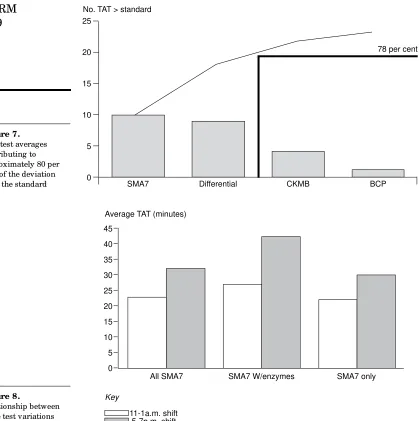
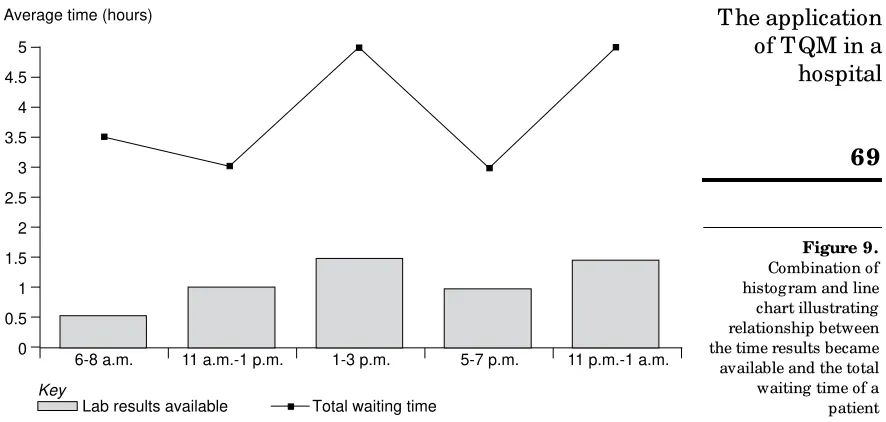
For example, the first and second series of charts induced the T QM team to develop a Pareto diagram that showed, by test, the turnaround time in excess of the 30-minute standard. Figure 7 illustrates the Pareto diagram. Based on the Pareto diagram findings, the team was led to investigate the Stat lab’s average TAT by shift for selected tests. Figure 8 gives an example of this type of chart. T he T QM team also was interested in determining whether there could be factors other than TAT that might impact patient flow within the casualty department. Consequently, the team developed a final chart that compared times in the A E by shift in total and after laboratory results were available. Figure 9 illustrates this last type of chart.
Decision analysis
Using the results of the data analyses, the T QM team had a brainstorming session to develop alternative problem solutions. T his session generated the following technically, organizationally, and economically-feasible alternatives:
● utilize heparinized whole blood instead of serum to decrease the pre-test prep time;
● dedicate a tube system to carry the specimen samples from the A E to the Stat lab;
● add clerk coverage in the Stat lab to cover lunch and other regular workbreaks;
IJ
Q
R
M
1
2
,9
6
6
T a b le I I. S a m p le t u rn a ro u n d tim e (T A T ) f o r c a su a lt y d e p a rt m en t S ta t l a b re su lt sLogged T ime in T ime out T ime in T ime out Triage Triage A E A E A E Test A rrival Comp
MR# Date Shift in registrationregistrationtriage triage draw sent orders draw sent type lab login Centrifuge Instrument Sample Results available
33-85-70 12/14 11A -1P 10:55 10:55 NA 10:39 10:48 11:27 11:10 11:28 CHEM 11:31 11:32 11:37 11:44 SMA 7 12:-06
Mon HEM 11:31 1:31:30 11:34 BCP 11:46
DIF 12:03 (MA N) 04-65-54 12/14 11A -1P 11:00 NA NA NA 11:55 11:31 11:28 11:32 CHEM 11:37 11:39 11:44 11:57 SMA 7 12:01
Mon HEM 11:37 11:39 11:41 BCP 11:46
DIF 12:30 (MA N) 46-12-19 12/14 11A -1P 11:55 12:20 NA NA 11:53 12:25 12:08(1) 12:45 CHEM 12:47 12:51 12:55 1:01 SMA 7 1:31
Mon 12:30(2) HEM 12:47 12:51 12:56 BCP 12:56
12.40(3) DIF 1:25 (MA N)
50-39-93 12/14 11A -1P 11:45 11:45 NA NA 11:33 12.28 12:10 12:48 CHEM 12:52 12:53 12:54 1:01:30 SMA 7 1:18
Mon HEM 12:52 12:53 12:55 BCP 1:00
DIF 1:01 30-71-97 12/14 11A -1P 11:45 12:00 NA 11:42 11:55 12.26 HEM 12:29 12:30 12:33 BCP 12:34
Mon DIF 12:34
50-35-33 12/4 5-7P 4:45 4:42 4:49 4:32 NA 6:02 5:23 6:05 CHEM 6:05 6:06 6:06 6:16 6:17 SMA 7 6:23
Fri HEM 6:05 6:06 6:07 6:08 BCP 6:03
DIF 6:03 46-69-05 12/4 5-7P 4:12 4:05 4:15 3:54 NA 5:30 5:53 5:57 CHEM 5:59 6:01 6:03 6:09 6:10 SMA 7 6:21
Fri HEM 5:59 6:01 6:02 6:06 BCP 6:06
DIF 6:07 29-97-93 12/4 5-7P 4:25 4:28 4:35 4:22 NA 5:45 5:50 5:51 CHEM 5:54 5:57 6:03 6:09 6:10 SMA 7 6:21
Fri HEM 5:54 5:57 6:02 6:06 BCP 6:03
T he application
of T QM in a
hospital
67
● add an additional centrifuge in the Stat lab to decrease pre-test prep time;
● install an online computer between the A E and Stat lab; and
● develop specific liver/cardiac profiles to improve efficiency.
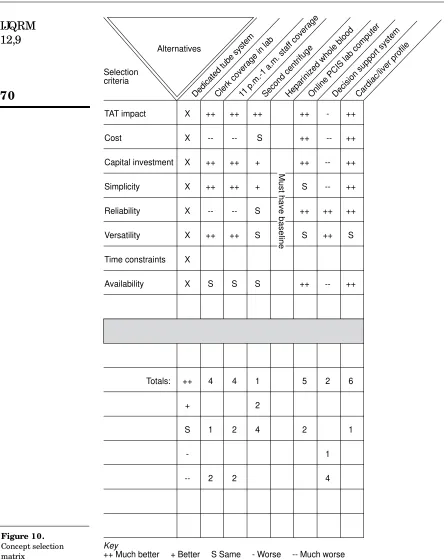
Each alternative was compared against an established set of selection criteria using the concept selection matrix shown in Figure 10.
A s Fig ure 10 illustrates, the multiple criteria were each measured qualitatively throug h the collective judgement of the T QM team. In the
100
90
80
70
60
50
40
30
20
10
0
SMA7 BCP Differential Other
Per cent tests within TAT standard (30 mins)
Key
Friday, 4/12/92 Wednesday, 9/12/92 Monday, 14/12/92
Figure 5. Lab performance related to four test types and comparing three days
1 5 10 15 20 25 30 35 40
16
14
12
10
8
6
4
2
0
Number of specimens
IJQRM
12,9
68
evaluation, the team sought the alternatives that generated better (+ ) or much better (+ + ) than baseline performances across the multiple criteria. T he decision analysis revealed that alternative (3) would have a significant impact on turnaround time and be the easiest and least costly to implement. Owing to the adverse consequences of failing to meet the 30-minute turnaround target, however, the T QM team recommended that all seven alternatives should be considered for implementation.
45
40
35
30
25
20
15
10
5
0
Average TAT (minutes)
All SMA7 SMA7 W/enzymes SMA7 only
Key
11-1a.m. shift 5-7p.m. shift
Figure 8.
Relationship between three test variations over two shifts
78 per cent
SMA7 Differential CKMB BCP
25
20
15
10
5
0
No. TAT > standard
T he application
of T QM in a
hospital
69
Implementation
A booklet and storyboard presentation was developed by the T QM team. T he booklet summarized the team process, and the storyboard presentation closely followed the booklet. A n executive summary, with supporting details, was first presented by the T QM team to senior leadership at the hospital. Later, the T QM team leader shared the results with the hospital’s medical executive and medical affairs committees. Based on these presentations, the hospital’s senio r leadership approved all of the T QM team’s recommendations.
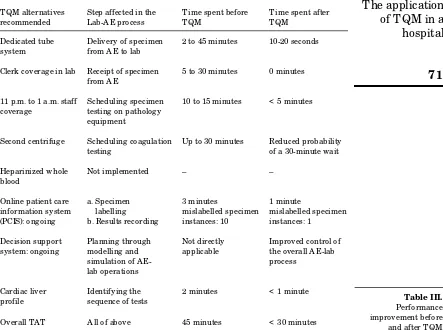
Table III sets out the A E-pathology operations before and after the use of T QM. It also reports the pathology turnaround times corresponding to these operations. A s the table shows, the use of T QM met the hospital’s objective of reducing pathology TAT significantly.
Benefits
T he policy recommendations ensure that Stat lab TAT will be reduced from the existing 45 minutes to under the targeted 30 minutes. T his faster turnaround time is expected to improve patient and attending staff satisfaction, speed the patient flow, and prov ide a competitive ER perfo rmance advantage over neighbouring institutions.
T he T QM team’s A E-Stat lab study constituted the hospital’s first formal CQI effort. T his effort yielded important lessons for the hospital. T hese lessons involve organizational, educational and information system considerations. Table IV outlines the recommendations suggested by the lessons and the utility of these recommendations to hospital management.
Organizational. During the A E-Stat lab study, the T QM team identified a
number of other hospital operations that could benefit from CQI analyses. T hese operations included:
5
4.5
4
3.5
3
2.5
2
1.5
1
0.5
0
Average time (hours)
Key
Lab results available Total waiting time
6-8 a.m. 11 a.m.-1 p.m. 1-3 p.m. 5-7 p.m. 11 p.m.-1 a.m.
IJQRM
12,9
70
TAT impact X ++ ++ ++ ++ - ++
Cost X -- -- S ++ -- ++
Capital investment X ++ ++ + ++ -- ++
Simplicity X ++ ++ + S -- ++
Reliability X -- -- S ++ ++ ++
Versatility X ++ ++ S S ++ S
Time constraints X
Availability X S S S ++ -- ++
Totals: ++ 4 4 1 5 2 6
+ 2
S 1 2 4 2 1
- 1
-- 2 2 4
Dedicated tube systemClerk coverage in lab11 p.m.-1 a.m. staf f coverage
Second centrifugeHeparinized whole bloodOnline PCIS lab computerDecision support systemCardiac/liver profile Selection
criteria
Must have baseline
Key
++ Much better + Better S Same - Worse -- Much worse Alternatives
T he application
of T QM in a
hospital
71
● accident and emergency registration;
● accident and emergency admissions;
● laboratory department floor sampling.
A s part of the final report, the T QM team recommended that the hospital perform these additional CQI analyses in the future.
Educational.T he A E/Stat lab T QM team educated themselves in T QM/CQI
philosophies and concepts. W hile this self-education was personally beneficial to the indiv idual team members, the process w as inefficient from a time management perspective. Based on these experiences, the A E-Stat lab group recommended that, prior to implementation, the hospital provide education on T QM/CQI to upper level management and to the medical and support staffs. T he A E-Stat lab g roup also suggested that any future T QM team receive a structured orientation to the CQI process.
Information systems. T QM/CQI is a data-driven process. Since none of the
necessary information was available from the hospital’s existing information
Table III. Performance improvement before
and after T QM T QM alternatives Step affected in the T ime spent before T ime spent after
recommended Lab-A E process T QM T QM
Dedicated tube Delivery of specimen 2 to 45 minutes 10-20 seconds
system from A E to lab
Clerk coverage in lab Receipt of specimen 5 to 30 minutes 0 minutes from A E
11 p.m. to 1 a.m. staff Scheduling specimen 10 to 15 minutes < 5 minutes coverage testing on pathology
equipment
Second centrifuge Scheduling coagulation Up to 30 minutes Reduced probability
testing of a 30-minute wait
Heparinized whole Not implemented – –
blood
Online patient care a. Specimen 3 minutes 1 minute
information system labelling mislabelled specimen mislabelled specimen (PCIS): ongoing b. Results recording instances: 10 instances: 1
Decision support Planning through Not directly Improved control of system: ongoing modelling and applicable the overall A E-lab
simulation of A E- process
lab operations
Cardiac liver Identifying the 2 minutes < 1 minute profile sequence of tests
IJQRM
12,9
72
systems, the T QM team was forced to collect the facts manually. T he manual collection was a time-consuming and error-prone process. To alleviate these data collection problems, the T QM team recommended that the hospital implement an automated bar coding sy stem to collect T QM/CQI data automatically. T he team also sug gested that the bar coding sy stem be integ rated within the institution’s hospital information and decision support systems.
Conclusions
T he hospital’s A E/Stat lab project is an application of c lassic T QM/CQI principles and concepts. T he endeavour received a firm commitment from top management; there was an emphasis on the prevention of problems, improvement of processes, and total customer satisfaction; every affected party was involved in the effort; a quality team was created to identify problems and improve all relevant processes; the team utilized analytical tools, such as Pareto diag rams and control charts, to ascertain whether quality standards and customer specifications were being met; and the team focused on the process of producing a service in a systematic way that integrates all departments in the goal of maximizing quality[17,18]. Moreover, employees are being trained in quality techniques, with systems in place to ensure that high quality is achieved; managers are functioning more like facilitators whose main task is to guide and support empowered employees; and the enterprise is attempting to provide services as good as, or better than, those of the competition.
Table IV. Recommendations
A rea Recommendation Management value
Organizational Re-engineer the A E department Speed patient flow: reduce A E costs; registration and admission and improve staff and patient
processes satisfaction
Re-engineer laboratory floor Speed specimen flow: reduce lab sampling costs; improve A E-lab co-ordination:
and improve staff and patient satisfaction
Educational Provide T QM/CQI education Promote T QM philosophy to hospital management and throughout the hospital; facilitate
staff the T QM process; and improve the
hospital’s competitiveness Provide structured CQI Improve the efficiency and education for T QM team effectivenesss of the T QM process Information systems Implement a barcoding system Facilitate T QM data collection;
system to collect T QM/CQI reduce T QM costs; and improve data automatically staff satisfaction
T he application
of T QM in a
hospital
73
SJH also followed a classic prescription for success in T QM/CQI applications. T hey identified a small number of important, customer-focused areas and achieved (and built on) successes supported by measurable results. T he quality management system yielded concrete results. Rewards came in the form of continuous improvements that, over time, would reduce variation in TAT, lower costs, improve productivity and create returns on their investments.
T he same principles and concepts can be applied with equal success at other hospitals and health-care institutions. Building on these successes, however, will require improved information system support for the T QM/CQI processes within the hospital setting[19]. A s this case demonstrates, T QM/CQI is highly dependent on information dissemination and feedback at and across all levels of the hospital, and analy tical techniques are required to evaluate systematically quality management alternatives. Existing hospital information systems are ill-equipped to provide the necessary support, but intelligent decision support systems can be developed to close the support gaps[20]. Such technology will facilitate the hospital’s ability to respond quickly to rapid, often unexpected, changes in patient needs.
References
1. Buccini, E., “Total quality management in the critical care environment: a primer”, Critical Care Clinics, Vol. 9 No. 3, 1993, pp. 455-63.
2. Perigord, M., A chieving Total Quality Management: A Program for A ction, Productivity Press, Cambridge, MA , 1990.
3. A ustin, C.J., Information Systems for Health Services A dministration, 3rd ed., Health A dministration Press, A nn A rbor, MI, 1988.
4. Burda, D., “Study rates US hospitals vs. other nations, industries”, Modern Healthcare, Vol. 21 No. 40, 1991, pp. 36-8.
5. Wakefield, D.S. and Wakefield, B.J., “Overcoming the barriers to implementation of T QM/CQI in hospitals: myths and realities”, Quality Review Bulletin,Vol. 19 No. 3, 1 March 1993, p. 83.
6. Goldfield, N., “Measurement and management of quality in managed care organizations: alive and improving”, Quality Review Bulletin, Vol. 17, 1991, pp. 343-8.
7. Ventura, M., Rizzo, J. and Lenz, S., “Quality indicators: control maintains, propriety improves”, Nursing Management, Vol. 24 No. 1, 1993, pp. 46-50.
8. Buterbaugh, L., “T QM: the quality care revolution”, Medical World News, Vol. 33, 1992, pp. 17-21.
9. Hudson, T., “Partners in design”, Hospitals & Health Networks,Vol. 67 No. 15, 1993, pp. 70-4.
10. A ldrich, R., Emergency Department “ T hru-put” A nalysis, Franciscan Forum Franciscan Health System, A ston, PA , 1993.
11. McEarchern, J.E., Schiff, L. and Cogan, O., “How to start a direct patient care team”, Quality Review Bulletin, Vol. 18 No. 6, 1 June 1992, p. 191.
IJQRM
12,9
74
13. Cembrowski, G.S. and Steindel, S., Emergency T urnaround T ime: Data A nalysis and Critique, 90-13A , Q Probes, College of A merican Pathologists, Northfield, IL, 1990. 14. Steindel, S. and James, B.,Routine Test Turnaround T ime Data A nalysis and Critique,
91-05A , Q Probes, College of A merican Pathologists, Northfield, IL, 1991.
15. Ringel, M., “Emergency turnaround times”, CAT Today, Vol. 8 No. 12, 1994, pp. 1-33. 16. Kerlinger, F.N., Foundations of Behavioral Research, Holt, Rinehart & Winster, Fort Worth,
T X, 1986.
17. Gore, M. and Stubbe, J., Contemporary Systems A nalysis, 5th ed., Business and Educational Technologies, Dubuque, IA , 1994, chapter 2.
18. Kumar, S. and Gupta, Y.P., “Statistical process control at Motorola’s A ustin assembly plant”, Interfaces, Vol. 23 No. 2, March-April 1993, pp. 84-92.
19. Pasternac k, A . (Ed.), “ Refo rm w ill drive health care computing ” , HIM SS Ne ws, Vol. 4 No. 4, 1993, pp. 4-5.
20. Kohli, R. and Forgionne, G.A ., “A pplying concurrent engineering concepts to clinical information systems”, Healthcare Information M anagement,Vol. 6 No. 4, Fall 1992, pp. 13-16.
Further reading
A ly, N.A . and Mac, R., “T QM implementation in hospitals”, Computers & Industrial Engineering, Vol. 25 Nos. 1-4, September 1993, pp. 299-302.
Berwick, D.M., Godfrey, A .B. and Roessner, J., Curing Health Care: Strategies for Improvement, Jossey-Bass, San Francisco, CA , 1990.
Geber, B., “Can T QM cure health care?”, Training, Vol. 29 No. 8, 1 August 1992, p. 25.
Grayson, M.A ., “Benchmark T QM survey tracks a new management era in administration”, Hospitals, Vol. 66, 5 June 1992, pp. 26-7.
Hamilton, J., “Toppling the power of the pyramid: team-based restructuring for T QM, patient-centered care”, Hospitals,Vol. 67 No. 1, 5 January 1993, pp. 38-41.
Hug hes, J.M., “ Total quality manag ement in a 300-bed community hospital: the quality improvement process translated to health care”, Quality Review Bulletin,Vol. 18 No. 9, September 1992, p. 293.
Mahlen, K.A ., “A chieving superior performance through process improvement”, Healthcare Financial Management, Vol. 47 No. 9, September 1993, p. 45.
Patrick, M. and Scott, T., “Maturing of management engineering in today’s hospitals”, Industrial Engineering, Vol. 25 No. 4, April 1993, pp. 32-6.
T he application
of T QM in a
hospital
75
A ppendix. W orksheet example to collect representative work condition data
Patient name/chart number Time blood sent from triage Time orders written Time blood drawn Time blood sent Results received